
National Center for Education Statistics – By Region, Demographic and Schooling Year
Page Contents
- Introduction
- Editor’s Choice
- What is National Center for Education Statistics?
- General National Center for Education Statistics
- By Schooling Year
- By Demographic
- By Region
- By Technology Provided
- Weapons Confiscated At Public Schools
- By providing a program for social and emotional wellbeing
- By Type Tutoring
- By Ethnicity
- By Reasons For Changing Plans
- Conclusion
Introduction
National Center for Education Statistics: Evaluating, and understanding the overall education system in the country is the most important step before setting any related policies. The National Center for Education Statistics is exactly performing similar activities in the United States of America. Research, collection, analysis, and study of various factors affecting education and its quality are provided in the reports by this department.
Insights in these Statistics have been written to gain more information on various factors in the education industry in the United States of America including COVID 19 period. Furthermore, the information based on these statistics is written region-wise in the United States of America.
Editor’s Choice
- In the year 2022, students with black ethnic backgrounds resulting in 95% completed at least high school level education.
- The National Center for Education Statistics says that in the year 2021 Fall semester, there were around 34 million students who attended prekindergarten to grade 8 level.
- According to the National Center for Education Statistics, in the year 2021, high school goers who gained 4+ arts credits were enrolled in a 4-year college, at a higher rate than those students with lesser high school credits.
- 4 million students attended schooling years from 9 to 12, out of these, 4.2 million were in grade 9 and the remaining students attended high school level schooling years.
- In the schooling year 2021, there were around 3 million teachers in public schools.
What is National Center for Education Statistics?
The National Center for Education Statistics (NCES) is a United States Department of Education segment belonging to the Institute of Education Sciences (IES). The department collects, analyses, and publishes statistics on public schools and other related educational and financial information based in the United States of America. The department was formed in 1867 and has its headquarters in Washington, D.C. Furthermore, the data they publish include the following topics: Cost and financing, Literacy, Policy, Accreditation – Primary, Secondary, and Post-secondary, student financial aid, credentialism, and graduate unemployment.
General National Center for Education Statistics
- According to the National Center for Education Statistics, in the year 2021, high school goers who gained 4+ arts credits were enrolled in a 4-year college, at a higher rate than those students with lesser high school credits.
- In the schooling year 2021, there were around 3 million teachers in public schools.
- As of June 2022, 10% of schools in the United States of America offered hybrid instruction, 33% of public schools gave remote instructions and 98% of the public offered full-time in-person instruction to students.
By Schooling Year
- The National Center for Education Statistics says that in the year 2021 Fall semester, there were around 34 million students who attended prekindergarten to grade 8 level.
- Out of these 1.4 million were in pre-kindergarten and 3.6 million were in kindergarten.
- Moreover, 15.4 million students attended schooling years from 9 to 12.
- Out of these, 4.2 million were in grade 9 and the remaining students attended high school level schooling years.
By Demographic
- In the year 2022, students with black ethnic backgrounds resulting in 95% completed at least high school level education.
- As of 2021, around 63% of black ethnicity students aged 3 years to 5 years were enrolled in the school.
- In the school year of 2021, National Center for education studies states the following number of students enrolled from prekindergarten to grade 12 in the United States of America: Pacific Islander Students (0.2 million), American India/Alaska Native Students (0.5 million), students with Mixed races (2.3 million), Asian students (2.7 million), Black students (7.4 million), Hispanic students (14.1 million), and White students (22.4 million) and total students in public school were 49.5 million.
 (Source: NCES)
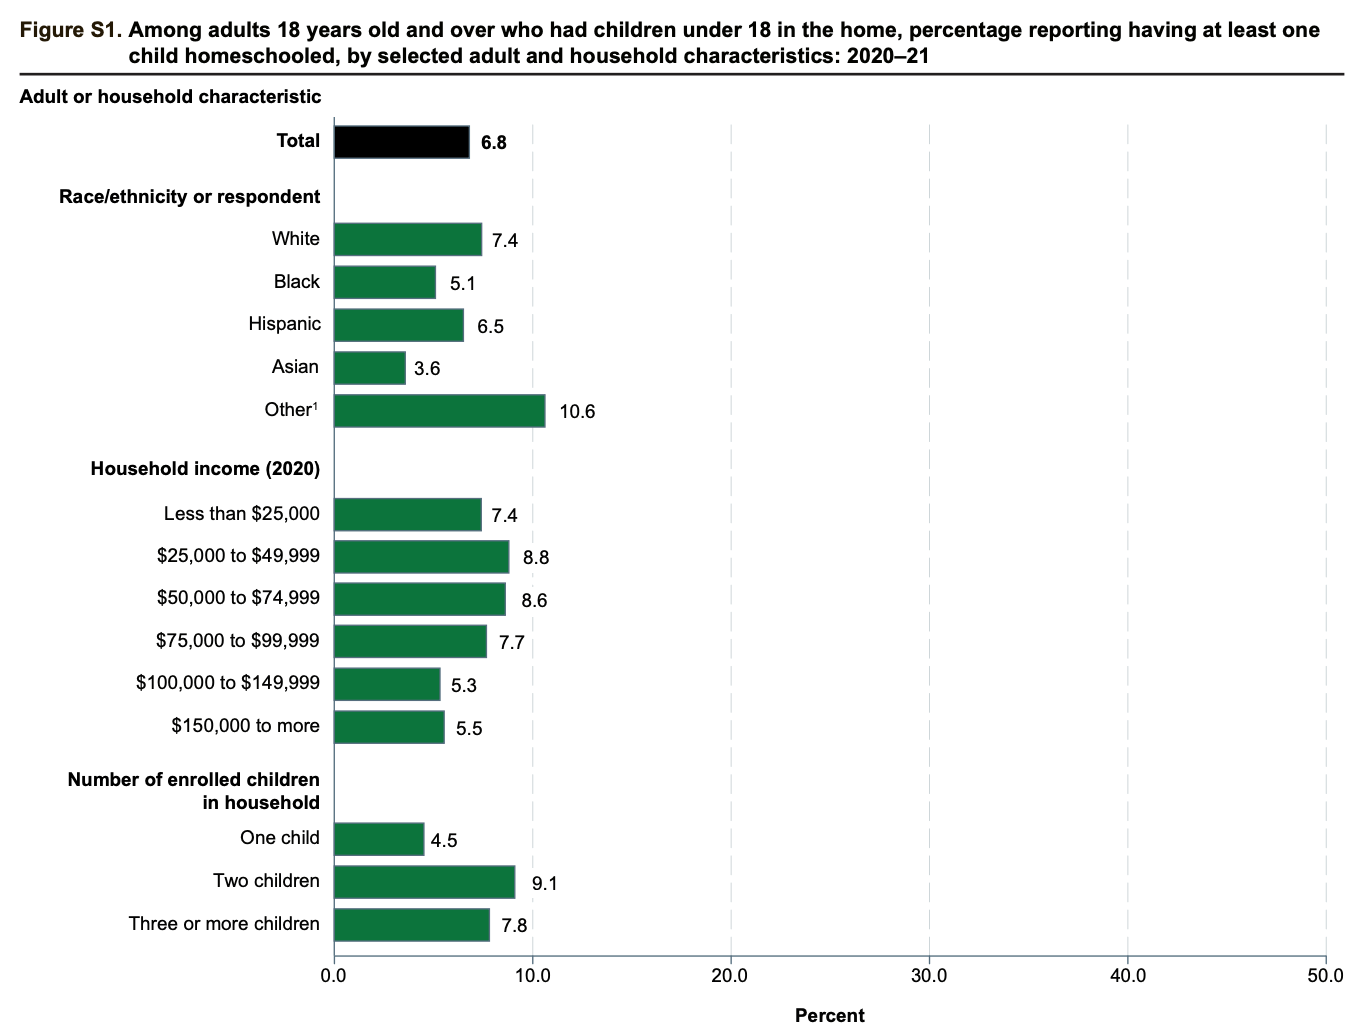
- According to the National Center for Education Statistics, there were around 6.8% of households in the United States of America, had their children homeschooled for the education year 2021.
- Out of these following demographic data provides information by various characteristics in the similar segment:
- 4% of households with white and 5.1% of black ethnic people homeschooled at least one of their children.
- Similarly, 6.5% of Hispanics, 3.6% of Asians, and the majority of 10.6% of various races people had children out of which at least one was homeschooled.
- Considering the similar segment by household income it presents the following data: Less than $25,000 p.a. (7.4%), $25,000 to 49,999 (8.8%), $50,000 to $74,999 (8.6%), $75,000 to $99,999 (7.7%), $100,000 to $149,999 (5.3%) and $150,000 and above (5.5%).
- Furthermore, the number of children in households in the United States of America who were homeschooled in the year 2021 is as follows: one child (4.5%), two children (9.1%), and three or more children (7.8%).
By Region
By Technology Provided
(Source: ies.ed.gov)
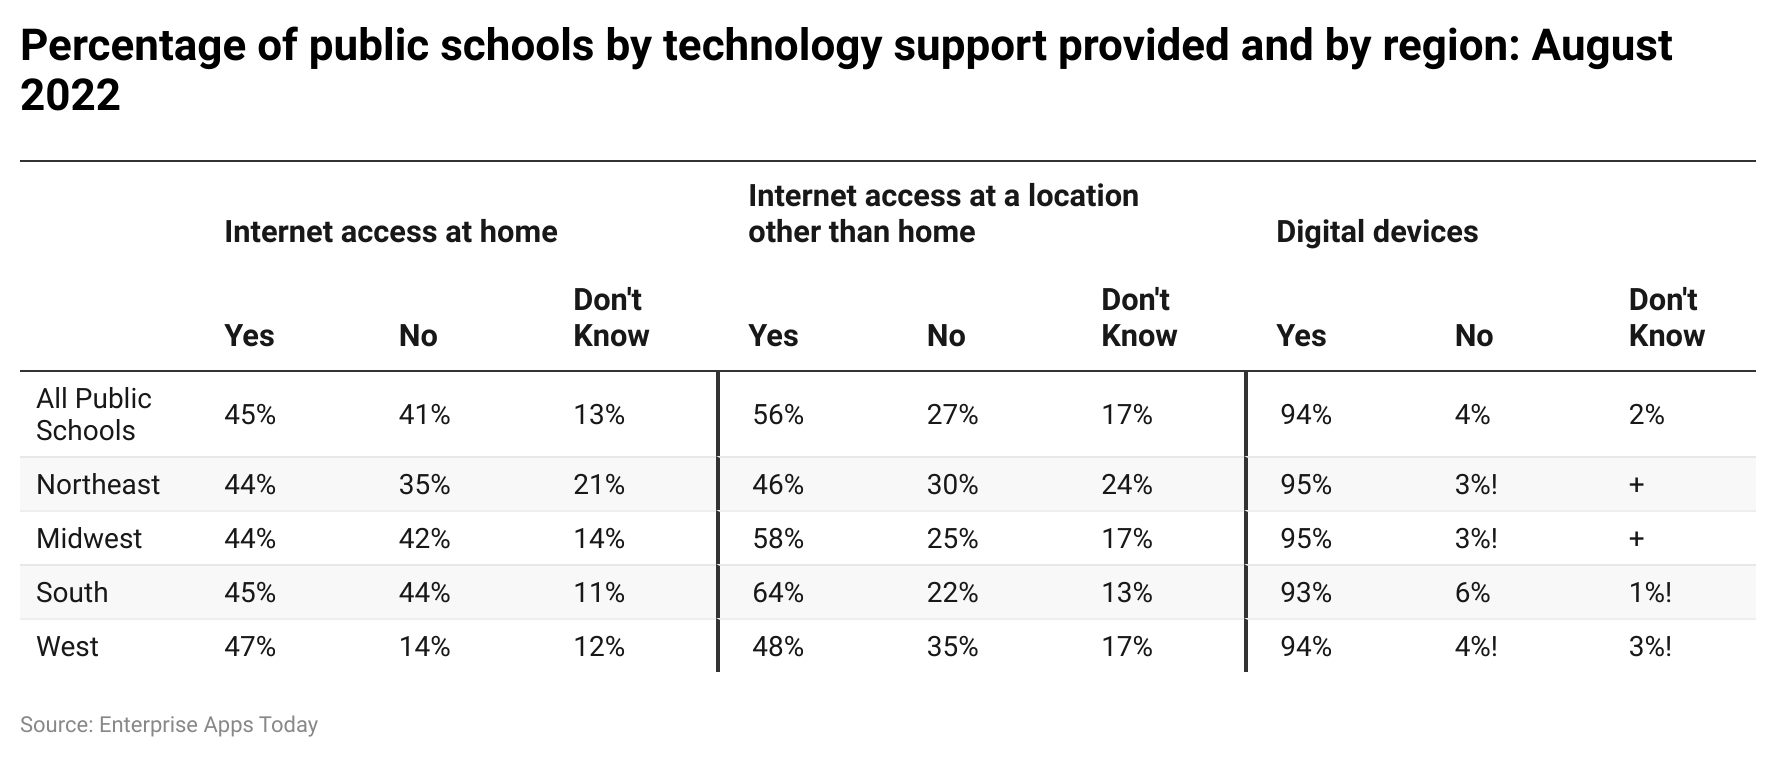
- National Center for Education Statistics provides information on provided digital services and internet access at home as well as at other locations for the purpose of schooling in August 2022.
Students with Internet access at home:
- There was total of 45% of public schools have internet access at home while 41% did the opposite. 13% of them were unaware of the information.
- Furthermore, region-wise information on public school with internet access at home is as follow Northeast (44%), Midwest (44%), South (45%), and West (47%).
- Public schools provided no internet access at home: Northeast (35%), Midwest (42%), South (44%), and West (41%).
- Schools with unawareness about internet access at home: Northeast (21%), Midwest (14%), South (11%), and West (12%).
Students with access at locations other than home:
- In the above category, there were a total of 56% of schools provided the internet at various locations, while 27% didn’t provide it and 17% were unaware of it.
- Schools that provided internet access at other locations: Northeast (46%), Midwest (58%), South (64%), and West (48%).
- Schools that didn’t provide internet access even at other locations: Northeast (30%), Midwest (25%), South (22%), and West (35%).
- Schools that were unaware of it: Northeast (24%), Midwest (17%), South (17%), and West (13%).
- There were around 94% of schools provided other digital services for students, and 4% did the opposite. While 2% were not sure about it.
- Schools that provided digital services: Northeast (95%), Midwest (95%), South (93%), and West (94%).
- Schools that didn’t provide digital services: Northeast (3%), Midwest (3%), South (6%), and West (4%).
- Schools that were unaware of it: Northeast (2%), South (1%), and West (3%).
(Source: ies.ed.gov)
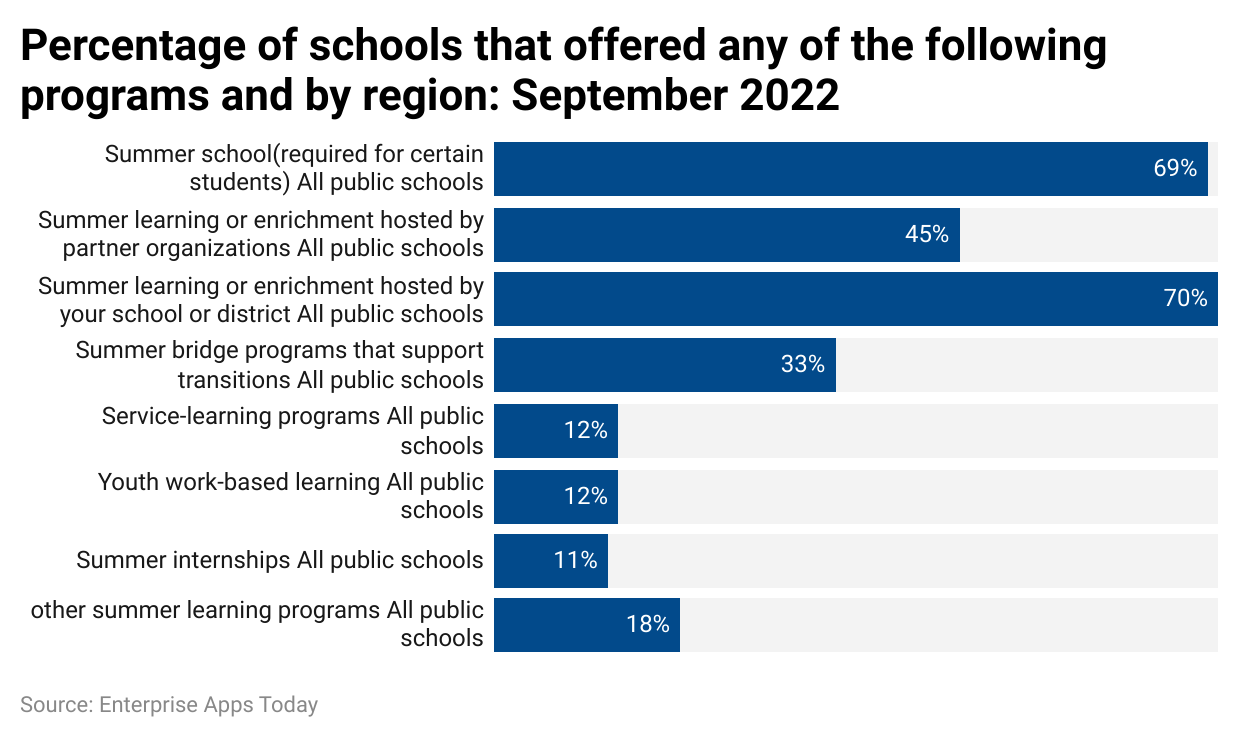
- As of September 2022, the summer program offered by all public schools resulted in 69%.
- 45% and 70% of public schools offered summer learning or enrichment hosted by partner organizations and summer learning or enrichment hosted by the school or district.
- 33% of the schools offered summer bridge programs that supported transitions.
- 12% of the public school respectively provided service-learning programs and youth work-based learning.
- Summer internships and other summer learning programs were offered respectively by 11% and 18% of public schools.
Weapons Confiscated At Public Schools
(Source: ies.ed.gov)
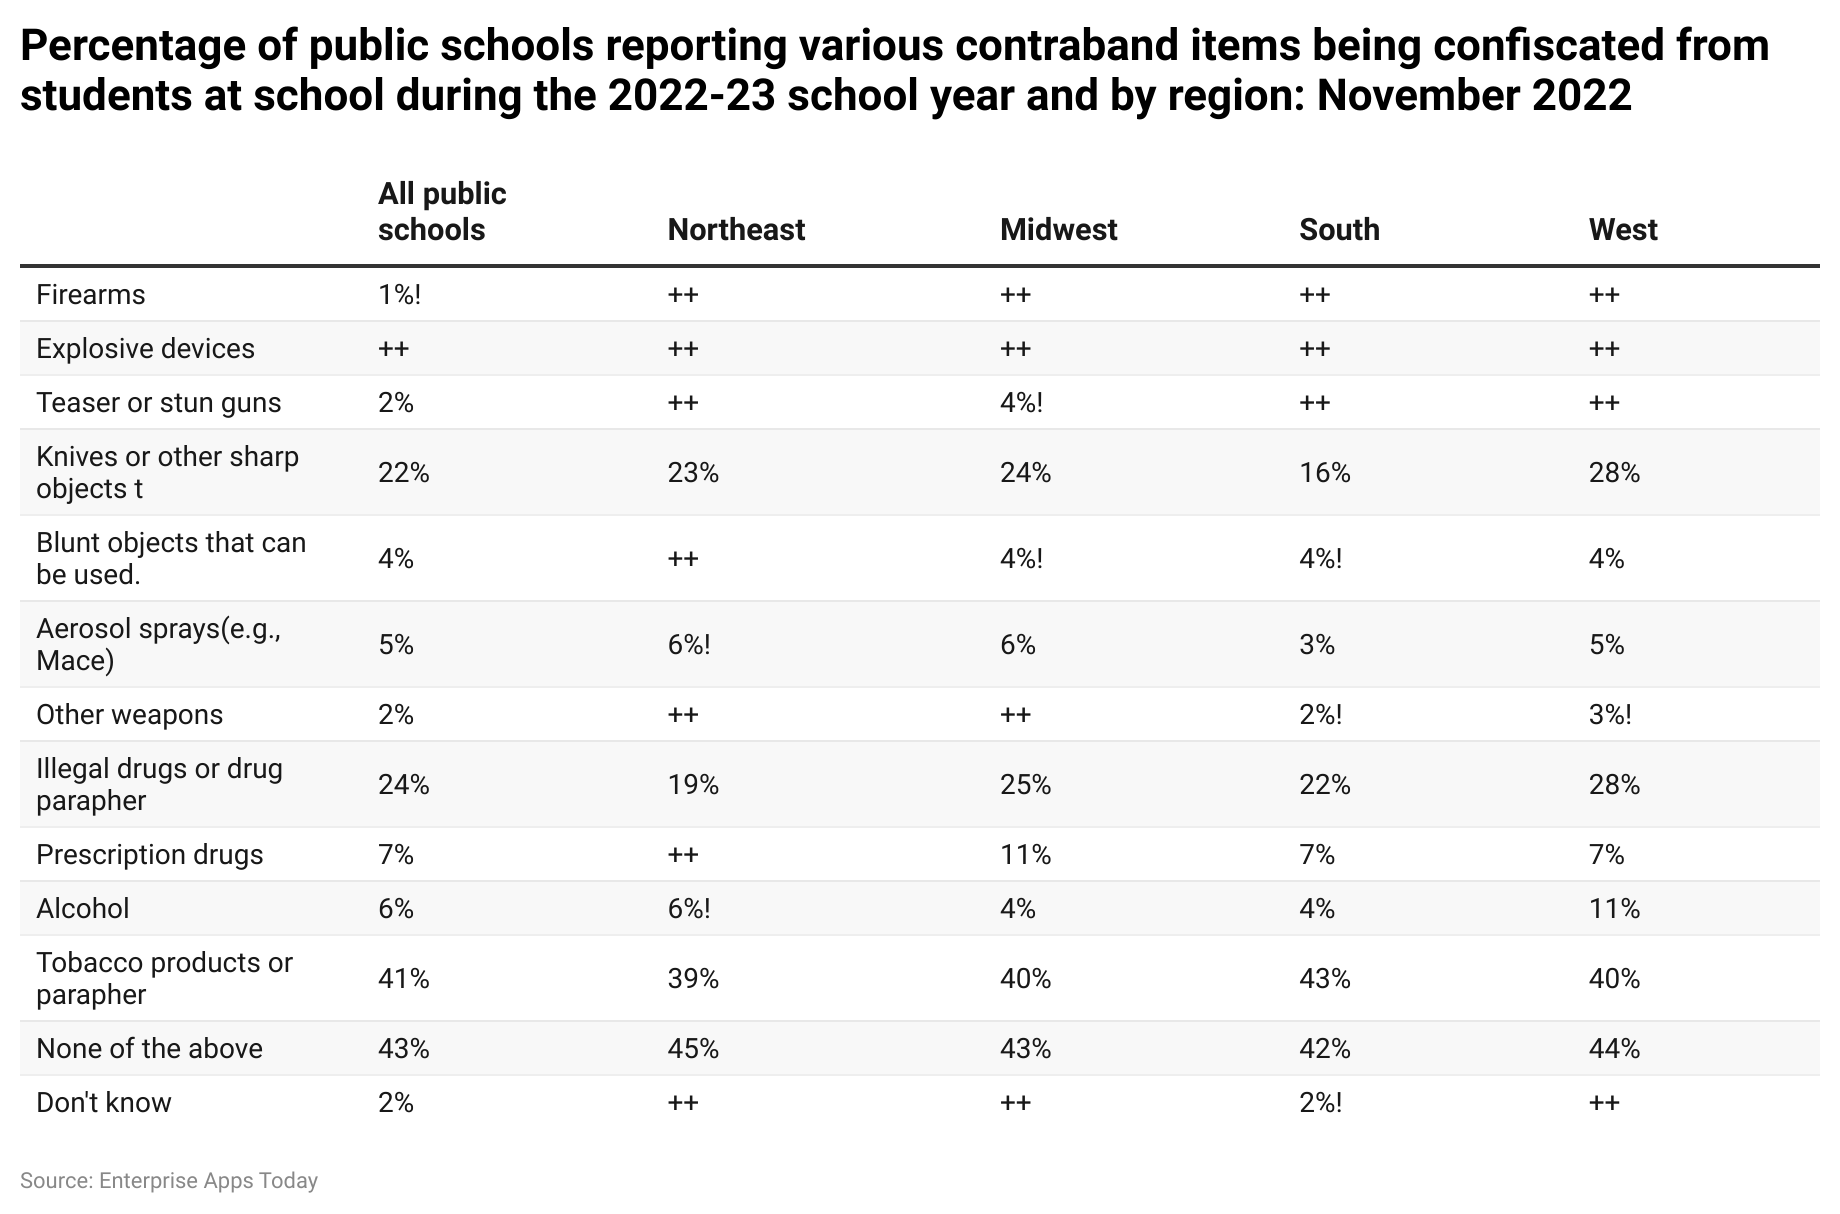
- As of November 2022, National Center for Education Statistics provided insights into the overall dangerous weapons which were confiscated at public schools, region wise information is not yet available in the case of firearms and explosive devices.
- Further data shows the data of types of confiscated weapons:
Knives or other sharp objects
- All public schools: 22%
- Northeast: 23%
- Midwest: 24%
- South: 16%
- West: 28%
Blunt Objects
- All public schools: 4%
- Midwest: 4%
- South: 4%
- West: 4%
Aerosol sprays
- All public schools: 5%
- Northeast: 6%
- Midwest: 6%
- South: 3%
- West: 5%
Other weapons
- All public schools: 2%
- South: 2%
- West: 3%
Illegal drugs
- All public schools: 24%
- Northeast: 19%
- Midwest: 25%
- South: 22%
- West: 28%
Prescription drugs
- All public schools: 7%
- Midwest: 11%
- South: 7%
- West: 7%
Alcohol
- All public schools: 6%
- Northeast: 6%
- Midwest: 4%
- South: 4%
- West: 11%
Tobacco products
- All public schools: 41%
- Northeast: 39%
- Midwest: 40%
- South: 43%
- West: 40%
Other/ none of the above
- All public schools: 43%
- Northeast: 45%
- Midwest: 43%
- South: 42%
- West: 44%
Unknown
- All public schools: 2%
- South: 2%
(Source: ies.ed.gov)
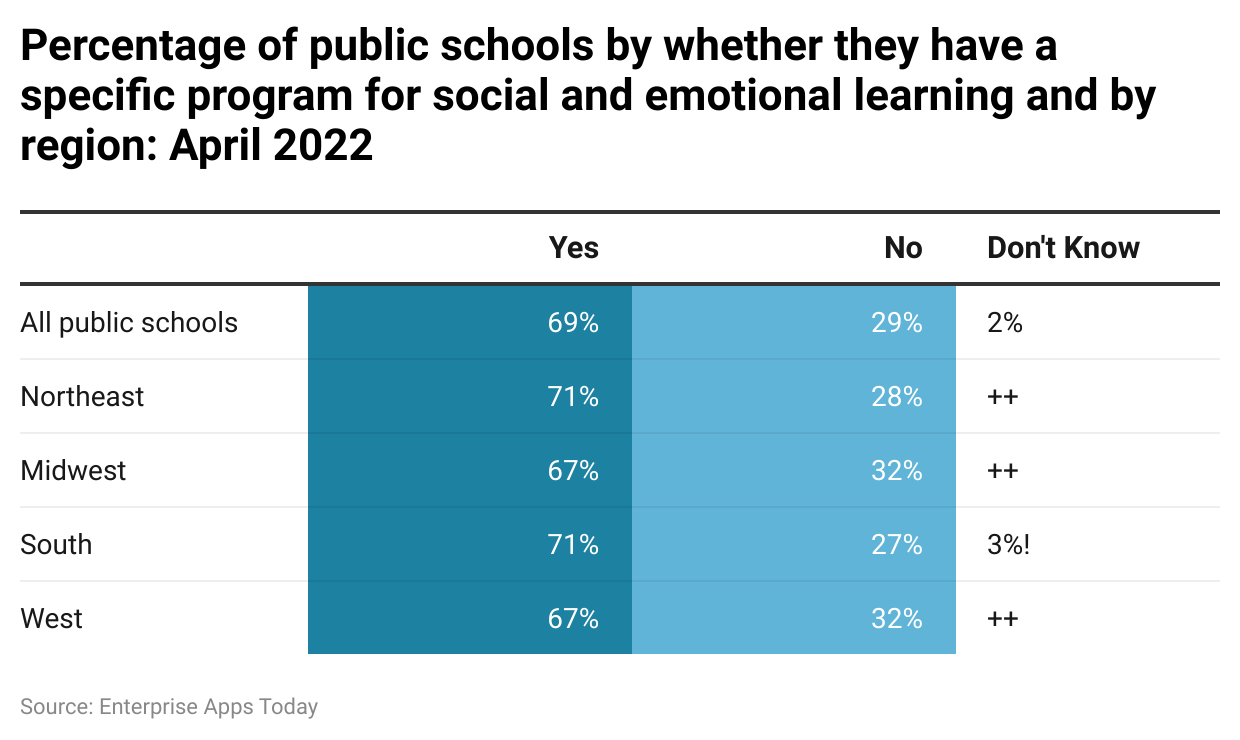
- As of April 2022, National Center for Education Statistics stated that there were a total of 69% of public schools in the United States of America provided any specific program for social and emotional learning for their students.
- On the other hand, 29% of public schools didn’t provide any of such programs and 2% were unaware of them.
- Total percentage of schools in the United States of America that provided various programs region-wise Northeast (71%), Midwest (67%), South (71%), and West (67%).
- Total percentage of schools in the United States of America that didn’t provide various programs: region-wise Northeast (28%), Midwest (32%), South (27%), and West (32%).
- Total percentage of schools in the United States of America that were unaware of it: All public schools (2%) and South (3%).
By Type Tutoring
(Source: ies.ed.gov)
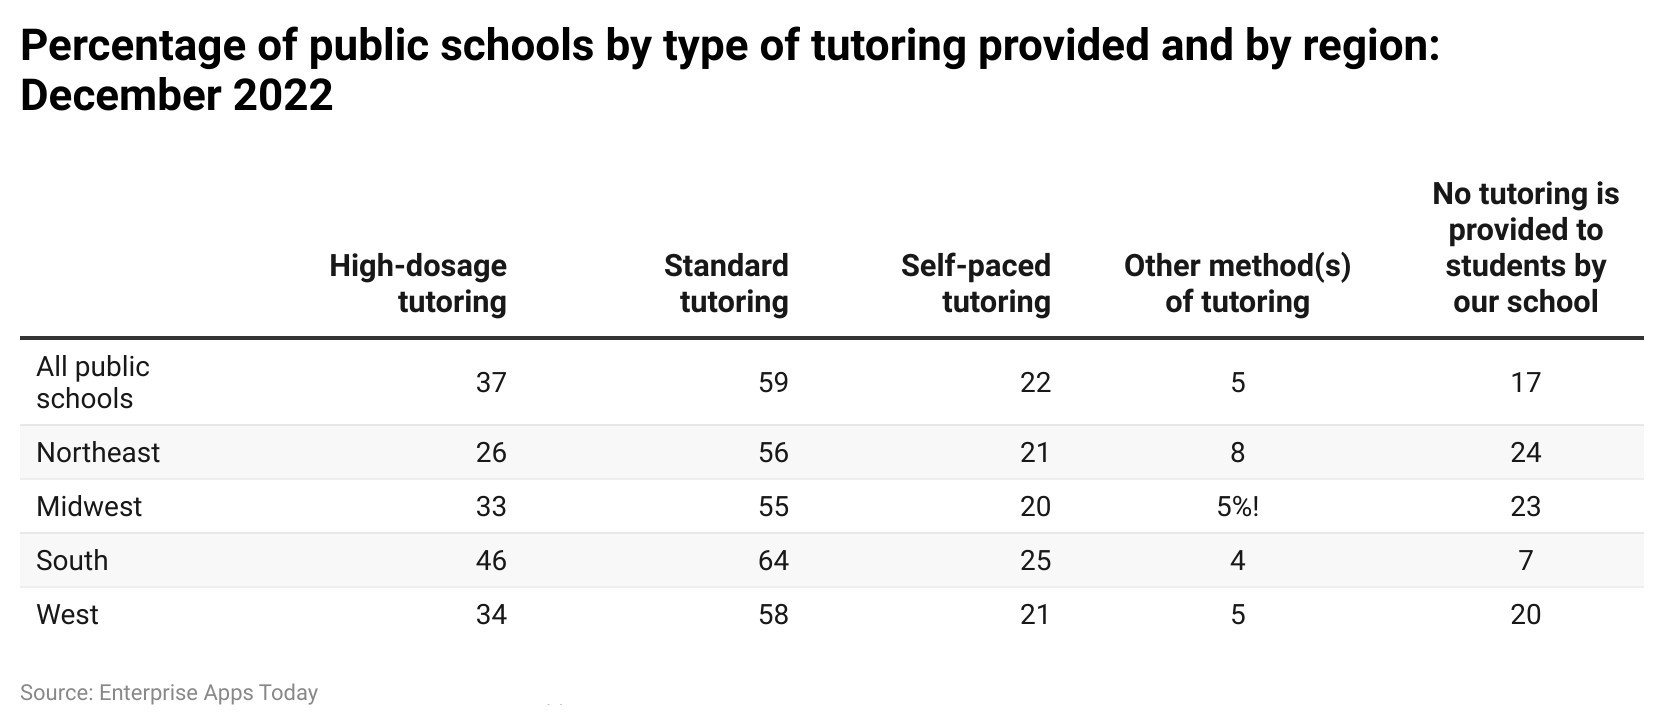
- Furthermore, National Center for Education Statistics states that as of December 2022, around 37% of public schools provided high-dosage tutoring, 59% gave standard tutoring, 22% offered self-paced tutoring, 5% offered various types of tutoring and around 17% didn’t provide any tutoring to students.
- The region-wise insights into the type of tutoring provide the following information:
High-dosage tutoring
- Northeast (26%)
- Midwest (33%)
- South (46%)
- West (34%)
Standard tutoring
- Northeast (56%)
- Midwest (55%)
- South (64%)
- West (58%)
Self-paced tutoring
- Northeast (21%)
- Midwest (20%)
- South (25%)
- West (21%)
Other methods of tutoring
- Northeast (8%)
- Midwest (5%)
- South (4%)
- West (5%)
No tutoring services are provided by schools
- Northeast (24%)
- Midwest (23%)
- South (7%)
- West (20%)
By Ethnicity
(Source: NCES)
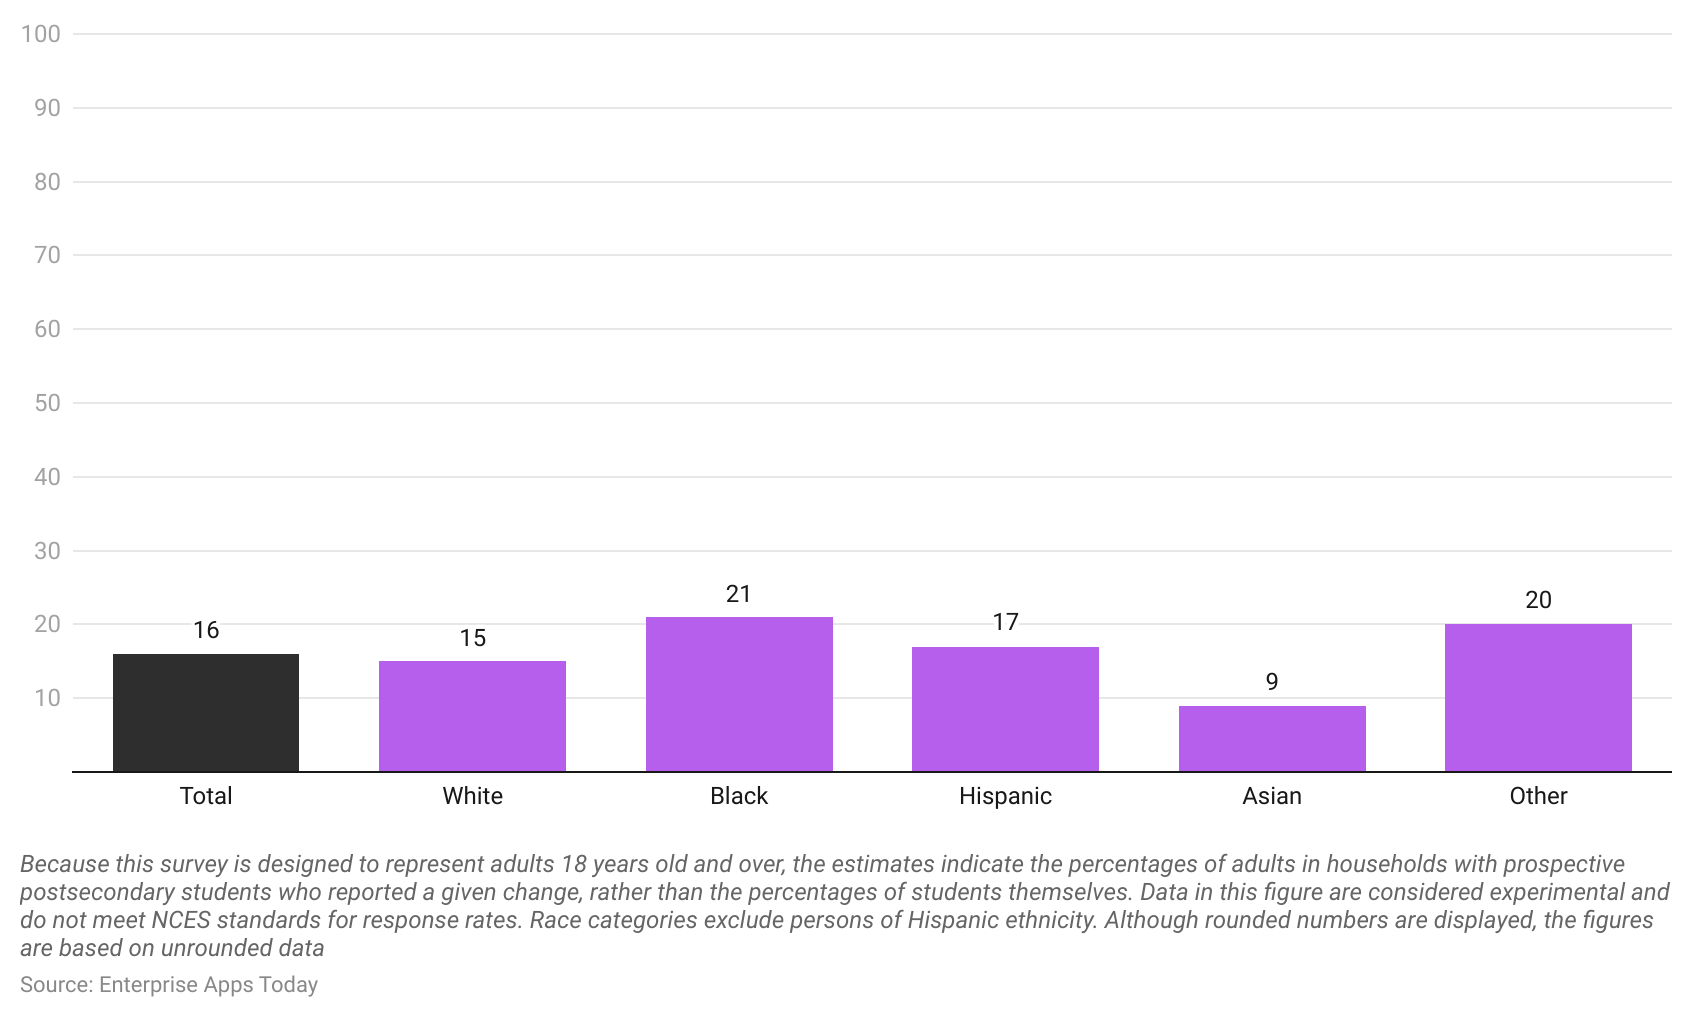
- As of August 2021, insights studied by National Center for Education Statistics for ethnic background state that there were 16% of students who planned classes for Fall 2021 canceled at least once.
- Furthermore, the following information was recorded for different ethnic groups White (15%), Black (21%), Hispanic (17%), Asian (9%), and other races group (20%).
By Reasons For Changing Plans
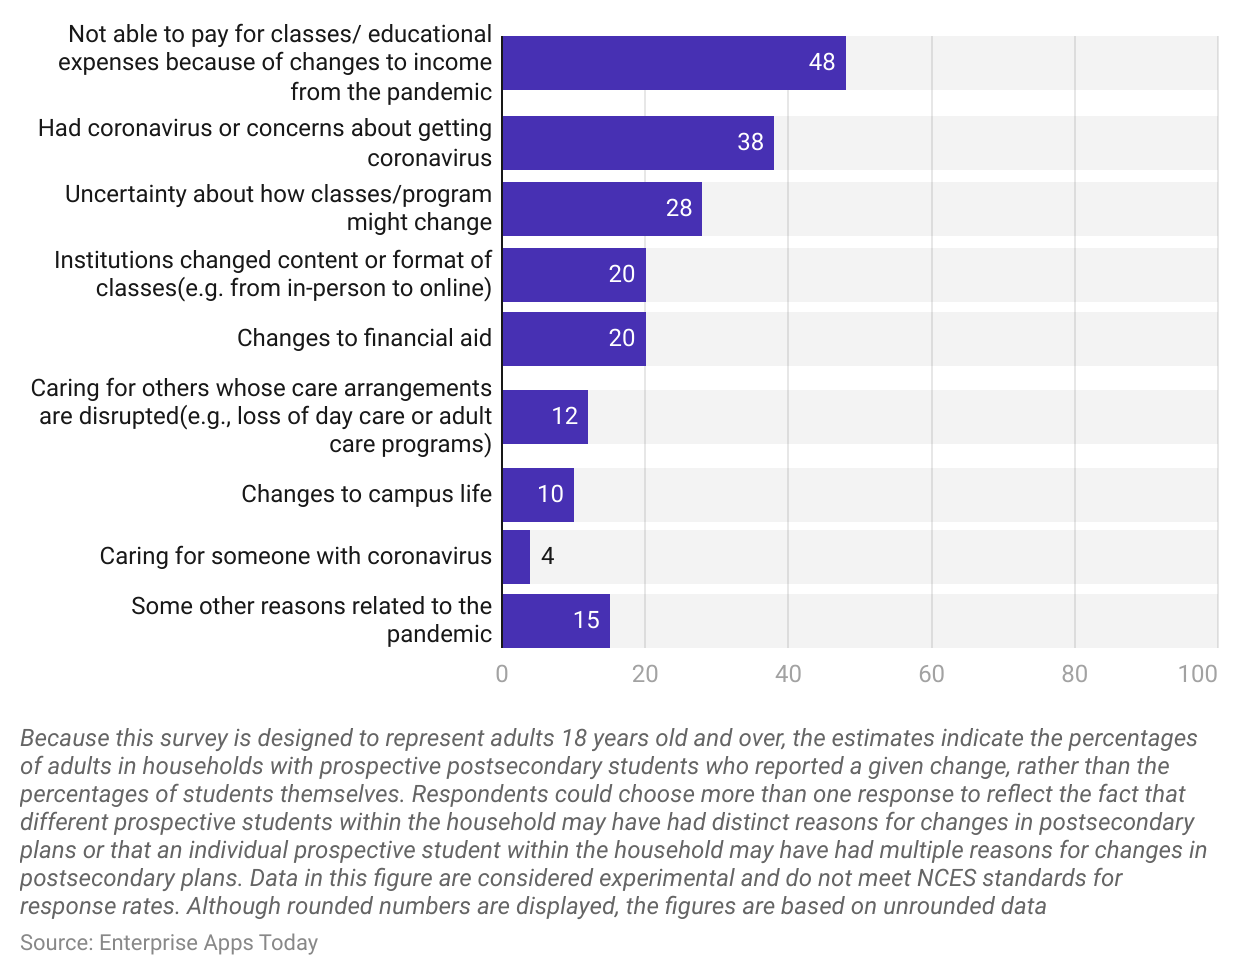
(Source: NCES)
- In the United States of America, as of August 2021, the maximum number of people stated that they were unable to pay the fees for postsecondary education, therefore they changed or canceled the plan resulting in 48%.
- 38% of the students canceled their plans because some of them had coronavirus and some were concerned about getting affected by the coronavirus.
- Further reasons given were as follows: Uncertainty about how classes/programs might change (28%), Institution changed content or format of classes (20%), Changes to financial aid (20%), Caring for others whose care arrangements are disrupted (12%), Changes to campus life (10%), Caring for someone with coronavirus (4%) and some other reasons related to the pandemic (15%).
Conclusion
In the United States of America, the National Center for Education Statistics stands as a crucial department. Information collected and studied by them provides education-related information in the country. The reports prepared by them are used as insights by various researchers, the general public, policymakers, and various educational institutes.
Moreover, the NCES department also compares data from previous years to provide accurate studies. Furthermore, the statistics provided by them are used to improve the schooling years and also the education facility for students from all years. Their reports are publicly available. Thus, to conclude National Center for Education Statistics, has such departments in every country will make a real difference.
FAQ.
National Center for Education Statistics (NCES) is the main source for collecting, analyzing, and providing data related to educational insights
The literacy rate in the United States of America as of 2023 is 79%.
As of 2022 in the Spring semester around 17.9 million students in the United States of America were enrolled in postsecondary institutions.
In the case of online learning, students are not required to go to any physical locations for test sessions. On the other hand, distance learning provides online education, but students are required to go to physical locations for testing purposes.

Barry is a lover of everything technology. Figuring out how the software works and creating content to shed more light on the value it offers users is his favorite pastime. When not evaluating apps or programs, he's busy trying out new healthy recipes, doing yoga, meditating, or taking nature walks with his little one.