
How Tech Giants Utilize Gantt Charts for Strategic Planning
Page Contents
Gantt charts, pioneered by management consultant Henry Gantt in the early 20th century, have become an invaluable tool in the arsenal of today's tech giants.
These visual representations of a project's timeline, tasks, and phases allow companies like Google, Amazon, and Microsoft to streamline their strategic planning, manage complex projects, and optimize their workflow.
What is a Gantt Chart?
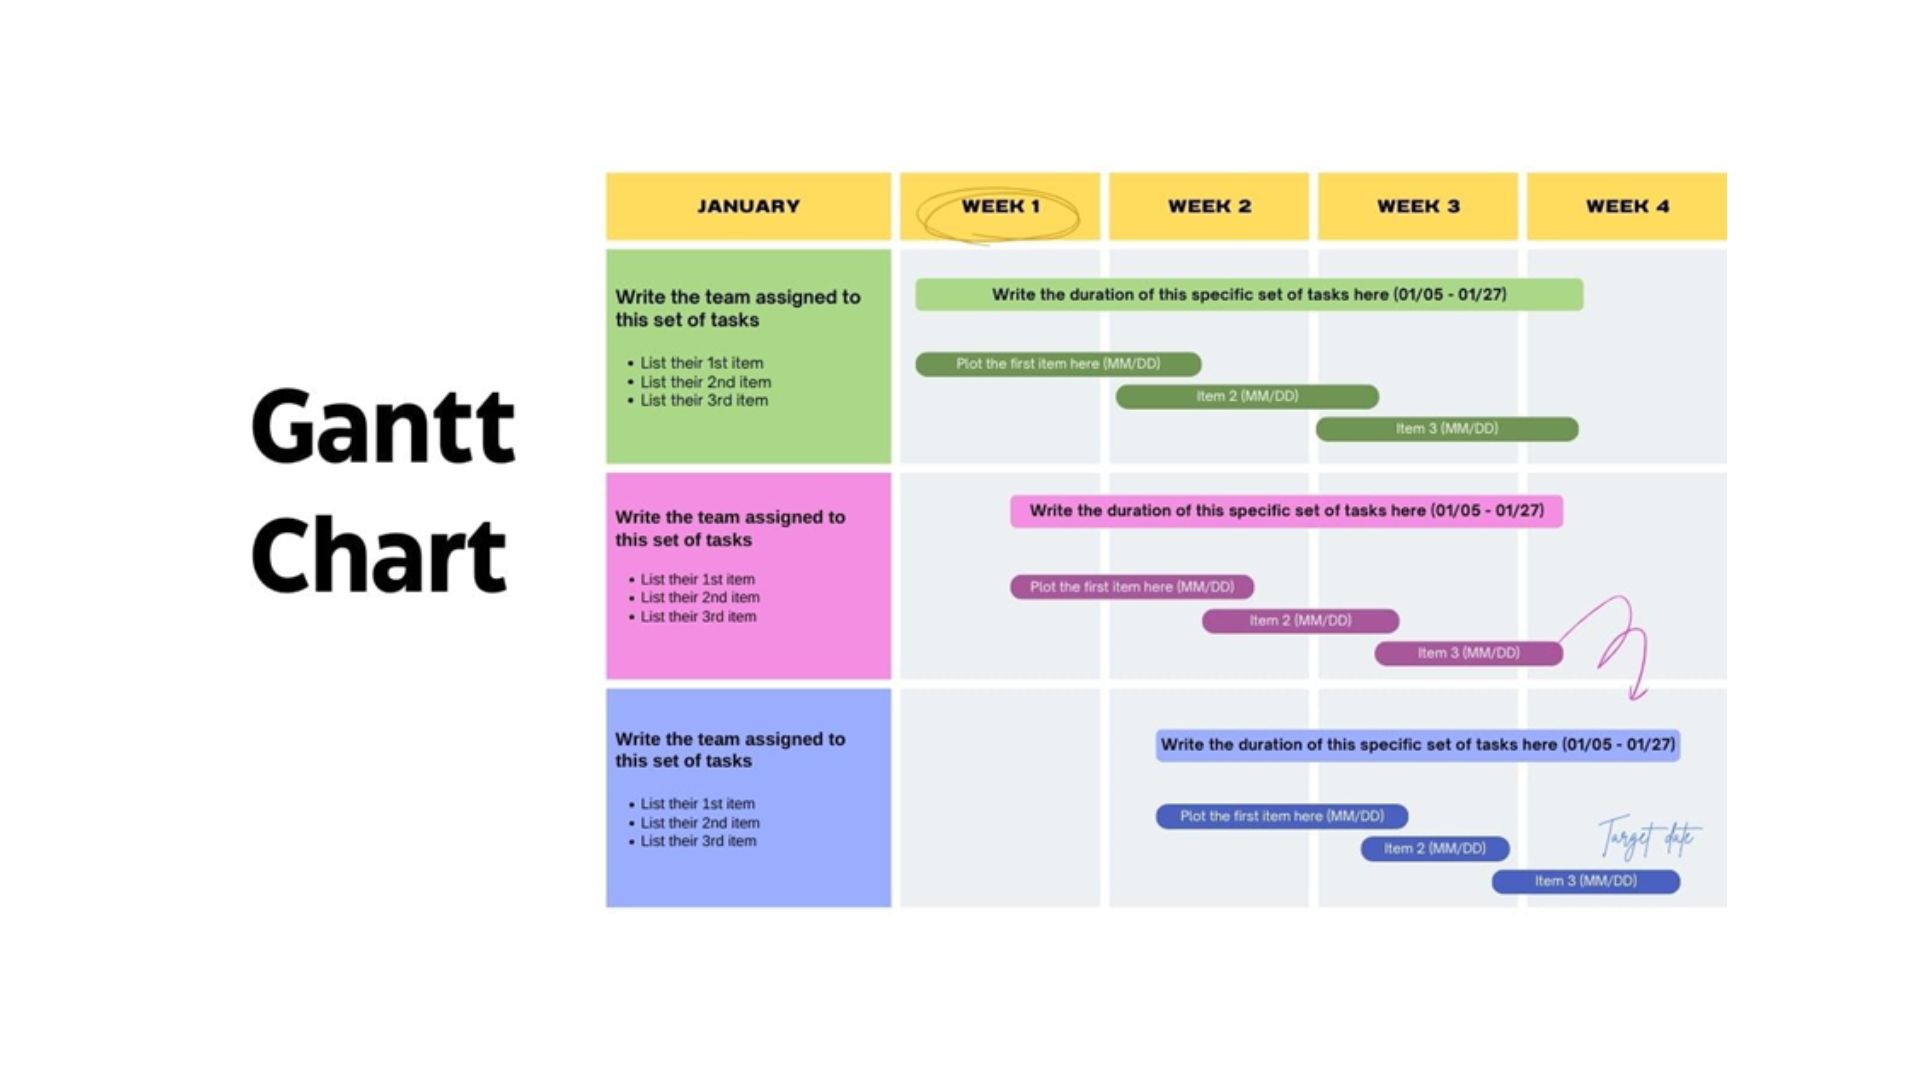
A Gantt chart is a bar chart that illustrates a project schedule, with each task represented as a horizontal bar. The length of the bar represents the duration of the task, and its position on the chart shows when it starts and ends.
This visual representation allows for easy tracking of progress, identification of dependencies between tasks, and allocation of resources. With modern software, it can also include additional information such as task assignees, milestones, and progress indicators.
The History of Gantt Charts in Tech
While the history of Gantt charts dates back to the early 1900s, it wasn't until the 1980s that computers and project management software made it possible for tech companies to fully utilize their benefits.
Before this, a Gantt chart was primarily used in construction, manufacturing, and other traditional industries. However, with the rise of technology and the need for efficient project management, tech companies quickly adopted Gantt charts as a key tool in their strategic planning processes.
How Gantt Charts are Utilized by Tech Companies Today
Today, Gantt charts are integral to the strategic planning and project management processes of tech companies. They serve as a visual tool for business intelligence, aiding in data analysis and informed decision-making.
By strategically plotting tasks on a timeline, tech giants can effectively identify dependencies, allocate resources with precision, and proactively manage potential risks. This meticulous approach allows for efficient resource utilization and seamless risk mitigation.
The visual nature of Gantt charts makes them an effective tool for communicating project timelines and task relationships to stakeholders, fostering transparency and collaboration. As a result, tech companies can maintain a consistent pace of progress, meet deadlines, and achieve their strategic objectives.
The Benefits Behind Using Gantt Charts in the Tech Industry
The benefits of using Gantt charts in the tech industry are plentiful. From facilitating effective project management to fostering collaboration and communication, here are some key advantages:
Efficient Resource Allocation
By visually representing tasks and their assigned resources, tech companies can ensure that resources are optimally allocated for maximum efficiency. This also helps avoid over or under-allocating resources, leading to cost savings and improved productivity.
Clear Task Dependencies
Gantt charts allow tech companies to easily identify task dependencies and potential bottlenecks. This enables proactive planning for contingencies and mitigating potential risks before they occur.
Transparency and Collaboration

With the ability to share Gantt charts with stakeholders, tech companies can foster transparency and collaboration. By providing a visual representation of project timelines, tasks, and progress, stakeholders can stay informed and provide feedback for improved decision-making.
Improved Project Management
Gantt charts serve as a powerful tool for project managers in the tech industry. With the ability to track task progress, deadlines, and resource allocation in real time, project managers can effectively monitor and manage projects for on-time delivery.
Facilitates Communication
Gantt charts serve as a common language for communication among team members, stakeholders, and project managers. This helps minimize confusion and misunderstandings, leading to improved communication and ultimately, successful project execution.
Challenges and Limitations of Gantt Charts in Tech
While Gantt charts are widely used in the tech industry, they do have their challenges and limitations.
Reliance on Manual Data Input
One major challenge is the reliance on manual data input, which can be time-consuming and prone to human error.
This is especially true for larger projects with numerous tasks and milestones. Additionally, changes to project timelines or task dependencies require constant updates to the Gantt chart, making it difficult to maintain accuracy and consistency.
Gantt Charts Do Not Account for Unexpected Changes
Another limitation is that it do not account for unexpected disruptions or changes in project scope, which are common in the dynamic world of technology. As a result, tech companies may need to supplement their Gantt charts with other project management tools and techniques to effectively address these challenges.
Final Words
Gantt charts are an essential tool for project managers in the tech industry, providing a visual representation of project timelines and progress.
However, they do have their limitations and should be supplemented with other tools and techniques to ensure successful project execution.
With continued advancements in project management software, It may also evolve to better address these challenges and provide even more value for tech companies.

Public relations, digital marketing, journalism, copywriting. I have done it all so I am able to communicate any information in a professional manner. Recent work includes creating compelling digital content, and applying SEO strategies to increase website performance. I am a skilled copy editor who can manage budgets and people.