
Smart Home Statistics By Region, Cost Saving, Devices, Brands, Demographics and Reasons for Adoption
Page Contents
- Introduction
- Editor’s Choice
- What is a Smart Home?
- Top 5 must-have Smart home Gadgets in 2023
- General Smart Home Statistics
- Smart Home Statistics By 10-Year Analysis
- Smart Home Statistics By Cost Saving
- Smart Home Statistics By Region
- Smart Home Statistics By Devices
- Smart Home Statistics By Brands
- Smart Home Statistics By Demographics
- Smart Home Statistics By Reasons for Adoption
- Which Devices Provide the utmost Safety?
- Conclusion
Introduction
Smart Home Statistics: ‘’Alexa read my emails’’ or ‘’Alexa call mom’’ aren’t these daily used sentences in your smart home? The world is going hands-free with technology. This global smart home market has already reached billions and making our lives convenient day by day. There are thousands of various smart devices available today which can be easily purchased online. Not just this, but they are easy to install.
These Smart Home Statistics are written with interesting segments along with recent insights. So, you may ask your laptop to read out this page for you while you take sips from your cup of coffee!
Editor’s Choice
- 78% of people planning to purchase a house are willing to pay extra for a smart home.
- In the United States of America, on average there are around 8 smart devices in a household.
- 2 out of 3 Americans are worried about the leak of personal data due to smart gadgets.
- On average, revenue gained from every installed Smart home is projected at $381.90.
- The American Smart Home market revenue is expected to grow at a CAGR of 10.63% between 2022 to 2027 by reaching $64.24 billion by 2027.
- 57% of the people aged 55 years and above said they don’t see any need to install smart gadgets in their homes.
- Asia Pacific is expected to become the largest market for Smart Homes in 2023.
- As of 2023, as per Smart Home Statistics, the expected revenue is $139.30 billion with 18.5% of the change in revenue.
- by 2025, global smart device shipments will be contributed by smart lighting systems (26%), security cameras (23%), smart speakers (19%), smart TV (14%), and other smart devices (18%).
- In the United States of America, the total number of smart homes is expected to increase by reaching 140 million by 2027.
What is a Smart Home?
Smart Home is a collection of home automation devices or smart gadgets or smart devices that perform the duties of humans or work on the commands given by their owners. These devices can be connected to the internet or WIFI at home. When these types of devices are connected to the Internet, they become part of the Internet of Things (IoT). Smart devices come in many types such as energy-efficient devices, smart wellness or fitness devices, Home comfort gadgets, smart connectivity gadgets, smart kitchen gadgets, and many more…
You May Like To Read: Top 10 Most Expensive Houses In The World
Top 5 must-have Smart home Gadgets in 2023
- Amazon Echo (4th Gen) (smart speaker category)
- Google Nest WIFI Router (Smart network extender)
- Robot Vacuum (Self-cleaning robot category)
- Smart Security Camera (Smart security devices category)
- Home WIFI Smart Lock (Smart security devices category)
General Smart Home Statistics
- In the United States of America, on average there are around 8 smart devices in a household.
- 2 out of 3 Americans are worried about the leak of personal data due to smart gadgets.
- 78% of people planning to purchase a house are willing to pay extra for a smart home.
- Asia Pacific is expected to become the largest market for Smart Homes in 2023.
- 79% of smart homeowners said smart gadgets at home have positively impacted their lives.
- Moreover, 79% of the customers have at least one concern for their smart home.
- The average cost to install a smart gadget at home is $789.
- The expected market share for smart gadgets such as video entertainment, home monitoring, lightning, and other types of devices will be 26%, 21%, 17%, and 36% respectively.
- As of 2023, Smart Home Statistics state that there are more than 60.4 million households in the United States of America using smart home devices.
- According to Smart Home Statistics, 46% of homeowners are looking forward to converting their homes to smart homes.
- Around the world, 11% of smart homes have 3 or more smart gadgets installed.
- Smart Home Statistics state that, it is a must to install at least 3 to 4 cameras from the front door to the lawn as well as in the backyard.
- 87% of millennials use smart devices at least once every day.
- According to Smart Home Statistics, as of the 3rd quarter of 2022, globally 874 million smart devices were shipped.
- As of 2022, in the United States of America, one of the most used features in smart devices is asking questions through voice-controlled devices.
- Consumer Spending on smart home devices and services is expected to reach more than 170 billion by 2025.
Smart Home Statistics By 10-Year Analysis
By Revenue
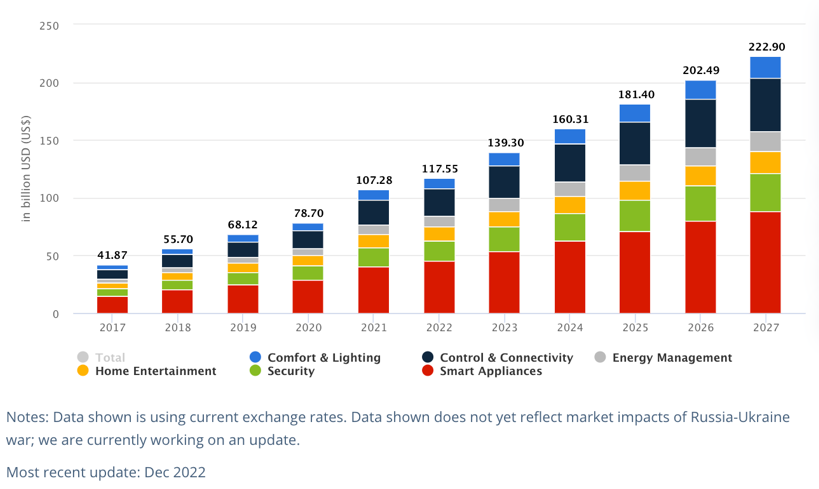
(Source: Statista.com)
By Smart Home Segment
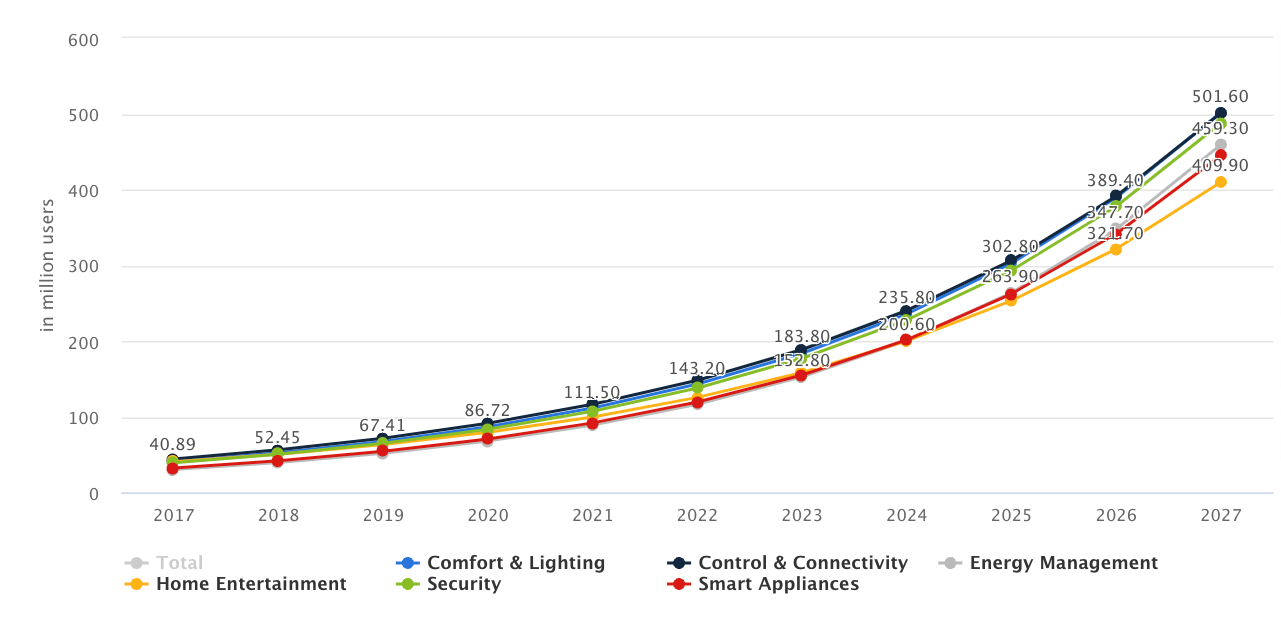
(Source: Statista.com)
By Average Revenue Per Smart Home By Segment
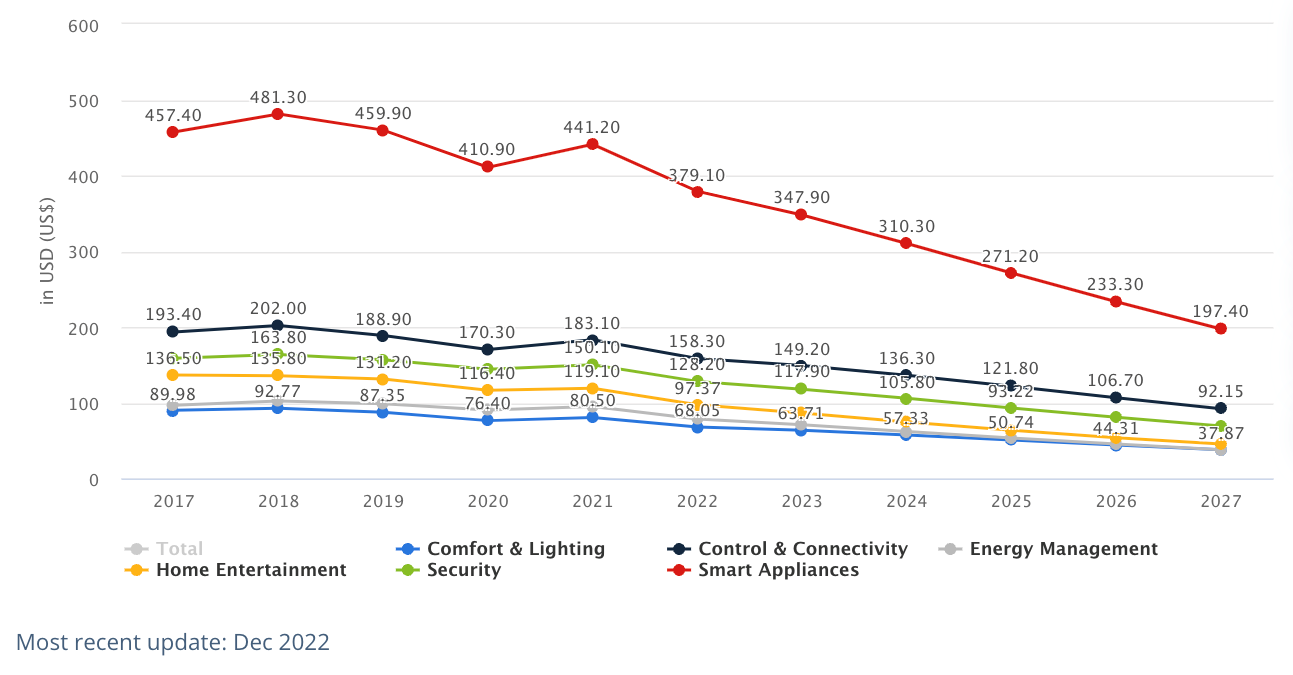
(Source: Statista.com)
By Household Penetration Rate By Segment
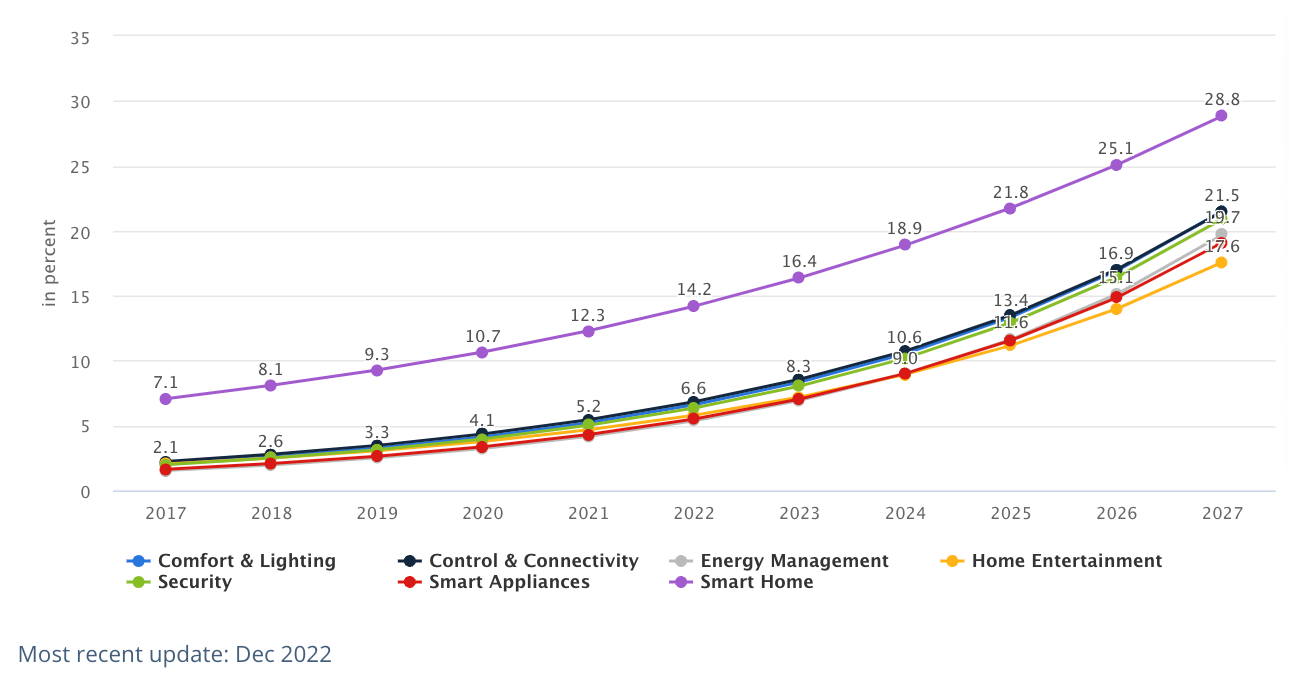
(Source: Statista.com)
Smart Home Statistics By Cost Saving
- By installing smart devices at home, it is possible to reduce 10% to 20% in home insurance premiums.
- Smart water heaters can help a household to save $4,500 over a period of 10 years.
- Energy-efficient smart fridges can save around $134 every year.
- Smart thermostats can save around 10 to 12% of the heating cost, as well as 15% of cooling costs every year.
- Smart thermostats customers using the device at 72 degrees F, usually save on average 23% every year.
Smart Home Statistics By Region
Worldwide
- As of 2022, it was expected that the revenue in the Smart Home market will reach $117.60 billion globally.
- Moreover, considering the global comparison, as of 2022, most of the revenue is gained from markets of the United States of America resulting in $31,450 million.
- As of 2023, as per Smart Home Statistics, the expected revenue is $139.30 billion with 18.5% of the change in revenue.
- By 2027, it has been expected that the total number of active households in the Smart Home Segment will be 672.60 million.
- Moreover, the expected penetration of households in 2022 was 14.2% which will rise to 28.8% by 2027.
- On average, revenue gained from every installed Smart home is projected at $381.90.
Asia
- In the Asian Smart home market, the revenue as of 2023 is expected at $55.19 billion, with a change in revenue of 19.7%.
- By 2027, the total number of households is projected to rise to 349.20 million.
- Moreover, the revenue in the Smart Home segment was projected to reach $46.12 billion, with an annual growth rate of CAGR 14.26% between 2022 to 2027 by reaching $94.07 billion of market volume in 2027.
- The expected household penetration in 2022 was 12.6% which is expected to reach 27.1% by 2027.
- Moreover, as of 2023, the projected revenue in the Asian Smart home segment is $55.19 billion with a change of 19.7%.
Americas
- Smart Home Statistics state that by 2027, the average revenue for every Smart home in the United States of America will be $483.10.
- Furthermore, the American Smart Home market revenue is expected to grow at a CAGR of 10.63% between 2022 to 2027 by reaching $64.24 billion by 2027.
- Moreover, household penetration is expected to reach 39% by 2027.
- In the United States of America, the total number of smart homes is expected to increase by reaching 140 million by 2027.
- As of 2023, the expected revenue is $42.89 billion with a change in revenue of 13.3%.
Africa
- As of 2023, the expected revenue in the Smart Home market in Africa is $1,812 million with a change in revenue of 16.6% compared to the previous year.
- The average revenue for every smart home in the African market is projected at $156.90.
- Moreover, the African Smart Home market is expected to grow at a CAGR of 11.30% between 2022 to 2027 reaching a $2,781 million projected market value in 2027.
- The total number of active smart homes by 2027 is projected at 22.61 million.
- Moreover, as of 2022, the revenue in the Smart Home market was projected at $1,554 million.
Europe
- The expected revenue in the European region as of 2023 is $35.51 billion with a change of 24.2%.
- Moreover, the total number of active smart homes by 2027 is expected at 150.50 million in Europe.
- The European Smart home market revenue is expected to grow at a CAGR of 12.15% between 2022 to 2027 reaching $56.18 billion in market volume by 2027.
- Similarly, by 2027, household penetration is projected to reach 40.9%.
- The average revenue for every installed smart home is $449.80.
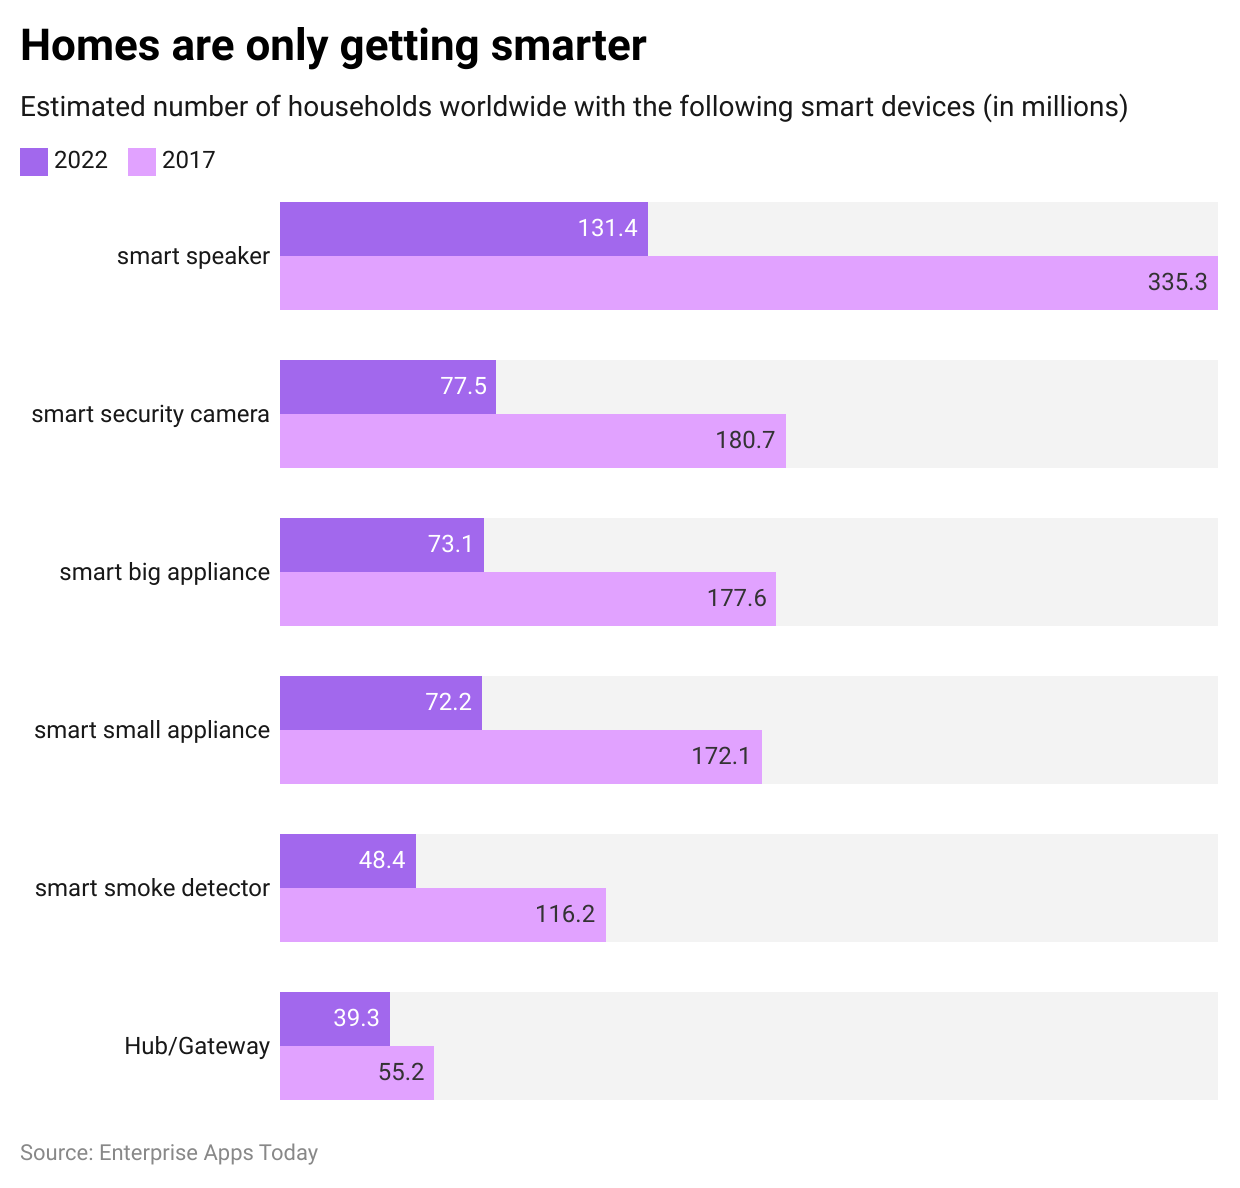
Smart Home Statistics By Devices
- According to Smart Home Statistics, 50% of households have voice control devices installed in their homes.
- Whereas 41% of the households have smart appliances, and 36% of the households are installed with 36% of smart lights.
- Moreover, 79% of households installed smart speakers.
- According to Smart Home Statistics, by 2025, global smart device shipments will be contributed by smart lighting systems (26%), security cameras (23%), smart speakers (19%), smart TV (14%), and other smart devices (18%).
- Moreover, 57% of households in America use smart TVs.
- Furthermore, as per the Smart Kitchen Statistics, 29% of households are using smart devices for cooking and other chores while 28% of the contribution is made by refrigerators, dishwashers, and dryers.
- 2% of Americans are using fitness and health-related smart devices such as smart home gyms, smart exercise bikes, and smart treadmills.
- There are 4.8% of Americans own interactive security hubs, 4.6% own smart air quality monitors, 7.2% have installed window sensors, 7.6% have smart smoke detectors and 8.2% of Americans own smart door locks.
- Moreover, 1.6% of the consumers in the United States of America have smart padlocks and smart mailboxes at their homes.
- As smart outdoor devices, 3.4% of Americans have smart sprinkler control systems and 2.6% have outdoor lighting systems.
- As of 2022, in the United States of America, Smart TV is the most owned smart home device.
(Source: Statista.com)
Smart Home Statistics By Brands
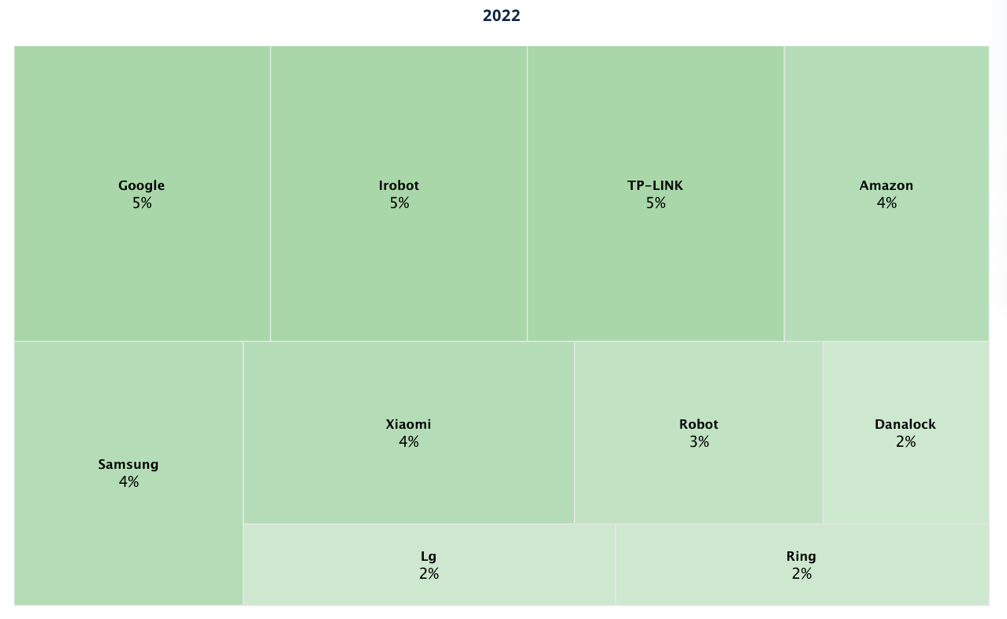
(Source: Statista.com)
- As of 2022, the global Smart Home Statistics state the highest market share captured by brands were Google (5%), iRobot (5%), and TP-LINK (5%) in terms of the smart device market.
- Additionally, other brands captured the global Smart Home market as Amazon (4%), Samsung (4%), Xiaomi (4%), Robot (3%), LG (2%), Ring (2%), and Danalock (2%).
- According to Smart Home Statistics of 2022, AT&T is the most owned smart home device brand across the United States of America.
Smart Home Statistics By Demographics
- 57% of the people aged 55 years and above said they don’t see any need to install smart gadgets in their homes.
- Men tend to use smart home devices more than women to reduce their utility bills compared to men 17% vs women 13%.
- 36% of the men as well as women aged between 35 to 54 years state that, security cameras provide most of the protection to their homes.
- Women are more likely to use security devices to increase the efficiency of the smart home.
- On the other hand, 14% of the women aged between 25 to 34 years prefer automatic locks to protect their homes.
- 47% of millennials in the United States of America have installed at least one smart device at their home.
- Smart speakers are owned by 21% of households with consumers aged between 18 to 49 years.
- Smart home devices are famous in 82% of men and 49% of women in the United States of America and they have at least one smart device at home.
- 90% of Gen X, 39% of Baby Boomers, and 33% of the silent generation in the United States of America own at least one smart device.
Smart Home Statistics By Reasons for Adoption
- 46% of consumers install smart gadgets at home for their convenience.
- Whereas 17% of the households do it because they want to monitor their house while being away.
- 16% of the people want to improve the security around the house while 15% of the people want to reduce utility bills.
- 57% of Americans said, using smart devices at home saves them time.
Which Devices Provide the utmost Safety?
- Smart Home Statistics shows that 34% of smart homeowners voted for fire/theft alarm systems.
- Whereas cameras have been voted at 31% and 16% votes were given to video doorbells.
- 8% of the smart homeowners said water shut-off valves and 7% of automatic locks provide the most security.
- And 4% of the people said water sensors are the most security providers.
Conclusion
Looking at these Smart Home Statistics, technology is leaping ahead securing all of us in one place. Even if we are away from our homes, we can monitor every single moment in our houses. Moreover, these voice-controlled devices run the houses like their owners. But are we secure? Even though cameras are watching our walls, fire alarms are keeping houses safe from burning, and voice-controlled devices are narrating news every morning, do we know who is behind these smart gadgets? Such devices can be easily accessed and your conversations at home are always at stake of the leak! Don’t you think too much modernization at home can cost you some of private and secure life?
Sources
FAQ.
Globally, some of the top brands for Smart Home gadgets are Amazon, Google, Apple, Siemens, LG, Schneider, Sony Group Corporation, Honeywell International Inc., and Samsung.
Increasing demand for low carbon emission and energy-saving oriented solutions, surveillance systems, and the need for smart security as well as convenience of smart gadgets are the driving factors for the smart home market.
Smart gadgets or smart devices can automatically or over voice control, react on video doorbells, speakers and voice assistants, smart lighting, climate control, energy monitoring, robot vacuums, and indoor as well as outdoor security cameras.
Globally, smart speakers are the most popular smart devices found in almost every household.

Barry is a lover of everything technology. Figuring out how the software works and creating content to shed more light on the value it offers users is his favorite pastime. When not evaluating apps or programs, he's busy trying out new healthy recipes, doing yoga, meditating, or taking nature walks with his little one.