
Trucking Industry Statistics 2024 – By Demographics, Income-Wise, Paid Taxes, Global Boundaries
Page Contents
- Introduction
- Editor’s Choice
- Facts About The Trucking Industry
- Know More About the Trucking Industry?
- Importance Of The Trucking Industry
- General Trucking Industry Statistics
- By Income
- By Taxes
- By Challenges
- By Region
- By Owner Operator
- By Shortage Reasons
- By Type Of Goods Transported
- By Demographics
- By Ethnicity
- By Age
- By Global Boundaries
- By Costs
- By Industry
- Trucking Industry 2024 Forecast
- Facts About The Trucking Industry
- Recent Development in The Trucking Industry
- Conclusion
Introduction
Trucking Industry Statistics: Delving into the realm of trucking industry statistics unveils a dynamic landscape marked by significant figures and trends. In the United States alone, the trucking industry serves as a cornerstone of transportation, with over 10.77 million registered trucks traversing the nation's highways and byways. This vast fleet plays a pivotal role in the economy, hauling goods worth an estimated $791 billion annually.
Globally, the trucking industry is equally impactful, with the market size reaching USD 3.7 trillion. Moreover, the sector employs millions of individuals, with approximately 9.2 million people working in trucking-related occupations across the United States. Such figures underscore the indispensability of the trucking industry and highlight its crucial role in facilitating commerce and supply chain logistics on both domestic and international scales.
Editor’s Choice
- The expected growth of the trucking industry market by 2026 is 9.2%, reaching USD 1,212.59 billion.
- As of 2022, the global freight trucking market was valued at USD 853.45 billion.
- The top three busiest truck border ports: are Laredo, TX (USD 20 billion), Detroit, MI (USD 10.7 billion), and Port Huron, MI (USD 6.9 billion).
- Over 200,000 female truck drivers contribute to the industry.
- Small-scale business truckers travel an average of 115,000 km to 125,000 km annually.
- Truckers spend approximately 240 nights away from home each year.
- In the United States, 90% of food is transported by refrigerated trucks.
- 72.5% of freight in the United States is moved by weight.
- Implementing technology could save approximately $168 billion annually in transport and logistics.
- The trucking industry represented 80.7% of the U.S.'s freight cost in 2022, totaling USD 940.8 billion.
- Trucking employment saw an increase of 405,000 from the previous year, with 8.4 million people employed in trucking-related jobs in 2022.
- There are 3.54 million professional truck drivers as of 2022.
- Most trucking carriers are small companies, with 95.8% operating ten or fewer trucks.
- In 2021, there were approximately 168.6 million registered trucks in the United States.
- The federal tax on diesel fuel was about USD 0.24 per gallon as of July 2023.
- The General Freight Trucking (Truckload) industry generated USD 91.4 billion in revenue in 2022, up 9.8% from 2021.
- The Less-Than-Truckload (LTL) industry reached USD 229 billion in 2022, growing at an average of 4.8% annually from 2017 to 2022.
- Driver wages accounted for 32% of all trucking-related costs in 2022.
- Fuel costs represented 28% of all trucking-related expenses in 2022.
- Lack of available truck parking ranked as the second-highest concern for truckers in 2023.
- Total freight tonnage is projected to increase by 28% from 2021 to 2032.
- Insurance premiums for trucking companies rose from USD 0.071 to USD 0.088 per mile between 2019 and 2022.
- There were 475,371 for-hire truck carriers as of July 2023.
- Trucks move approximately 72.5% of America's freight by weight.
- The trucking industry earned USD 875.5 billion in revenue in 2021.
- There are about 3.5 million employed truck drivers in the U.S. as of 2021.
- There are 1,102,799 for-hire trucking carriers in the U.S.
- U.S. trucks moved 10.93 billion tons of freight in 2021.
- 4.06 million semi-trucks are operating in the U.S. as of 2021.
You May Also Like To Read
- Car Rental Statistics
- Food Truck Statistics
- Airlines Statistics
- Ridesharing Industry Statistics
- Electric Vehicle Statistics
- LYFT Statistics
- Aviation Statistics
Facts About The Trucking Industry
- The trucking industry is projected to grow by 9.2% by 2026, reaching USD 1,212.59 billion.
- As of 2022, the global freight trucking market was valued at USD 853.45 billion.
- Female truck drivers contribute to the industry, with over 200,000 employed.
- Truckers travel an average of 115,000 km to 125,000 km annually.
- Approximately 240 nights are spent away from home by truckers each year.
- In the United States, 90% of food is transported by refrigerated trucks.
- 72.5% of freight in the United States is moved by weight.
- Implementing technology could save approximately USD 168 billion annually in transport and logistics.
- There are 3.54 million professional truck drivers as of 2022.
- Most trucking carriers are small companies, with 95.8% operating ten or fewer trucks.
- In 2021, there were approximately 168.6 million registered trucks in the United States.
- The federal tax on diesel fuel was about USD 0.24 per gallon as of July 2023.
- The General Freight Trucking (Truckload) industry generated USD 91.4 billion in revenue in 2022, up 9.8% from 2021.
- The Less-Than-Truckload (LTL) industry reached USD 229 billion in 2022, growing at an average of 4.8% annually from 2017 to 2022.
- Driver wages accounted for 32% of all trucking-related costs in 2022.
- Fuel costs represented 28% of all trucking-related expenses in 2022.
- Lack of available truck parking ranked as the second-highest concern for truckers in 2023.
- Insurance premiums for trucking companies rose from USD 0.071 to USD 0.088 per mile between 2019 and 2022.
- There were 475,371 for-hire truck carriers as of July 2023.
- Trucks move approximately 72.5% of America's freight by weight.
Know More About the Trucking Industry?
The trucking industry is included in the global transportation sector specializing in moving goods from roads and highways. The trucking movement transports various types of goods such as raw materials, processed food, vegetables, cold storage food, medical supplies, finished goods, and many other things. Driving trucks require a commercial driver’s license (CDL). The United States of America has the major manufacturing, transportation, and warehousing industries.
Importance Of The Trucking Industry
- Offers the opportunity to explore and connect with new markets.
- Possible exchange in international currencies.
- Provides delivery of essential goods such as grocery, milk products, bakery products, medical supplies, etc…
- Employs workers and provides a regular income source.
- Improves infrastructure.
General Trucking Industry Statistics
- Trucks are more likely to take halts during transportation than cars resulting in 40%.
- In the United States of America, 90% of eaten food is transported by refrigerated trucks.
- On average, the trucking industry statistics say that the total consumption of gasoline is 50 billion gallons every year resulting in 13% of the overall country’s total fuel consumption.
- On average a small-scale business trucker travels 1,15,000 km to 1,25,000 km every year.
- Truckers are mostly away from home for 240 nights out of 365 days.
- There are a large number of small-scale trucking businesses in the United States of America.
- Around 3.49 million truck drivers were employed in the year 2021.
- As of today, insurance premiums for trucking companies have been increased from $12,000 to $14,000.
- As of 2021, the total market size of the truckload industry is more than USD 80 billion.
- 4% are commercial trucks.
- Around 9% of truck drivers work part-time while 91% work full-time.
- If truck companies stop transporting goods, then within just three days grocery stores, medical supplies, and ATM cash would dry up.
- In the United States of America, 72.5% of the freight is moved by weight.
- On average, the trucking industry is responsible for moving 70% of the nation’s goods.
- By the year 2028, it is projected that the truck driver industry may face a shortage of 1,60,000 drivers.
- Around 54% of the new hiring for drivers is needed for retired drivers.
- 33% of the crash deaths occurred due to large trucks on interstates and freeways.
- By the year 2025, the global self-driving truck market is expected to reach USD 1,699.
- The autonomous truck industry will grow at a CAGR of 18.6% by the year 2025.
- The truckload market is more than USD 212 billion as of today.
- The overall revenue generated from the trucking industry is above USD 700 billion.
- There are around 29 billion truckers who travel empty or partially loaded.
- By involving technology around USD 168 billion can be saved on transport and logistics every year.
- Around 24.3% of greenhouse gas emissions are released by the transport industry in the EU.
- As of 2022, the global freight trucking market was USD 853.45 billion.
- By the year 2026, the expected trucking industry market growth is 9.2% reaching USD 1,212.59 billion.
- UPS is the most valued brand in logistics around the world.
- As of 2021, in North America, the freight transported was valued at USD 73.9 billion whereas it was USD 85.5 billion in the year 2022.
- The top three busiest truck border ports are Laredo, TX (USD 20 billion). Detroit, MI (USD 10.7 billion), Port Huron, MI (USD 6.9 billion).
By Income
- The average salary of every trucker of a light and delivery service truck is around USD 41,960.
- The trucker of heavy and tractor-trailer drivers earns around USD 46,370 annually.
- Trucking industry statistics say that those employed in the trucking industry earn more than most of the average Americans.
- The full-time trucker earns $100 more than any other American full-time employee.
- The average wage for truck drivers in the United States of America is USD 22.66.
By Taxes
- As of January 2022, on average for every gallon of diesel cents 32.7 of state fuel tax has been paid.
- In a similar duration, Trucking industry statistics say that cent 31 of state fuel tax has been paid for every gallon of gasoline.
- Similarly, cents 24.4 and cent 18.4 have been paid for every gallon of diesel and gasoline respectively.
By Challenges
(Source: TruckingResearch)
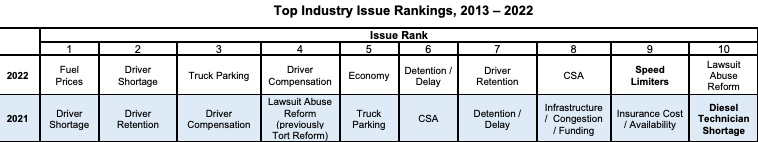
- As of 2021, the top industry issues ranked are as follows: 1. Driver Shortage 2. Driver Retention 3. Driver Compensation 4. Lawsuit Abuse Reform 5. Truck Parking 6. CSA 7. Detention/Delay 8. Infrastructure 9. Insurance cost and 10. Diesel Technician shortage.
- As of 2022, trucking industry statistics say the following ranked issues as 1. Fuel prices 2. Driver Shortage 3. Truck Parking 4. Driver Compensation 5. Economy 6. Detention/Delay 7. Driver retention 8. CSA 9. Speed limiters and 10 Lawsuit abuse reform.
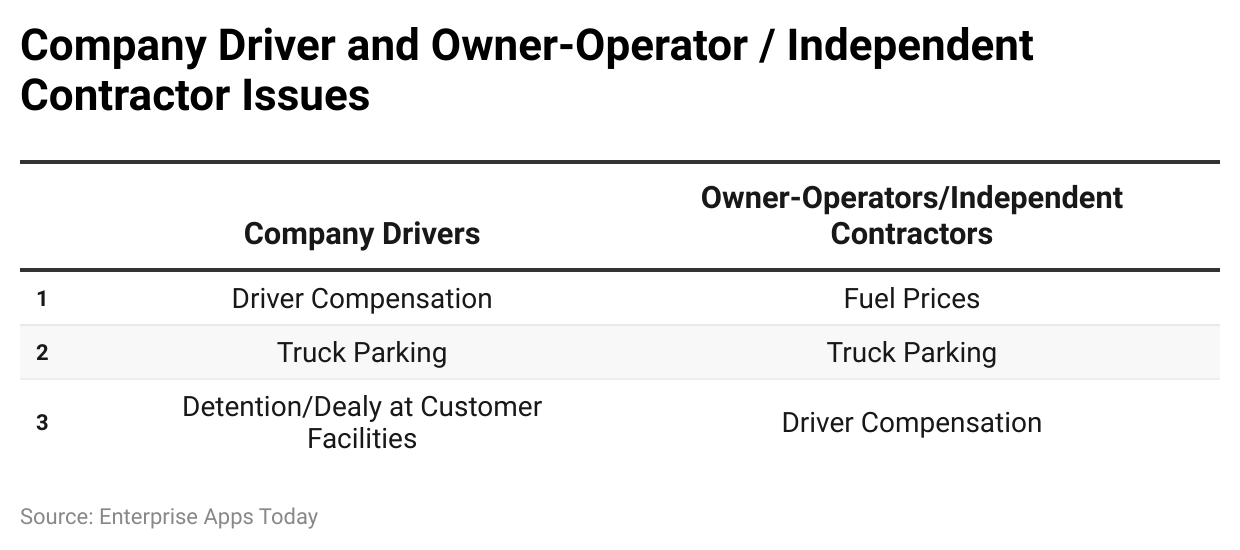
Truck parking is a common problem faced by both owner-operators and company drivers.
The top issue for company drivers, however, is driver compensation. Owner-operators are responsible for fuel prices.
The delay at customer facilities is another common reason that company drivers mention, while owners and operators point out driver compensation issues to be the most serious problem.
These are just a few of the other problems faced by companies as well as drivers:
- Fuel price 27.5%
- Driver shortage 21.4%
- Truck Parking 25.1%
- Driver compensation 19.2%
- Economy instability 18.6%
- Relay at customer facility 15.6%
- Driver retention 14.2%
- Compliance, safety, and accountability 12.5%
- Speed limiters 12.8%
- Lawsuit Abuse reform 10.9%
By Region
(Source: IRU)
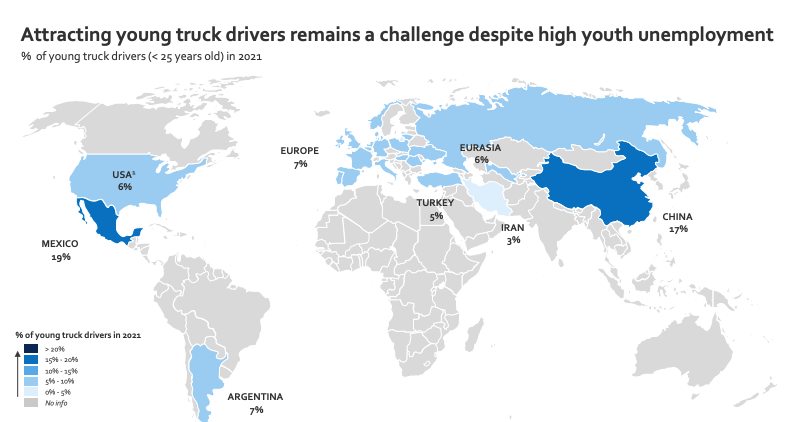
- According to Trucking Industry Statistics, there are around 19% of truck drivers are below 25 years of age, similarly, 17% are in China.
- Young drivers below 25 years are 7% in Europe and Argentina, 6% in the USA and Eurasia, 5% in Turkey, and 3% in Iran.
By Owner Operator
- As of today, Trucking industry statistics say that there are around 4,00,000 owner-operators in the industry.
- The average median net income of owner-operators is USD 50,000.
- Over 60% of the owner-operators are away from their home for more than 151 nights every year.
- 34% of the owner-operators have served in the military.
- On average, an owner-operator could be driving for more than 20 years.
- The majority of the individuals became owner-operators at the age of 36 years.
- The average age of the owner-operator is 46 years.
By Shortage Reasons
(Reference: IRU)
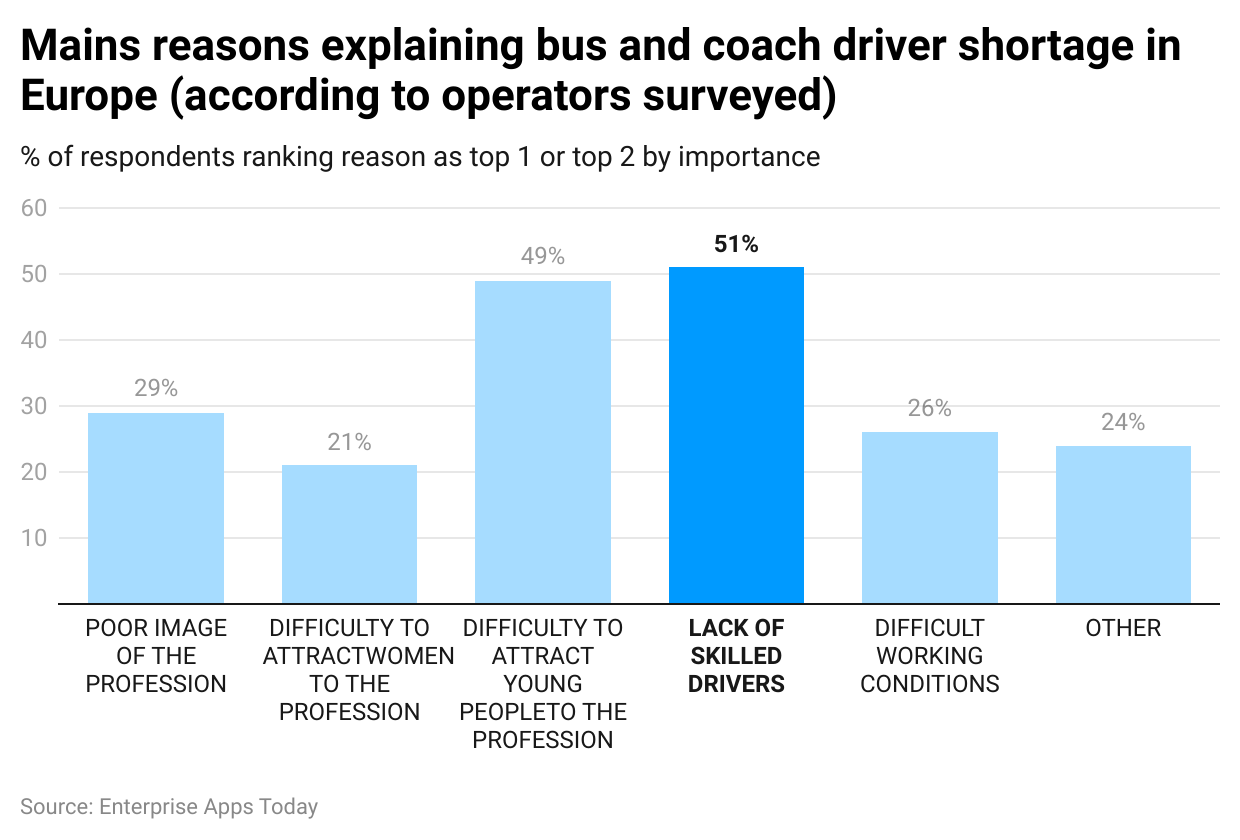
- As of 2021, the major reasons for the shortage in the trucking industry state that, there were 59% of the respondents said there was a lack of skilled drivers.
- 29% of the people stated trucking industry gives a poor image of the profession.
- On the other hand, 21% and 49% of the people said there was difficulty in attracting women and you people into the profession.
- 26% of the people supported the reason as there were difficult working conditions.
- 24% of the people gave various reasons for the shortage in the trucking industry.
By Type Of Goods Transported
- The top transported goods in the United States of America are clothing, food, furniture, machinery goods, and electrical goods.
- The trucking industry statistics say that the industry generates billions of revenue every year which is almost similar to America’s 5% GDP.
By Demographics
(Source: Zippia)
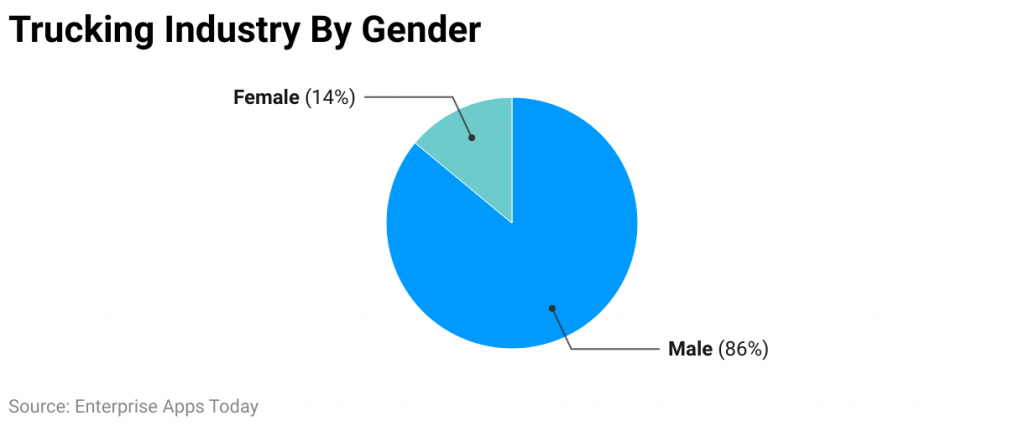
- There are more than 2,00,000 female truck drivers.
- According to the trucking industry, statistics 86% of drivers are male and 14% are female drivers.
By Ethnicity
(Source: Zippia)
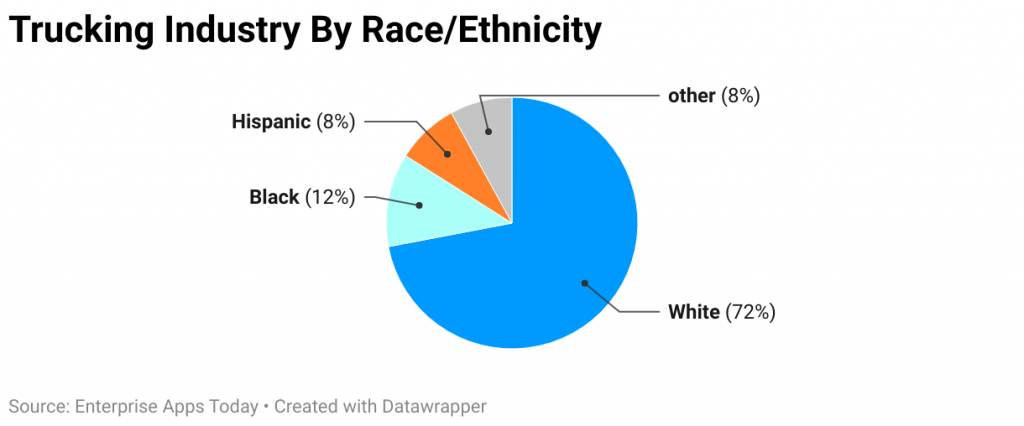
- Considering the ethnic backgrounds, 72% of the truckers are white people being the highest.
- There are 12% of the population from the black ethnic background.
- 8% respectively belong to Hispanic and other ethnic backgrounds.
By Age
| Age Range | Percentage |
|---|---|
| 16-24 | 8% |
| 25-34 | 17% |
| 35-44 | 21% |
| 45-54 | 26% |
| 55-64 | 21% |
| 65+ | 7% |
(Reference: Zippia)
- According to Trucking industry statistics, there are 8% of truck drivers aged between 16 years to 24 years.
- 17% of them belong to the age group of 25 years to 34 years.
- There are 21% and 26% truck drivers from the age group of 35 years to 44 years and 45 years to 54 years respectively.
- Whereas 21% of the truckers are from the age group of 55 years to 64 years and 7% are 65 years and above.
![]() (Source: IRU)
(Source: IRU)
- As of 2021, considering the transport industry in Europe, there are 46% of female employees while 22% of them are transport employees.
- 12% of the females are bus and coach drivers.
These 10 countries have the highest-paid general cargo truck drivers (U.S. dollars).
| Rank | countries | payments per annum |
|---|---|---|
| 1 | Switzerland | $70,452 |
| 2 | Australia | $53,951 |
| 3 | Belgium | $50,462 |
| 4 | Norway | $47,572 |
| 5 | United States | $43,130 |
| 6 | Germany | $46,871 |
| 7 | Netherlands | $46,865 |
| 8 | Austria | $46,217 |
| 9 | Canada | $43,445 |
| 10 | Sweden | $42,751 |
(Reference: FreightWaves)
- As of 2022, Switzerland ranks on top for paying general cargo truck drivers an annual pay of USD 70,542.
- Australia pays around USD 53,951 while Belgium ranks in third place for paying around USD 50,462 every year.
- Other countries ranked in the list of top 10 countries with highest paid general cargo truck drivers per annum are Norway (USD 47,572), the United States of America (USD 47,130), Germany (USD 46,865), Netherlands (USD 46,865), Austria (USD 46,217), Canada (USD 43,445) and Sweden (USD 42,751).
By Global Boundaries
- As of 2021, the trucking industry statistics stated that around 66.1% of the surface trade between the United States of America and Canada took place.
- Similarly, between USA and Mexico around 82.7% of the surface trade took place.
- As of 2021, the United States of America transported 10.93 billion tons of freight by trucks.
By Costs
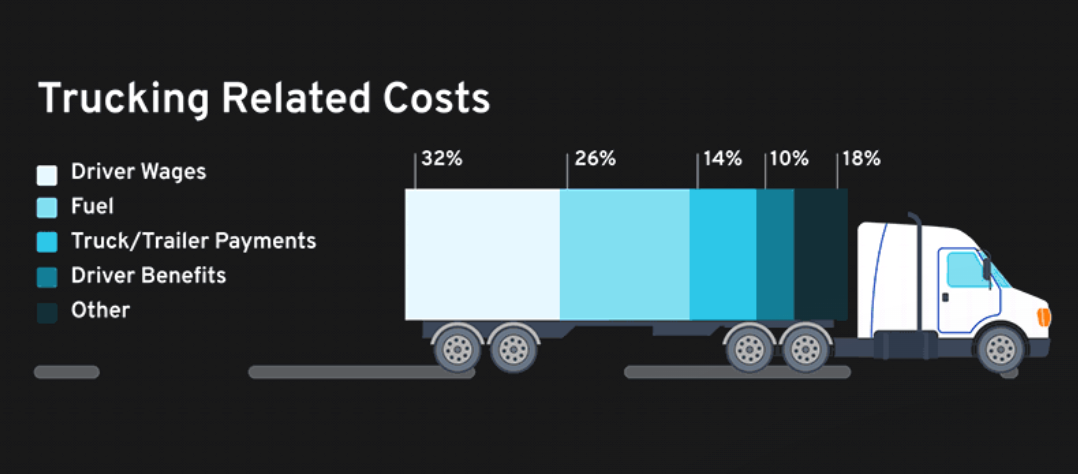
- Driver wages amount to 32% of every trucking cost along with driver benefits.
- The average cost of loss due to a fleet vehicle accident is USD 70,000.
(Reference: Cloudtrucks)
- As stated by Trucking industry statistics, the highest cost acquired belongs to driver wages resulting in 32%.
- Other costs are followed by fuel (26%), and truck and trailer payment (14%).
- 10% of the costs are allotted to driver benefits whereas 18% goes to various miscellaneous costs.
By Industry
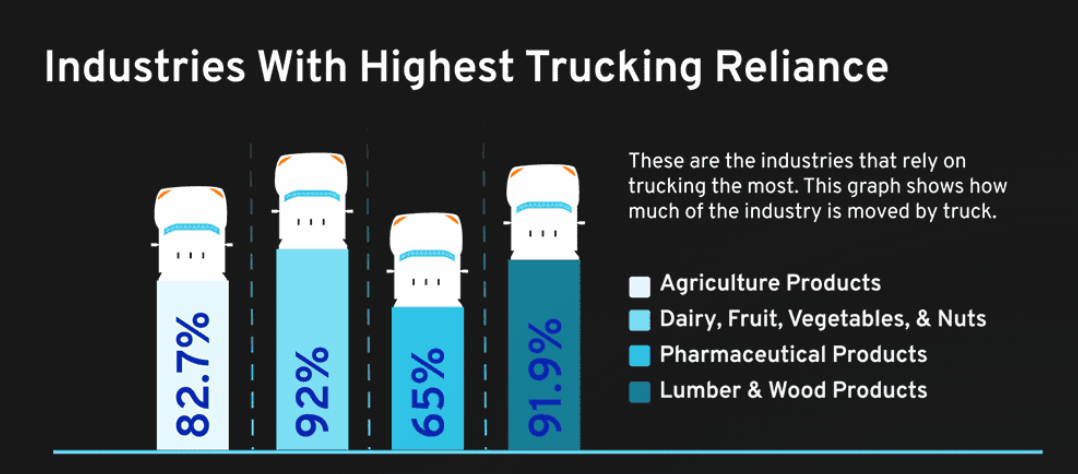
(Reference: Cloudtrucks)
- The agriculture industry is the third largest industry in the world which depends on transportation resulting in 82.7%.
- Similarly, trucking industry statistics say that the dairy, fruit nut, and vegetable industry is the largest industry around the globe to depend on trucking activity by 92%.
- Other ranks are followed by pharmaceutical products and lumber and wood products resulting in 65% and 91.9%.
Trucking Industry 2024 Forecast
The industry of trucking is going through a major change due to advancements in sustainability, logistics, as well as the improvement of the safety of the driver and vehicle. On the next trend map from StartUs, we can observe the major trends that will affect the industry by 2024.
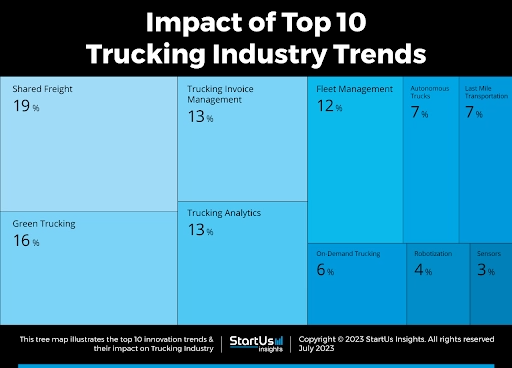
(Source: cloudtrucks.com)
In the coming years, we will be looking forward to trends in 2024 In 2024, the U.S. trucking industry will likely continue to struggle with challenges like the high cost of gas as well as high insurance costs, the availability of equipment and drivers as well as changing labor laws. We do expect a greater focus on sustainability, technology, and adapting to evolving consumer needs and the rise of independent truck drivers.
Facts About The Trucking Industry
- Continued growth in the global trucking industry market, is projected at 9.2% by 2026.
- Increasing adoption of technology to optimize logistics and reduce costs.
- The rising demand for female truck drivers reflects efforts to diversify the workforce.
- Shift towards greener practices, including electric and hybrid trucks, to address environmental concerns.
- Growing emphasis on driver safety and well-being, leading to investments in driver training programs and improved working conditions.
- Expansion of last-mile delivery services to meet the growing demands of e-commerce.
- Integration of automation and artificial intelligence in trucking operations to enhance efficiency and productivity.
- Rising concerns about truck parking availability, prompting initiatives to address parking shortages and improve facilities.
- Adoption of predictive analytics and data-driven solutions for better route planning and fleet management.
- Increasing focus on supply chain resilience and flexibility in response to disruptions such as the COVID-19 pandemic.
Recent Development in The Trucking Industry
- Adoption of blockchain technology to enhance supply chain transparency and security.
- Implementation of electronic logging devices (ELDs) to ensure compliance with hours-of-service regulations.
- Integration of telematics systems for real-time monitoring of vehicle performance and driver behavior.
- Introduction of autonomous trucking technologies for long-haul transportation.
- Expansion of intermodal transportation solutions to optimize freight movement across different modes of transport.
- Collaboration between trucking companies and technology providers to develop innovative solutions for freight management and tracking.
- Investment in sustainable fuel alternatives such as hydrogen and biofuels to reduce carbon emissions.
- Launch of new trucking apps and platforms to streamline booking processes and improve communication between shippers and carriers.
- Development of electric and hydrogen-powered trucks to address environmental concerns and reduce dependence on fossil fuels.
- Implementation of predictive maintenance techniques to minimize downtime and improve fleet efficiency.
Conclusion
In conclusion, the trucking industry continues to play a vital role in the global economy, with significant growth and challenges shaping its landscape. With a projected market growth of 9.2% by 2026, reaching 7 it's evident that the industry is poised for expansion.
The global freight trucking market reached USD 853.45 billion in 2022, underscoring its immense size and importance. However, challenges such as driver shortages, rising fuel costs, and regulatory complexities persist. Despite this, the industry remains resilient, with innovations like blockchain technology, electronic logging devices, and autonomous trucking paving the way for efficiency and sustainability. As the demand for freight transportation continues to rise, the trucking industry must adapt to meet evolving needs while embracing innovation to drive future growth.
Sources
FAQ.
UPS Inc, FedEx Corp, XPO Logistics, J.B. Hunt Transport Services Inc, and Knight-Swift Transport services are the top 5 trucking industries.
Owner-operator is the highest-paying job in trucking with an annual salary of $2,47,850.
The following types of trucks are used on regular road freight: Box Trucks, Semi-trailer trucks, Jumbo trailer trucks, liftgate trucks, refrigerated trucks, and much more…
The turnover rate for truck drivers is 90%.

Barry is a lover of everything technology. Figuring out how the software works and creating content to shed more light on the value it offers users is his favorite pastime. When not evaluating apps or programs, he's busy trying out new healthy recipes, doing yoga, meditating, or taking nature walks with his little one.