
Lyft Statistics – Usage, Revenue, Market Share, Driver Information
Page Contents
- Introduction
- Lyft Statistics 2023 (Editor's Choice)
- General Lyft Statistics
- Lyft Statistics by Reasons to Use Platform
- Lyft Statistics by Total Daily Commuters by Lyft
- Key Lyft Statistics
- Lyft Usage Statistics
- Lyft Driver Information and User Statistics
- Statistics showing the Revenue and Market share of LYFT
- Uber vs. Lyft Statistics
- Conclusion
Introduction
Lyft Statistics: In the past short-distance transportation was restricted to taking public transport or having a car. Lyft statistics in San Francisco today will show you that this San Francisco-based transport company makes it so much easier.
Ridesharing has become a very crucial part of the economic situation of a country. This is especially true in urban areas. Consumers want to ignore the hassles and costs associated with owning a vehicle, while also avoiding the inconveniences of public transportation. Lyft, one of today's most famous platforms, is among them. Lyft started out as a short-heave service by Zimride. Today, it is a giant company in sharing rides with travelers, millions in numbers from the USA.
This article will address critical Lyft statistics. We'll discuss the demographics of Lyft riders and drivers as well as the company's financial status. Also, we will discuss the impact of the pandemic on its operations. This allows you to get all the information necessary to learn more about the company.
It's as easy as it gets: simply grab your phone, order a lift, and then start the ride.
Lyft is a transportation network company that was founded in 2012. In this article, we'll look at some of Lyft’s interesting stats, including market share, revenue, rides, and other statistics.
Lyft Statistics 2023 (Editor's Choice)
- Lyft was used by nearly 30% of users to get healthcare services in 2019.
- Lyft rides are more common in low-income areas than in high-income ones.
- Lyft drivers make an average of $34,400 each year
- Lyft reported 18.73 million active riders in its last quarter of 2021.
- The third quarter of 2021 saw a 13% revenue rise.
- Lyft is worth approximately $14.93Billion
- Lyft's total assets amounted to $4.82B in the third quarter, of 2021.
- Uber has 2 million more drivers than Lyft.
General Lyft Statistics
- 90% of Lyft’s drivers are students along with app-based work.
- In addition to driving jobs on Lyft, 19% of them are business owners.
- 4% of drivers drive between 9 am to 5 pm on weekdays.
- 14% work after the traditional working hours.
- In 2022, 45% of the driver drove to more than 1 metro area followed by 24% (2 metro areas), 10% (3 metro areas), 5% (4 metro areas), 4% (5 metro areas), and 2% (6 or more metro areas).
- According to Lyft Statistics, 94% of drivers drive less than 20 hours per week.
- At some points, the average time for drivers to come online is 1:23 minutes.
- Lyft driver are more likely to stop driving with app-based platforms if they lose their independence resulting in 65%.
- In 2022, around 91 million bike riders used the Lyft-operated bikeshare system.
- As of 2022, more than 1 million riders used Lyft to find a rideshare driver during natural disasters.
- During driving jobs, drivers are 46% more likely to explore their city.
- 43% of rides in the United States of America either start or end in low-income areas.
- The median household income for Lyft riders in the United States of America is $55K.
Lyft Statistics by Reasons to Use Platform
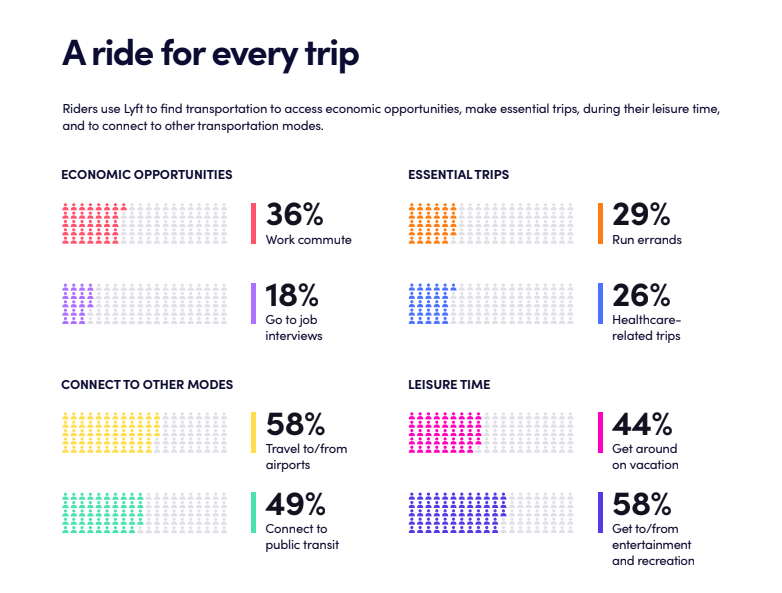 (Source: Lyft Economic Impact Report 2023)
The majority of them have used Lyft to go to airports or get to or from entertainment and recreation, resulting in 58%, followed by to connect with public transportation (49%) and on vacation (44%)
Lyft Statistics by Total Daily Commuters by Lyft
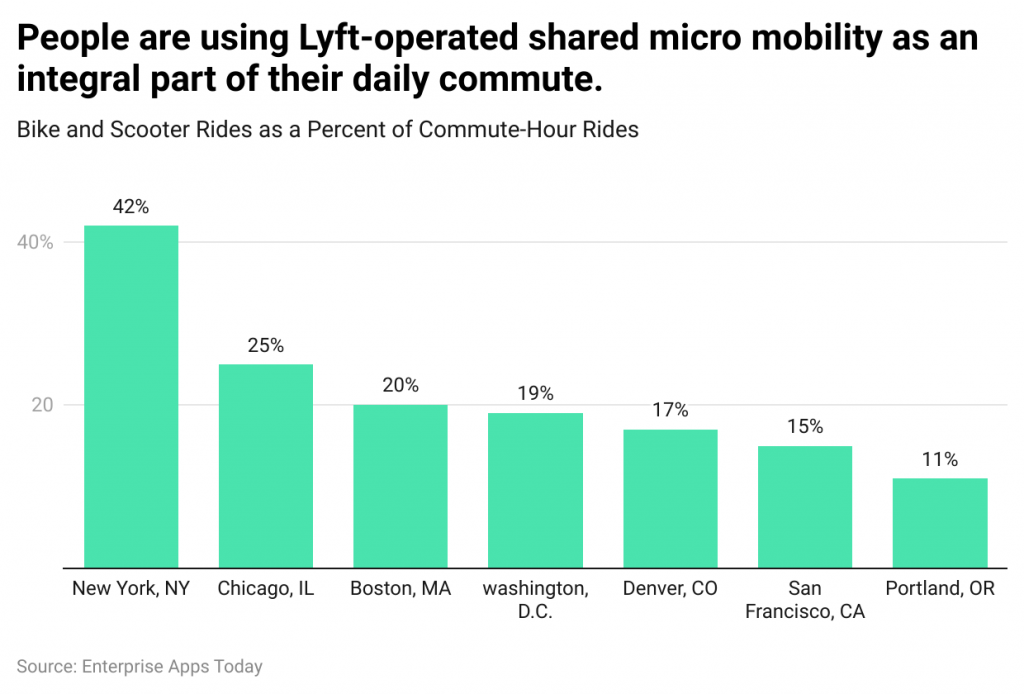 (Source: Lyft Economic Impact Report 2023)
New York City has the most consumers using Lyft-operated shared micro-mobility as part of their daily commute.
Key Lyft Statistics
Lyft is one of the pioneers who set the ridesharing industry on its feet. It also has helped increase the popularity of rental car software. Lyft's reach is limited to North America. However, it is still the largest platform that offers this service. Lyft is second only after Uber in terms of the number of users. The service has extensive coverage, with the majority of its customers located in Phoenix and Detroit, Michigan. Lyft also offers ridesharing via automobiles, with a selection of scooter fleets in select US towns.
- Lyft ranks second in volume among ride-hailing platforms in the US. (Digital Trends, 2021)
- Lyft's presence is in 644 U.S. Cities and 12 Canadian Cities as of the writing. (Lyft, 2021)
- Lyft's monthly app downloads for iOS and Android have reached 2112,768 as of 2021. This makes Lyft a large contributor to the number of mobile app downloads. (Crunchbase, 2021)
- Lyft's app was downloaded more than 24 million times during the pandemic. (Crunchbase, 2021)
- Lyft holds a 32% share of the US ridesharing industry. (Bloomberg Second Measure, 2021).
- Lyft, with a market share of 45% in Phoenix and Detroit is the most popular ride-sharing service. (Bloomberg Second Measure, 2021).
- Lyft pulled its scooter fleets from six US cities last year, primarily because of a lack of riders. (Bloomberg Second Measure, 2021).
Lyft Usage Statistics
Lyft offers services in 644 U.S. cities as well as 12 Canadian cities.
(Analytics Vidhya)
Lyft today is a huge company that operates in almost 650 US cities as well as 12 Canadian. Lyft, although it is not as large as Uber, is an extremely fast-growing and highly-rated company.
Lyft is now operating in a total of ten countries. Unfortunately, it doesn't have any operations outside of the US or Canada.
Lyft saw over 4.5 million app downloads during the first quarter.
(Sensor Tower)
In fact, there were 4.7 million app installs in the quarter. But, it was still less than the 5,000,000 installs for the same quarter last year.
The Lyft app has been specifically created to allow quick and simple access to Lyft rides.
Lyft statistics for 2019 show that 29% used Lyft to get healthcare services.
(Beckers Hospital Review).
Lyft’s 2019 economic impact report showed that the company had partnered up with ten non-emergency transport companies and nine healthcare systems to offer rides to patients.
Lyft rides have a 90% success rate of 5-star reviews from passengers.
(The Ad Focus).
A good impression is key to any business. Lyft is a pioneer in this idea and has provided excellent services to its customers. Lyft received five-star reviews from nine out of ten customers.
Lyft Driver Information and User Statistics
Lyft rides end or start in low-income communities.
(The Philadelphia Inquirer. Lyft).
Lyft rides more often originate in Philadelphia's low-income areas than anywhere else in the United States.
In fact, this percentage is 60% higher than those in its top US markets (New York City), Atlanta, Washington Chicago, Boston, Los Angeles, and San Francisco) as well as the 40% national percentage.
Lyft currently has 2 million drivers in the US & Canada.
(CNET)
Lyft places a high priority on providing customers with fast and efficient services. Lyft has more than 2 million drivers who help to reduce wait times.
Lyft drivers earn an average of $34,442 per year, according to stats from Lyft demographics.
(Student Debt relief)
Sites that collect salary information are prone to do so based on the data of employees. Glassdoor.com looked at 106 salaries in order to determine that Lyft drivers were making almost $34,500 a year.
Lyft had 18.73m active riders in the quarter to 2021.
(WSJ, CNBC, GoodWaterCap)
In fact, the number of active riders has increased from 12.5 million in 2020. However, 22.9 Million active riders were recorded at the conclusion of 2019
Lyft has created a trustworthy brand that values and stands out in a market where prices are high. Lyft's target market is made up of young and socially conscious individuals.
Lyft offers its drivers' insurance worth up to 1 million dollars
(Lyft)
Lyft drivers can now purchase insurance at a new level.
Lyft Insurance protects them for up to $1,000,000
Lyft also offers coverage for accidents contingent comprehensive and collision up to the actual car cash value, as well as uninsured/underinsured motorist bodily injury.
It was 73% higher than in the quarter part of the year prior. Lyft's revenue in the 3rd quarter was $ 499.7 million. Additionally, the company's revenue for the first three months of 2021 was $765 million.
Lyft revenue shot up by 13% in quarter three of 2021 over the same period last year.
(Reuters)
Nevertheless, some of the costs and expenses increased by only 4% in the second half of 2021. Lyft’s annual report shows that Lyft’s Margin Contribution (the profitability of the company with no costs that are not fixed) increased by fifty-nine points four percent.
Lyft has a net worth of $14.93B as of the year 2022
(Macro Trends)
Irrespective of the losses this company which is sharing the rides continues to grow in value and profitability. One can expect this trend to be the same in the next years. Lyft had a net worth of $ 21.71 billion in March 2019, the highest ever.
Lyft's third-quarter loss of 2021 net was seventy-one point five million dollars
(Investor)
Nevertheless, this was quite less than in the comparable period in 2020. Lyft statistics for 2020 depict that it was four hundred fifty-nine point million dollars during the 3rd quarter. In addition, the net loss was $221.9 million in 2021's second quarter.
For the 3rd quarter in 2013, net loss also took into consideration stock-based compensatory and also related to the expenses of tax on petrol of more than $200 million.
Lyft had an unprecedented fourth quarter in 2021 with record-breaking income for any driver that is active
(ZDNet)
To be more specific, revenue earned by any active driver reached fifty-one point seven nine dollars. This is an increase of 14% year on year.
In addition, 18.7 million active riders were registered in the quarter. Lyft rider numbers were higher than in the prior quarter with 18.9million riders that are active.
Lyft's third-quarter 2021 assets totaled $4.82B.
(Macro Trends)
This represents a fall of two point nine percent year-over-year. The 2020 assets in total stood at $ 4.67 billion, a seventeen-point eight percent decline from the $5.7B mark in 2019.
Lyft was 31% in the US's Lyft market as of July 2021.
(Statista)
Lyft today is popular with many Americans. Lyft claims that it accounts for a market share of the country which is around 30^. This is slightly more than the 29% figure at the end of 2019
By the close of 2023, Lyft's share of the users of transport that sharing transport will be 59%.
(eMarketer)
As per some estimates, Lyft will be able to claim a greater market share over time. Although Lyft is among the first to introduce ride-sharing technology, it's lagging behind Uber.
Uber vs. Lyft Statistics
Uber's third-quarter 2021 revenue was 5.5x higher than Lyft's.
(Investor)
Uber's third-quarter revenue was $4.8 million, while Lyft's was only $864.4 million. Lyft's revenue increased 73% over the previous year, but it still fell short of Uber's.
Comparing Uber and Lyft's market shares, we see that Uber had a 4x higher global market share in 2019 than Lyft.
(Statista)
Uber had a 37.2% global market share in 2015, making it the largest ride-hailing company.
Lyft's global share of the market was 9.26% in comparison. In fact, it was the third-leading ride-hailing company. DiDi was second with a 32.4% market share.
Uber employs approximately 1.9 million drivers more than Lyft.
(CNET)
Uber, for instance, has 3.9 million drivers across 63 countries. It also offers greater coverage than Lyft. Lyft is only available in the United States or Canada. How many Lyft drivers do they have? Lyft has approximately two million drivers but none are located outside North America.
A survey on Uber-only and Lyft-only drivers' satisfaction with their jobs revealed that Lyft drivers were happier (52 %).).
(CNET)
In 2019, Lyft-only drivers surveyed more than 50% who were happy with their experience. However, 48% of Uber-only drivers were satisfied with their driving experience.
Lyft had a higher percentage of satisfied drivers than Uber.
Conclusion
Lyft was founded in 2012 and has been around ever since. It is evident that Lyft is growing rapidly based on its history.
Lyft is the fastest-growing company in the world, based on the facts and stats above. Lyft is the United States' second-largest transportation network provider.
Because of the innovative technologies and innovations, the company employs to make each ride exceptional, taking a lift with one of its vehicles could prove to be the most efficient and fastest way to transport yourself.
Sources
FAQ.
Overall, Uber is more popular that Lyft. In fact, Uber is more popular than Lyft. This was confirmed by a driver for both companies in an interview.
He claims that Uber is preferred by more people than Lift. People ask for Lyft rides for every 3-4 Uber rides. He cites several reasons Uber is more popular than Lyft.
Lyft reported that 18.73 million people were active users in 2021. This was an increase over the 12.5 million reported in 2020. It was a decrease of 45% from the number in 2020, which was around 22 million.
Lyft's decline in popularity was due in part to the COVID-19 epidemic. This caused a decrease of ride-hailing operators as more people stayed at home.
Lyft has been providing services to citizens in the United States and Canada for many years. Although there is no data to prove it, case studies and research have helped to estimate how many Lyft riders ride each day. This number is approximately one million.
Lyft's partnership with prominent organizations has allowed these rides to have a huge impact on the local community. Lyft provides free rides for communities that are low-income, helping them get food, jobs, and other services.
Lyft operates in many cities so it's not surprising that there are millions of riders. There were 18.73 million active riders in the third quarter last year.
This also indicated an increase in 6.23 million users compared to 2020 when 12.5 million active users were available.
Lyft statistics confirm that 2019 numbers are significantly higher. Lyft statistics show that there were 22.9 millions active riders back then

Barry is a lover of everything technology. Figuring out how the software works and creating content to shed more light on the value it offers users is his favorite pastime. When not evaluating apps or programs, he's busy trying out new healthy recipes, doing yoga, meditating, or taking nature walks with his little one.