
Aviation Statistics 2024 By Market Size, Valuation, Pilot Demographics, Best Airports, Leading Airlines by Brand Value, Best Airlines and Best Airports
Page Contents
- Introduction
- Editor’s Choice
- You May Also Like To Read
- General Aviation Statistics
- Mishandled Reports in the USA
- By Market Size/Valuation
- By Pilot Demographics
- By Type of Airport Delay
- By Best Airports
- By Projected Airline Fleet Growth Between 2023 to 2042
- By Airport Availability
- By Leading Airlines by Brand Value
- By Global Airline Ranking
- By Best Airlines
- By Aircraft Orders in 2022
- By Causes of Delay By Reporting Operating Carrier
- By Projected Aircraft Deliveries by Type
- By Aircraft Shipments
- Worldwide Active Military Aircraft Fleet in 2024
- By Busiest Air Routine in the World vs in the US in 2023
- Conclusion
Introduction
Aviation Statistics: Aviation is the art and science of flying. It not only includes aeroplanes but also helicopters as well. Today, the industry is known into 3 types commercial, general, and military. In all of its types, the aviation market is providing services by traveling across the country or protecting the country.
These Aviation Statistics have shown how important this industry has become to support the worldwide economy. Transportation, military support, space exploration, and connecting the countries are some of the vital duties performed by the aviation sector today. Moreover, with continuously developed technology, the aviation industry is expected to benefit the most among others.
Editor’s Choice
- As of 2023, Aviation Statistics reported the industry to be male-driven as there were 88.8% aerospace engineers in the USA while females contributed by 11.2%.
- In the USA, in 2022, the airline's average number of daily passengers was 2,512,411 while the yearly number of passengers was 917,029,842.
- As of today, there are more than 5,000 aerospace engineers employed in the industry.
- By the NAS System delay, flights from or arriving at their destination 15 minutes late are counted as delayed.
- In the USA, in 2023, American Airlines became the best airline by 7.97/10, followed by United Airlines (7.88/10) and Delta Air Lines (7.88/10).
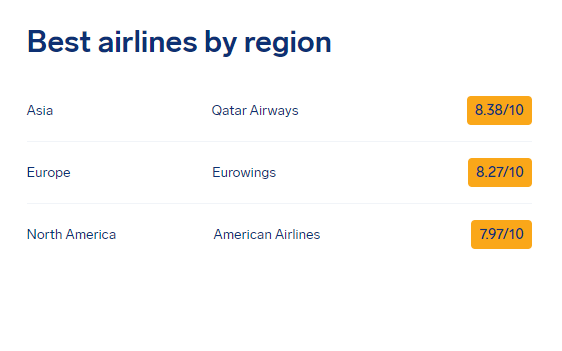
- Region-wise best airlines in 2023 were Qatar Airways, Aisa (8.38/10), Eurowings, Europe (8.27/10), and American Airlines, North America (7.97/10).
- In FY 2022, holding by center occurred 24,813 meaning, deliberate aircraft delay because of flying into repeating rotational patterns
- As of 2022, the total core 30 airport operations were 11,758,471, showing a 23.2% change compared to 2021.
- Aviation Statistics by the FAA Air Traffic Organization state that in 2022, Atlanta (AL), Memphis (MEM), Chicago (ORD), Dallas-Fort Worth (DFW), and Denver recorded the highest average daily capacity (ADC) resulting in more than 3,000 operations every day.
- In NAS (National Aerospace System) 2022, during peak hours 1500 GMT to 2200 GMT, 5,300 flights were en route every minute.
You May Also Like To Read
- Airlines Statistics
- Most Expensive Airlines
- Ridesharing Industry Statistics
- Electric Vehicle Statistics
- LYFT Statistics
- Tesla Statistics
- Trucking Industry Statistics
- Car Rental Statistics
- Food Truck Statistics
General Aviation Statistics
- In the USA, in 2022, the airline's average number of daily passengers was 2,512,411 while the yearly number of passengers was 917,029,842.
- According to the Aviation Statistics 2022, the average hourly capacity across all main / core 30 airports in the USA was 3,676.
- In NAS (National Aerospace System) 2022, during peak hours 1500 GMT to 2200 GMT, 5,300 flights were en route every minute.
- In FY2022, around 41.4 million center operations were held.
- As of 2022, the total core 30 airport operations were 11,758,471, showing a 23.2% change compared to 2021.
- Furthermore, Aviation Statistics by the FAA Air Traffic Organization state that in 2022, Atlanta (AL), Memphis (MEM), Chicago (ORD), Dallas-Fort Worth (DFW), and Denver recorded the highest average daily capacity (ADC) resulting in more than 3,000 operations every day.
- In 2022, 175 airspace flow programs were imported by air traffic managers.
- Furthermore in FY2022, holding by center occurred 24,813 meaning, deliberate aircraft delay because of flying into repeating rotational patterns
- Aviation Statistics according to a report by the FAA Air Traffic organization stated that, in FY2022, run occurrence occurred 299 times at Core 30 Airports, meaning, the wrong position of any person, vehicle, or aircraft on the protected area where the aircraft will be landing or taking off.
- As of today, there are more than 5,000 aerospace engineers employed in the industry.
- According to Aviation Statistics, the manufacturing industry is considered to be the highest-paying job for aerospace engineers.
- The total profit expected for the global Airline Industry is $25.7 billion.
- In 2023, global air traffic grew by 90% as compared to pre-pandemic levels in China.
- Furthermore, air traffic by revenue passenger Kilometers (RPKs) grew by 46% in April 2023, while with a YoY increase of 40% industry-wide passenger loads factors touched 81%.
- By 2036 the projected growth is stable then it will create 15.5 million direct jobs in the aviation industry, generating $1.5 trillion of GDP and adding to the world economy.
- By 2030, more than 200,000 flights are projected to land and take off all over the world.
- In August 2023, US airlines enplaned 83.1 million passengers including international and domestic as measured by the Bureau of Transportation Statistics (BTS).
- By 2024, it was projected that 57% of airports around the world will be implementing self-boarding gates with the help of biometrics and ID documentation.
- By 2027, the size of the commercial aircraft engine market is projected to be valued at $79.9 billion.
- Furthermore, by 2050, around 450 billion liters of sustainable aviation fuel production is required to achieve Net Zero Target in the aviation industry.
- By 2042, 42,595 new aircraft will be delivered to customers around the world.
Mishandled Reports in the USA
- In 2023, Southwest Airlines' enplaned highest number resulting in 11,400,425, out of which 44,783 were mishandled. The rate of mishandled bags per 100 enplaned is 0.39%.
- Furthermore, 20,074 wheelchairs and scooters were enplaned of which 291 were reported to be mishandled.
By Market Size/Valuation
- According to Aviation Statistics, the number of flights flown by the worldwide airline industry was expected to amount to 34.4 million.
- By 2038, the global market of aircraft maintenance and engineering services is expected to be valued at $2.4 billion.
- Furthermore, the revenue of the same is expected to reach $83.5 billion.
- The projected market size of global MRO by 2033 (Maintenance and Repair and Overhaul) is expected to reach $125.3 billion.
By Compound Annual Growth in North America
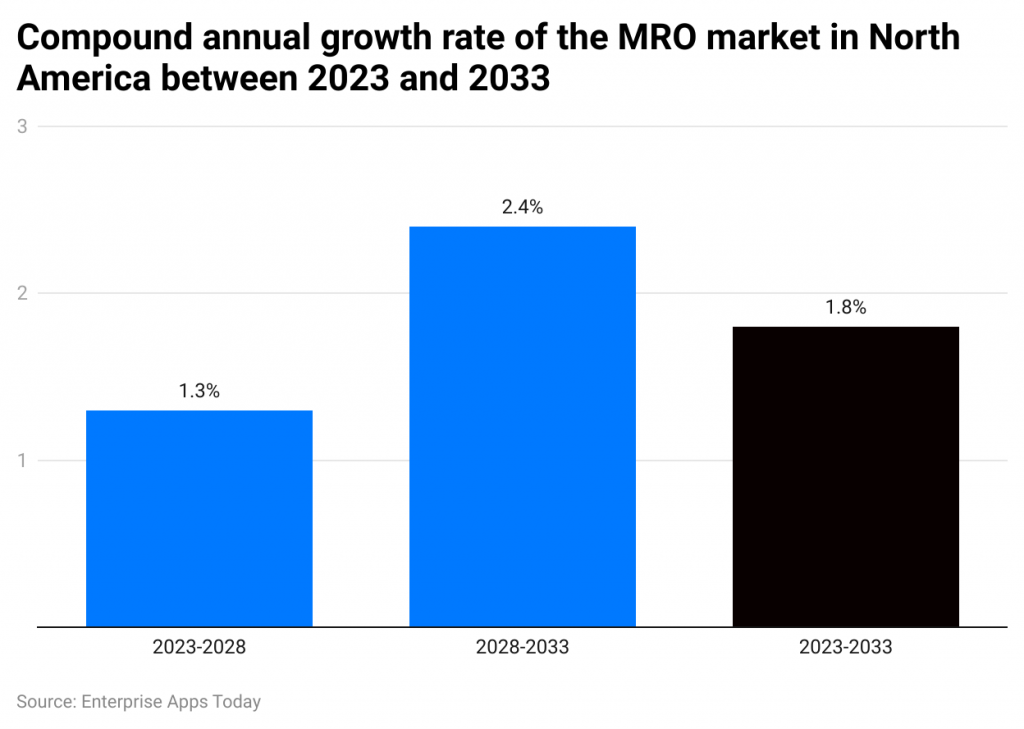
(Reference: statista.com)
The 10-year analysis of the maintenance, repair, and overhaul market in North America shows that by 2028, it is expected to grow at a CAGR of 1.3%. Furthermore, between 2028 to 2033 it will grow at 2.4%. The average of these 10 years contributes 1.8% of CAGR growth.
By Pilot Demographics
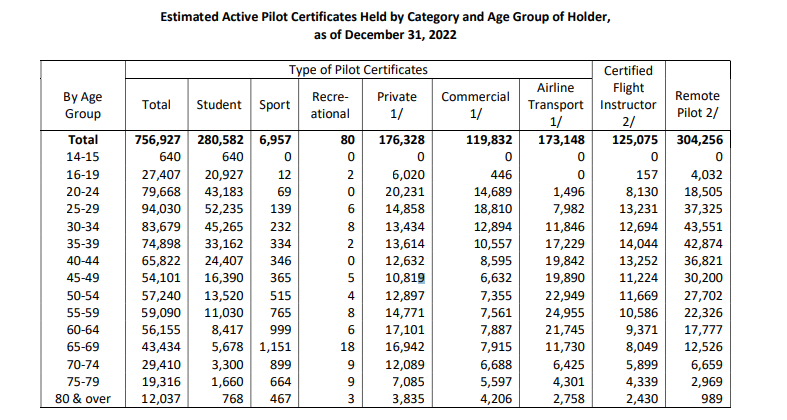
(Source: faa.gov)
According to a report by the Federal Aviation Administration 2023, the total number of pilots in 2022 was 7,56,927 out of which the following categories as the type of pilot certificates Student (280,582), Sport (6,957), Recreational (80), Private- 1(176,328), Commercial-1 (119,832), Airline Transport-1 (173,148), Certified Flight Instructor 2 (125,075), and Remote Pilot 2 (304,256) excluding flight instructors and remote pilots. Aviation Statistics show that certified pilots belong to every age group from 14 years to 80 and beyond.
By Aerospace Engineers Gender
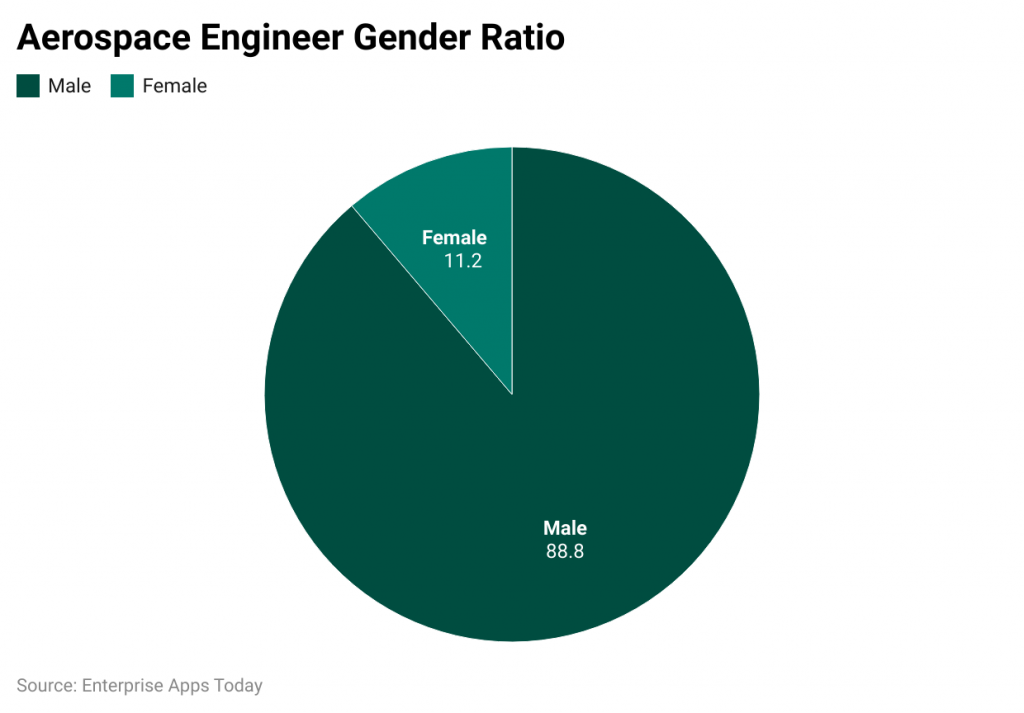
(Reference: zippia.com)
As of 2023, Aviation Statistics reported the industry to be male-driven as there were 88.8% aerospace engineers in the USA while females contributed by 11.2%.
By Type of Airport Delay
(Reference: faa.gov)
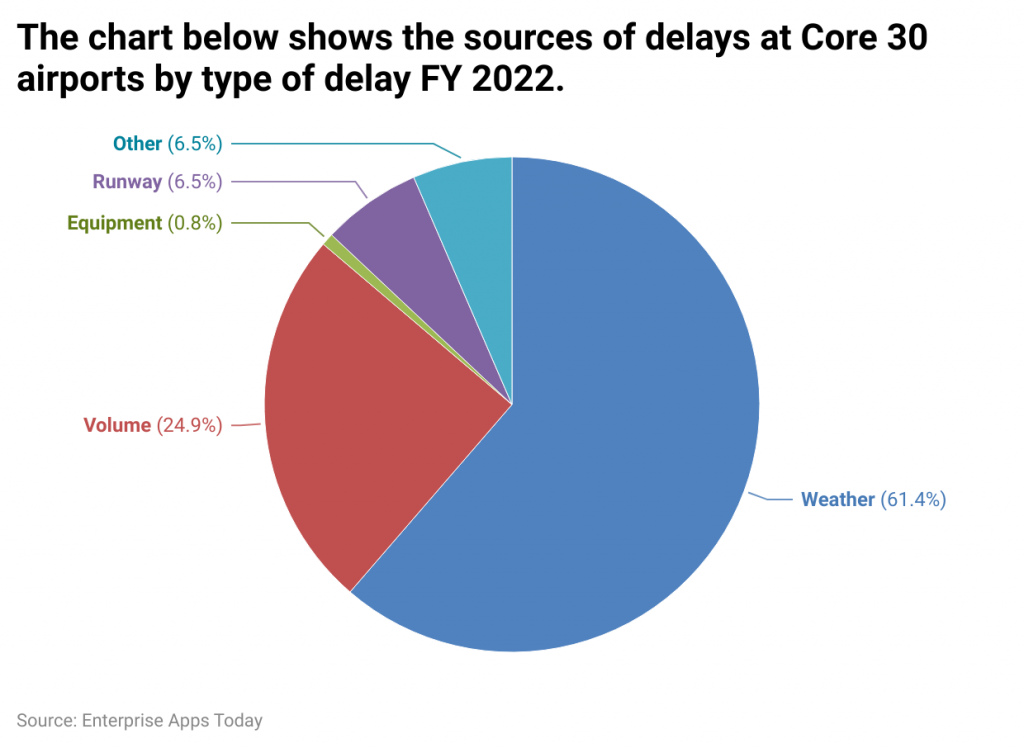
By the NAS System delay, flights from or arriving at their destination 15 minutes late are counted as delayed. Furthermore, the majority of the delays at Core 30 airports were reported because of weather conditions resulting in 61.4%. Volume Runway issues also contributed majorly by 24.9% and 6.5% respectively along with other issues. 0.8% of delays occurred due to equipment problems.
By Best Airports
By Country
(Source: airhelp.com)
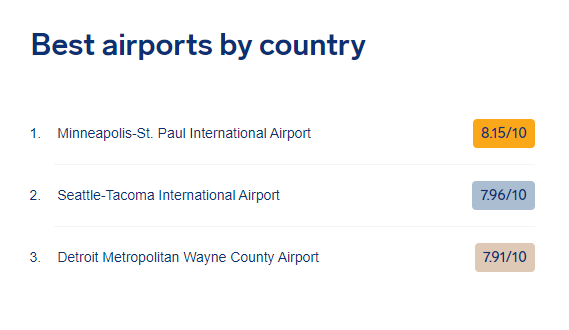
The top 3 airports in the USA in 2023 were Minneapolis- St Paul International Airport (8.15/10), Seattle- Tacoma International Airport (7.96/10), and Detroit Metropolitan Wayne County Airport (7.91/10).
By Region
(Source: airhelp.com)
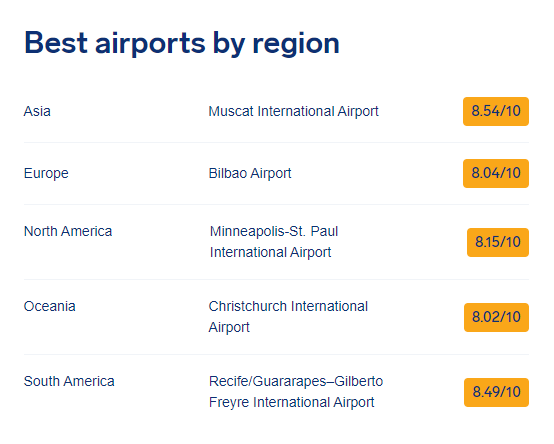
As of 2023, Aviation Statistics voted Muscat International Airport to be the best airport in the Asian region contributing an 8.54/10 score. Other, region-wise best airlines in 2023 were Bilbao Airport, Europe (8.04/10), Minneapolis- St. Paul International Airport, North America (8.15/10), Christchurch International Airport, Oceania (8.02/10), and Recife/ Guararapes- Gilberto Freyre International Airport, South America (8.49/10).
By Projected Airline Fleet Growth Between 2023 to 2042
(Reference: statista.com)
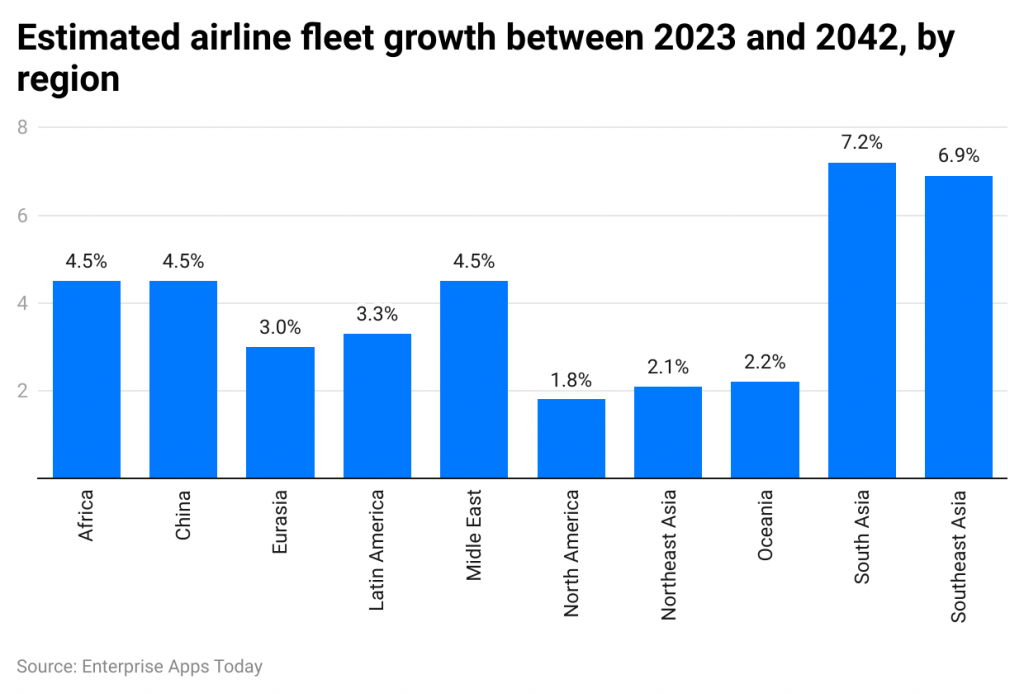
By 2042, South Asia and Southeast Asia are projected to grow airline fleets at the highest rates compared to other regions by contributing 7.2% and 6.9% respectively. On the other hand, the lowest rate is observed for North America resulting in 1.8%.
By Airport Availability
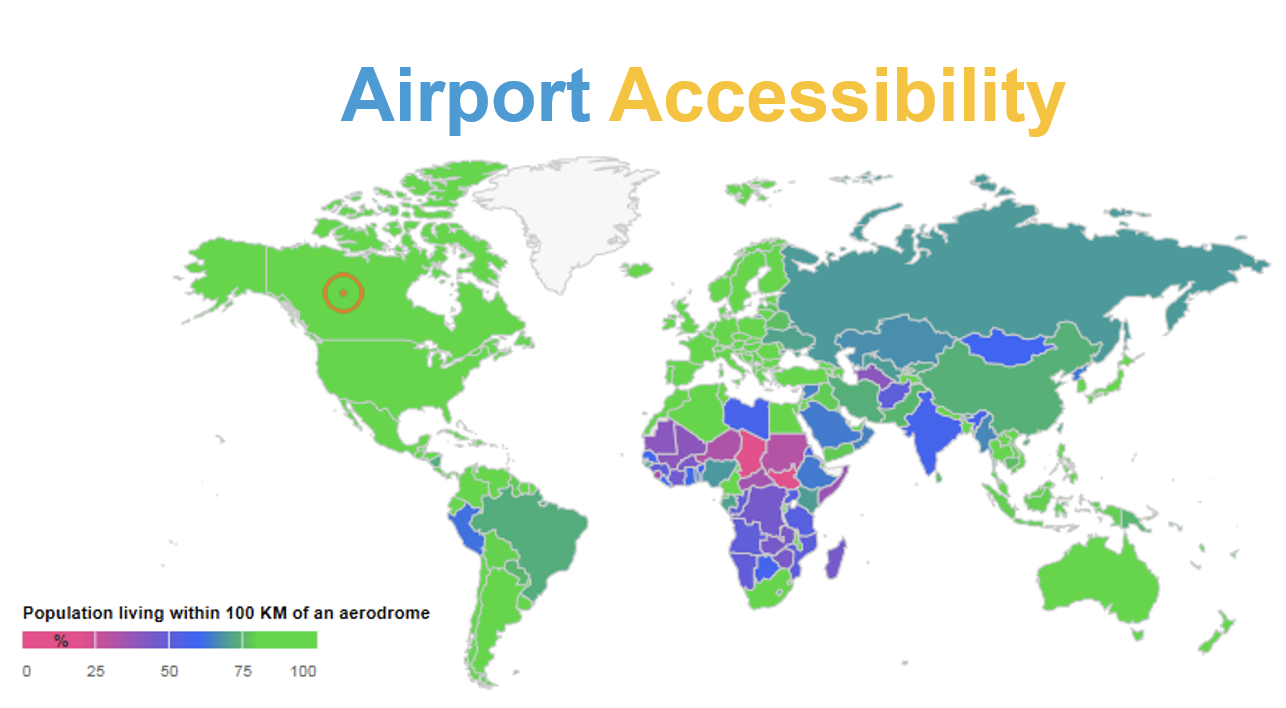
(Source: ICAO.int)
According to the International Civil Aviation Organization, around the world, more than half of the population resides within 100km of the international airport. On the other hand, 74% reside within 100 km of any airport.
By Leading Airlines by Brand Value
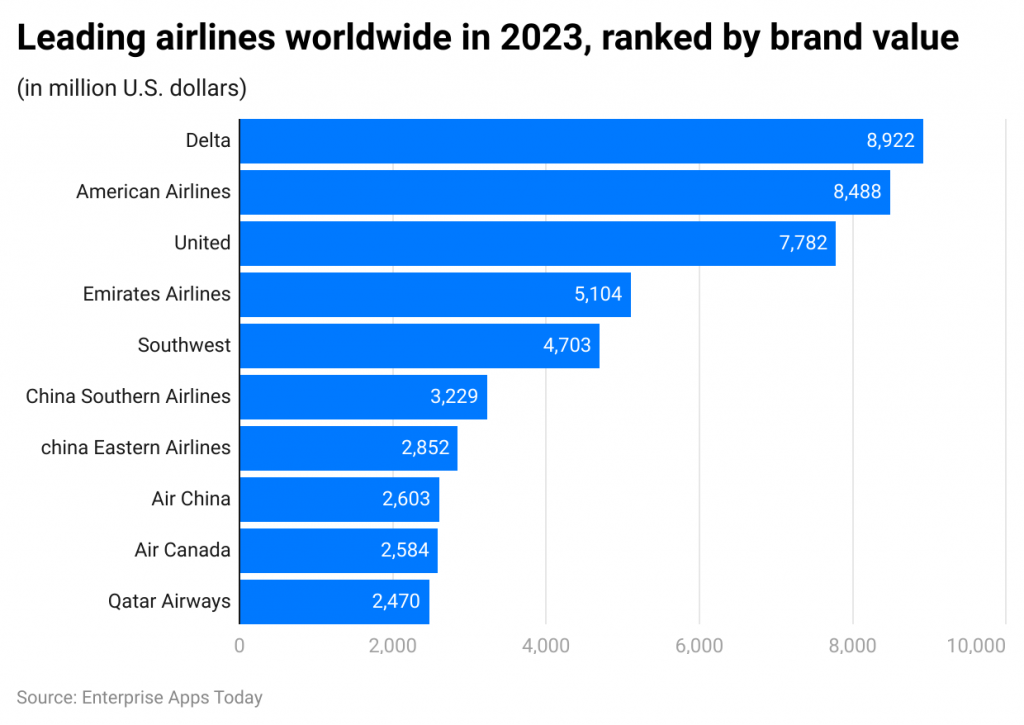
(Reference: statista.com)
In 2023, around the globe, Delta had the highest brand value resulting in $8,922 million. The other two airlines with the highest brand value were American Airlines ($8,488 million) and United Airlines ($7,782). Other than USA Airlines, others generated less than $5,000 of brand value.
By Global Airline Ranking
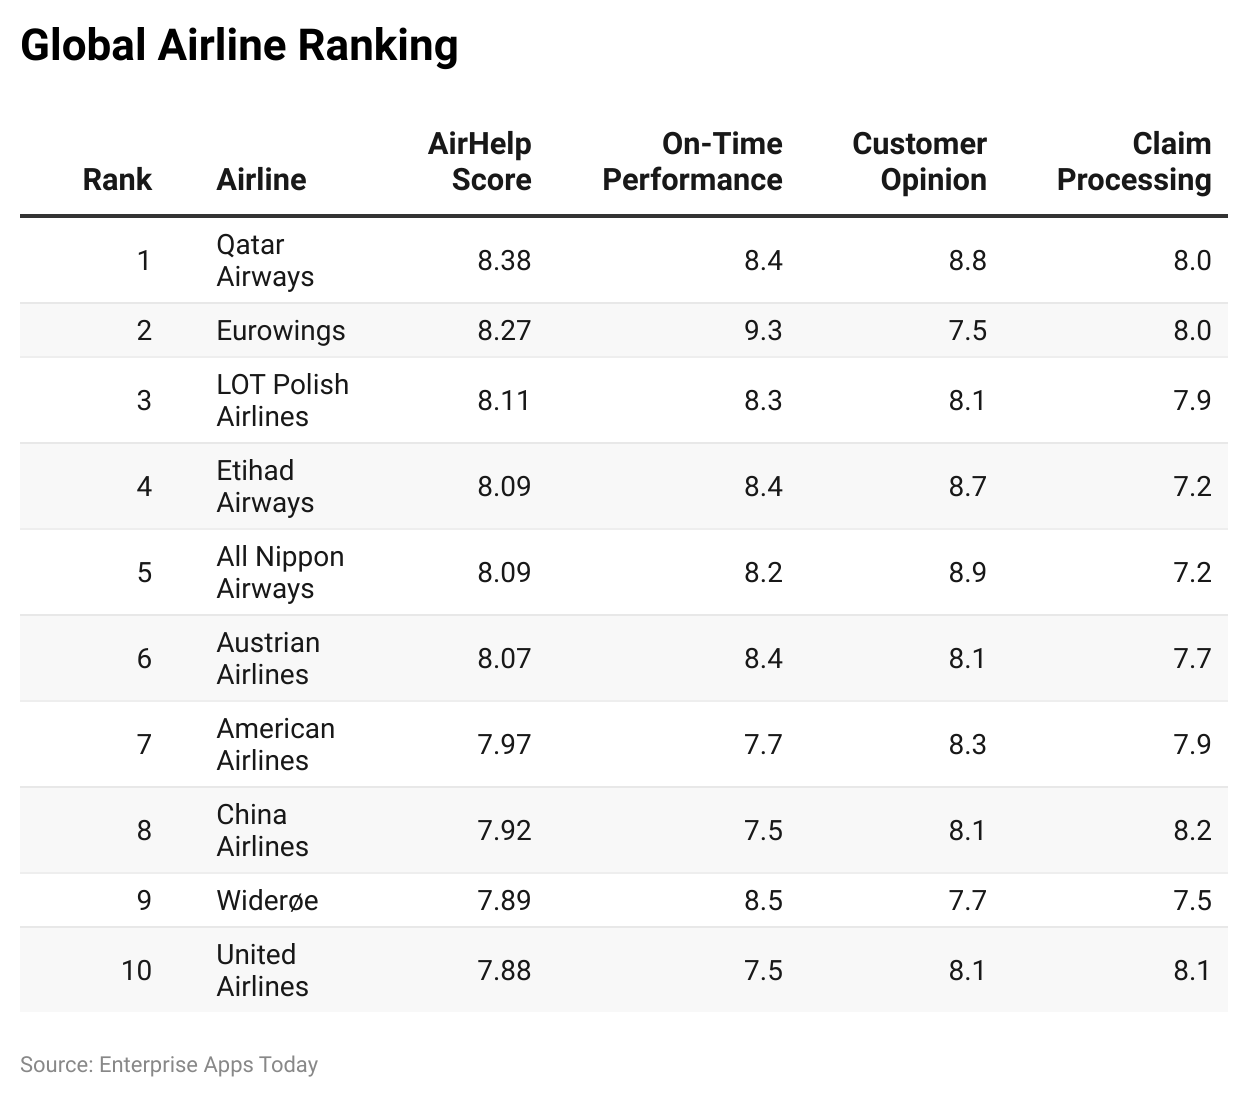
(Reference: airhelp.com)
As per Aviation Statistics 2023, Qatar Airways ranked top with the highest AirHelp Score resulting in 8.38. Similarly, in terms of on-time performance, customer opinion, and claim processing the brand generated more than 8 scores respectively. Furthermore, Eurowings and LOT Polish Airlines were other leading airlines by AirHelp score contributing 8.27 and 8.11.
By Best Airlines
By Country
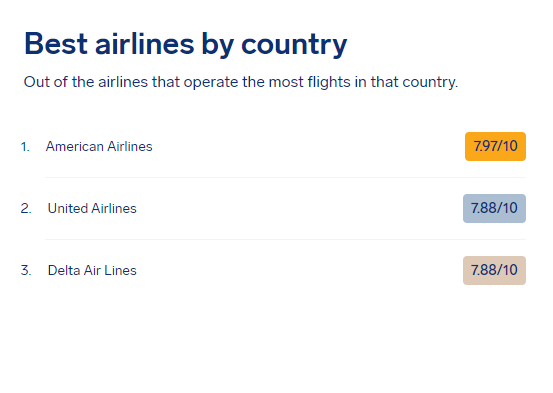
(Source: airhelp.com)
In the USA, in 2023, American Airlines became the best airline by 7.97/10, followed by United Airlines (7.88/10) and Delta Air Lines (7.88/10).
By Region
(Source: airhelp.com)
Region-wise best airlines in 2023 were Qatar Airways, Aisa (8.38/10), Eurowings, Europe (8.27/10), and American Airlines, North America (7.97/10).
By Aircraft Orders in 2022
(Source: kpmg.com)
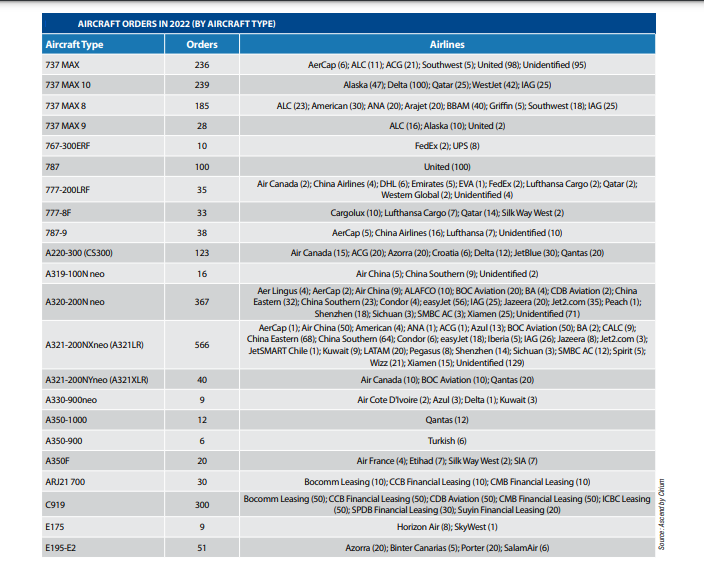
According to Aviation Leaders Report 2023, A321-200NXneo (A321LR) was the most ordered aircraft type with 566 orders in 2022. The leading ordered aircraft by airlines were A320-200N Neo (367), C919 (300), and 737 Max 10 (239).
By Causes of Delay By Reporting Operating Carrier
(Reference: transportation.gov)
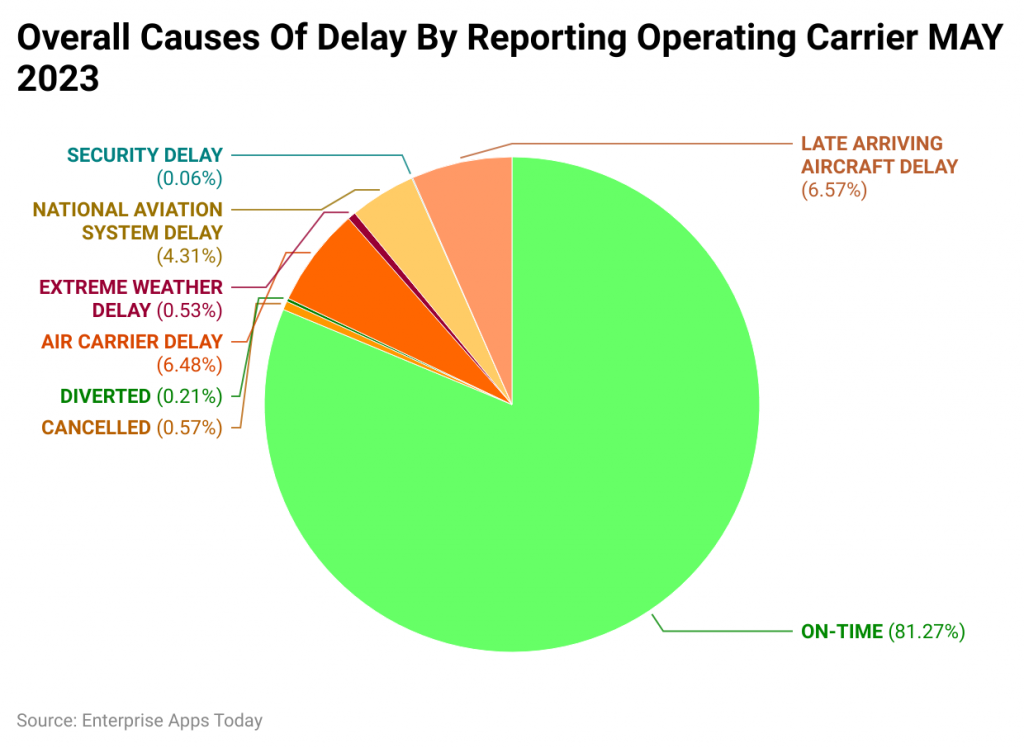
According to an Air Travel Consumer report, 81.27% of flights were on time, however, delays by reporting operating carriers were caused by cancellations (0.57%), diversion (0.21%), air carrier delay (6.48%), extreme weather conditions (0.53%), national aviation system delay (4.31%), security delay (0.06%) and late arriving aircraft delay (6.57%).
By Projected Aircraft Deliveries by Type
(Reference: statista.com)
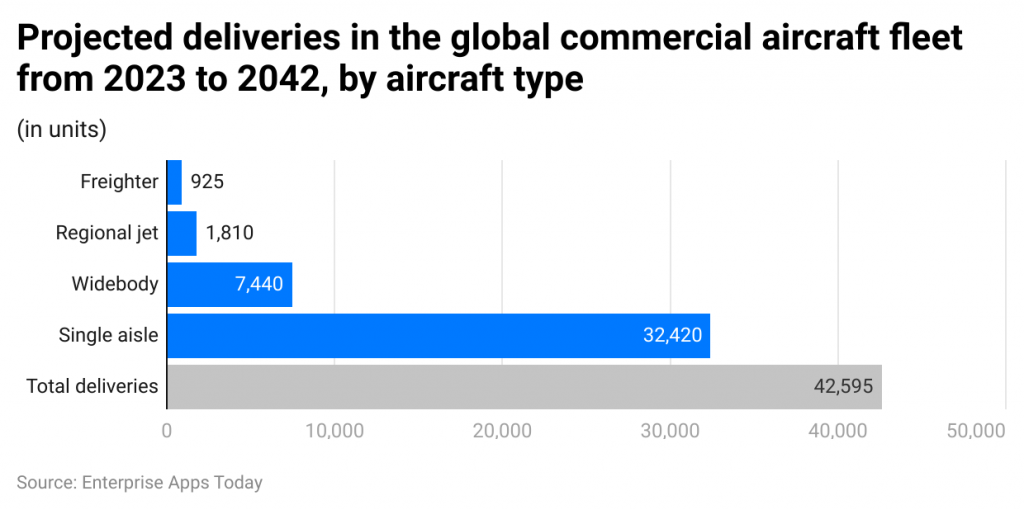
According to Aviation Statistics 2023, by 2042 the total worldwide aircraft deliveries including all types are projected to amount to 42,595. Out of which, the majority of the aircraft will be single-aisle (32,420), followed by Widebody (7,440). Compared to other types, deliveries to regional jets and freighters will be lower contributing 1,810 and 925 respectively.
By Aircraft Shipments
(Source: gama.aero)
In 2022, the total number of piston airplanes shipped around the world was 1,524 while 582 shipments were contributed by turboprop airplanes. Furthermore, total helicopter shipments represented 932. Aircraft shipments were valued at $22,865,799,694 and the total valuation of helicopters to date is $4,519,247,299.
Worldwide Active Military Aircraft Fleet in 2024
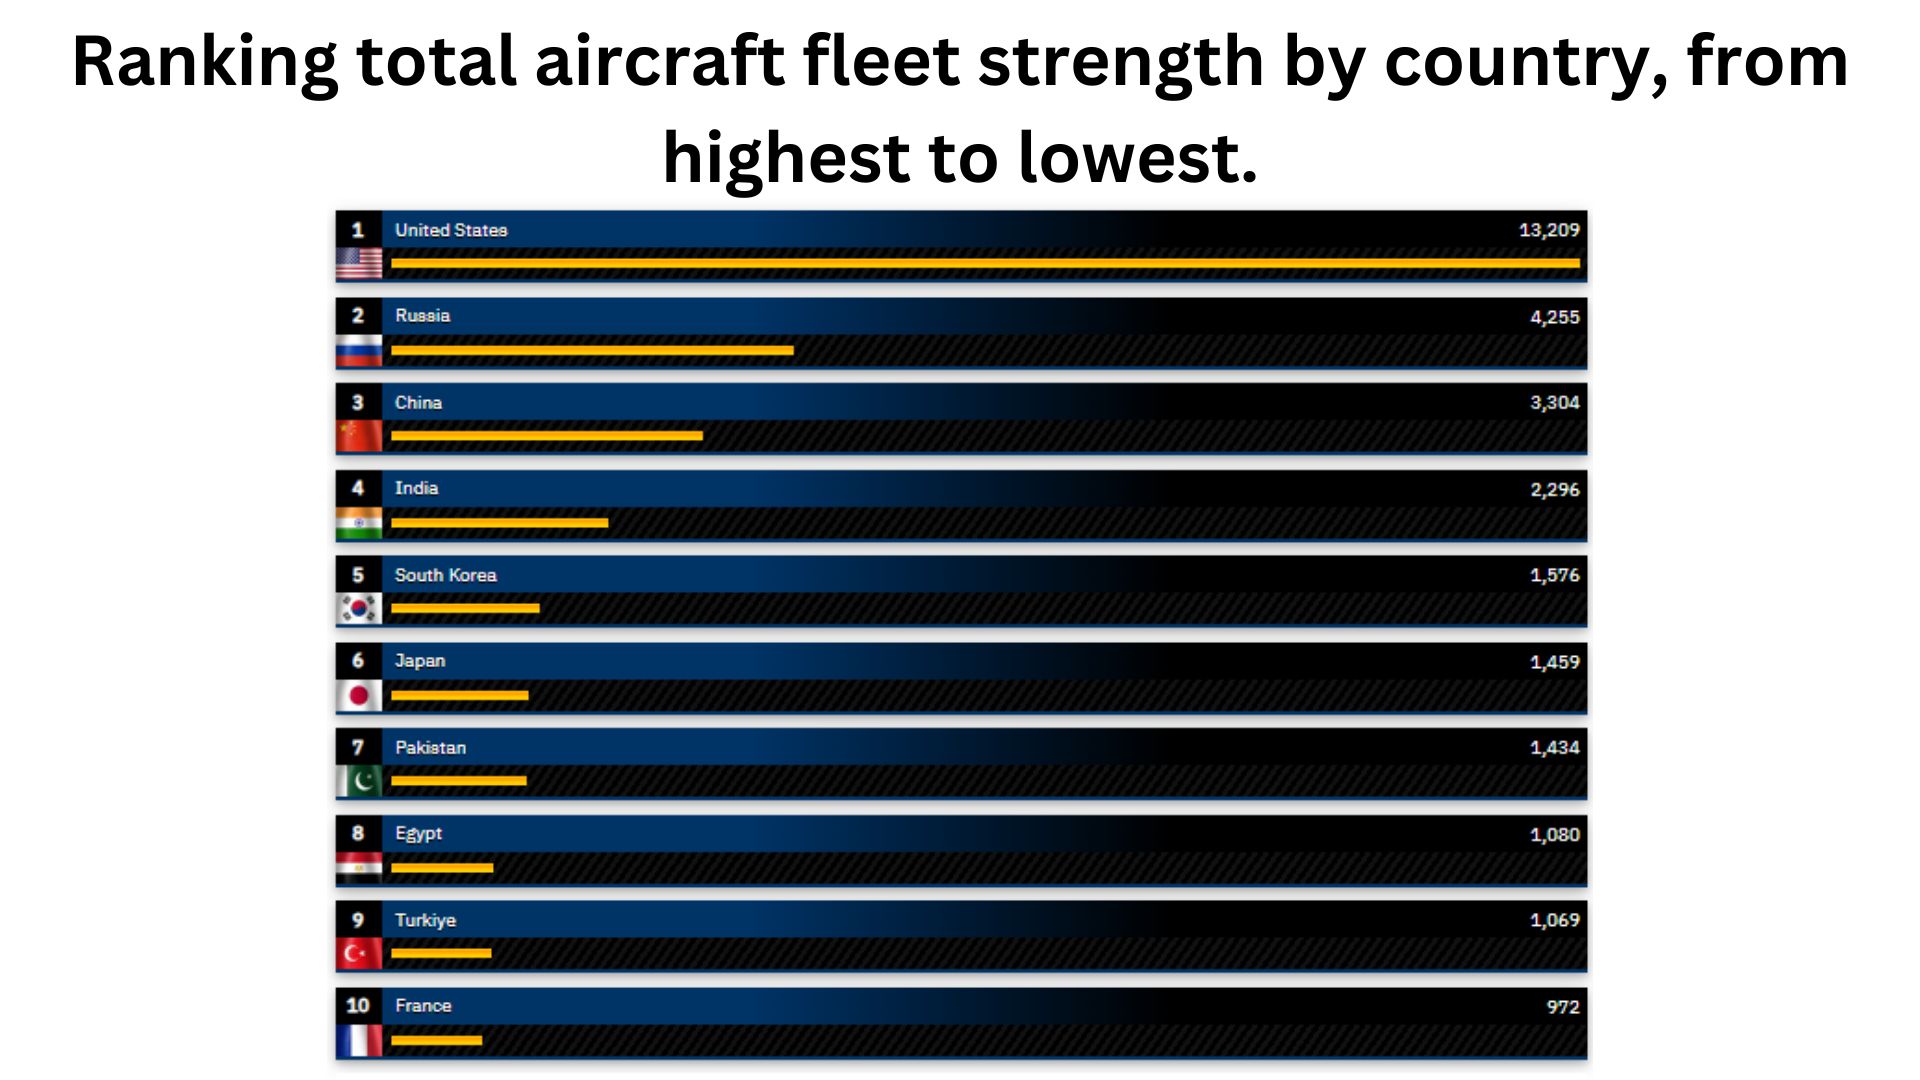
(Source: globalfirepower.com)
Aviation Statistics 2024 states that, the United States of America, (13,209), Russia (4,255), China (3,304), India (2,296), and South Korea are the largest countries with the highest number of military aircraft fleets in 2024.
By Busiest Air Routine in the World vs in the US in 2023
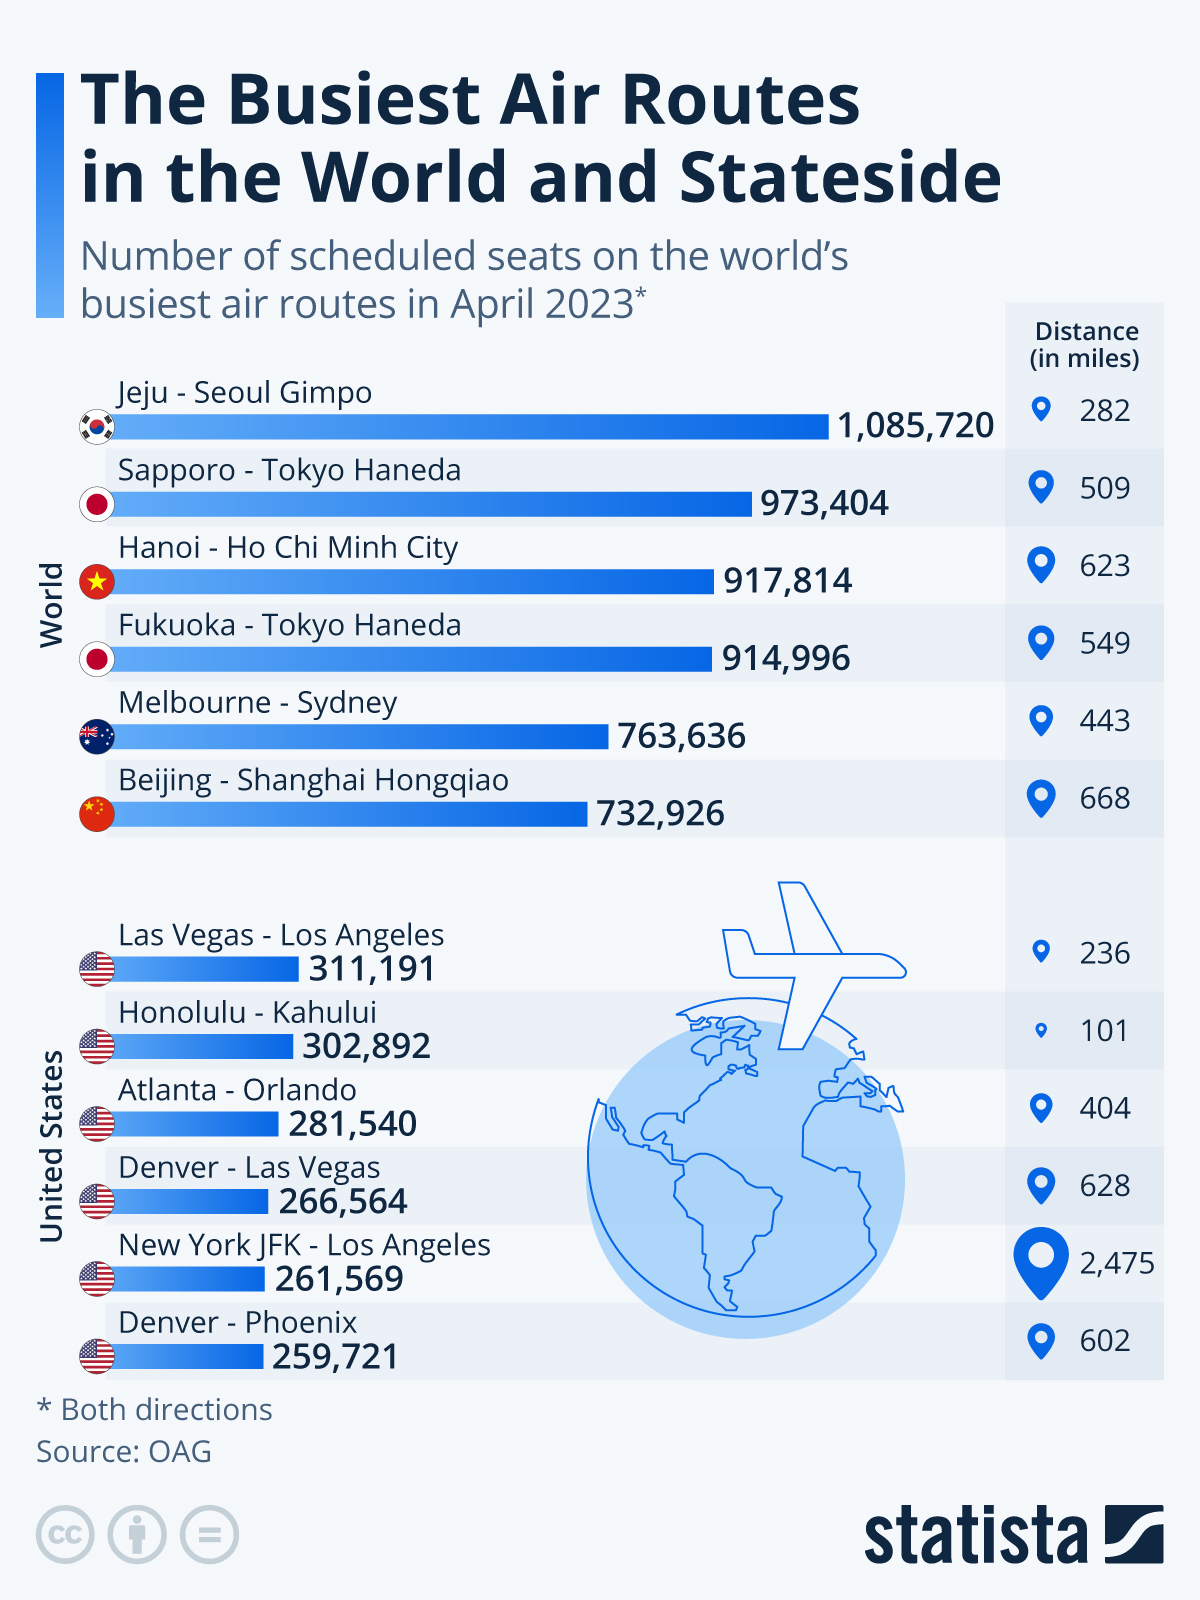
(Source: statista.com)
Conclusion
Globalization has let aviation-like industries become billion-dollar industries. These not only support general travel, but aid in the transport of goods overseas and in military activities. These numbers in the Aviation Statistics prove the bright future for the industry in every country.
Moreover, in the coming years, millions of jobs will be created in the aviation industry due to an increase in technological advancements, improvements in the supply chain industry, military services, and much more. Thus, individuals looking for an aviation career are already promised with bright career in the coming years.
FAQ.
Following are the types of Airplanes
Jets, Amphibious, Bombers, Piston aircraft, Private jets, regional airlines, narrow-body aircraft, commuter liners, parachutes, aerobatic planes, cargo airplanes, turboprop aircraft, unmanned aircraft, passenger planes, airbus, jumbo jets, light jets, Concorde and multi-engine piston. All of these include commercial and private types of airplanes
Aircraft is the overall term used for flying vehicles such as helicopters, airplanes, etc. However, airplanes are specific to the vehicles which have wings to fly and consist of multiple engines.
The 3 types of aviation include military, commercial, and general aviation.
The average salary of a pilot is $134,630 per annum.

Barry is a lover of everything technology. Figuring out how the software works and creating content to shed more light on the value it offers users is his favorite pastime. When not evaluating apps or programs, he's busy trying out new healthy recipes, doing yoga, meditating, or taking nature walks with his little one.