
Airline Statistics By Market Share, Causes of Delay, Cargo and Region
Page Contents
- Introduction
- Editor’s Choice
- What is an Airline?
- Types of Aircrafts
- Types of Airlines
- General Airlines Statistics
- Airlines Statistics by Issues
- Airlines Statistics by People who have never flown
- Airlines Statistics by Total Travelers
- Airlines Statistics by Causes of Delay
- Airlines Statistics by Domestic Market Share
- Airlines Statistics by Cargo
- Airlines Statistics by Leading Airline Brands
- Airline Statistics by The Largest Airports in the World
- Airline Statistics by Region
- Airline Statistics by Most Popular Travel Countries
- Conclusion
Introduction
Airline Statistics: The global aviation industry is already marked as a billion-dollar industry. Millions of people travel every day hither and thither. Many travelers enjoy visa-free countries while some choose countries that need pre-arrival visa entries. Well, we are not only talking about the industry where people travel but also cargo that delivers our international orders. Amazon and alike eCommerce websites benefited because of the air travel method. We can easily order an international package and get it delivered in under 2 to 3 weeks at our doorstep.
These interesting Airline Statistics are written including global as well as United States of America insights. Plus, it also includes a fun element at the end where you can track the live air traffic globally.
Editor’s Choice
- As of 2022, the highest rate of customer complaints in US carriers was received by Frontier Airlines resulting in 20.26 customer complaints for every 100,000 enplanements on domestic scheduled flights.
- As of 2022, the total number of jobs in the United States of America generated by aviation was 10,857,000.
- Total airlines in the United States of America flew more than 194 million passengers in 2022.
- On average, there are more than 10,000,000 scheduled passenger flights in the United States of America.
- In the United States of America, there are 34,200 experimental light crafts, more than 167,000 fixed-wing general aviation aircraft, and 10,000 rotorcraft.
- In 2022 the aviation department contributed 5.2% to the gross domestic product in the United States of America.
- American Airlines reported an average of one bag mishandled for every 100 bags enplaned, having the highest rate of mishandled baggage in US airlines in 2022.
- Every year, annual earnings generated by the aviation department amount to $488 billion.
- Every year, the reported general aviation flight hours in the United States of America are 25,506,000.
- The length of the total United States domestic airspace is 5,300,000 square miles.
What is an Airline?
An airline is an operator that provides air transportation facilities to carry goods or passengers across borders. The airline industry includes passengers, caterers, cleaners, airports, airplanes, loaders, flight attendants or hostesses, pilots, and reservations. Every year billions of travelers and around 52 billion tonnes of cargo are transported by air. Looking at the current demand, shipping via air is the most booming industry because due to technological advances, companies are spread across the globe and have their customer order from anywhere in the world. Other than planes, rockets, helicopters, jets, hot air balloons, gliders, hand gliders, and blimps also come under the air transport department.
The world’s oldest airpost is called Toussus-le-Noble Airport situated near Paris and built in 1907.
Types of Aircrafts
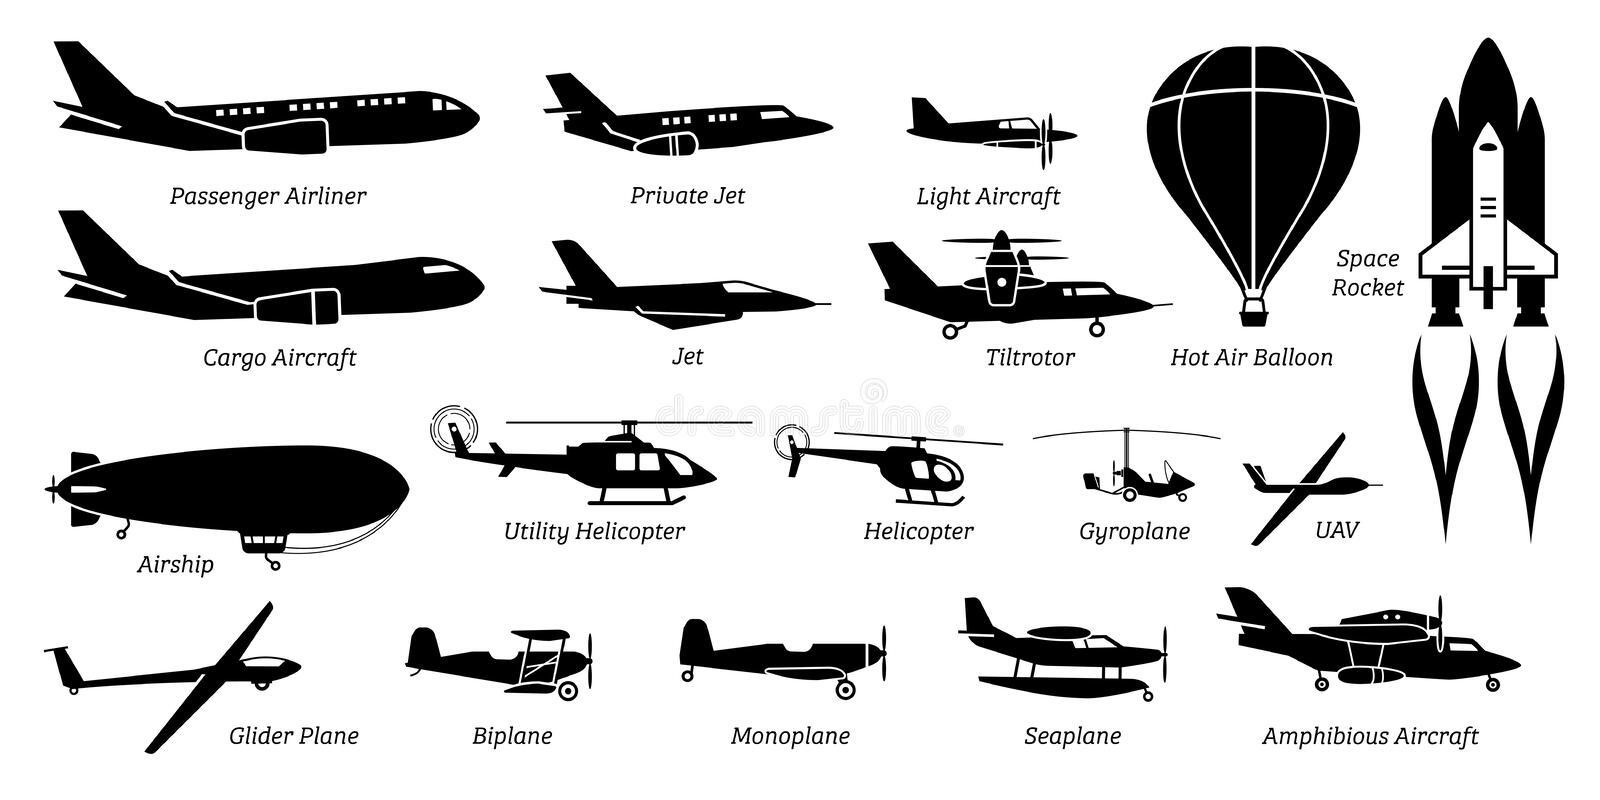
(Source: dreamstime.com)
Types of Airlines
- National Airlines: National airlines offer travel within home countries as well as international destinations. For eg. Vistara, Indigo, etc.
- Regional Airlines: Regional airlines travel with limited distance, They are a part of domestic travel. Moreover, the seasonal fluctuations affect the demand for the mentioned airlines.
- International Airlines: International Airlines are the best fit for boundary-wise travel around the world. For example American Airlines, Emirates, Delta Airlines, etc…
- Cargo Airlines: Cargo airlines or freight carriers transport freight or cargo, with sub-divisions of airlines can also provide passenger services. Examples: FedEx Express, UPS Airlines, etc…
General Airlines Statistics
- Total airlines in the United States of America flew more than 194 million passengers in 2022.
- On average, there are more than 10,000,000 scheduled passenger flights in the United States of America.
- Airline Statistics state that, on average, 5,400 aircraft fly in the sky during peak hours.
- The length of the total United States domestic airspace is 5,300,000 square miles.
- As of 2022, there are 520 airport traffic control towers and 21 air route traffic control centers in the US.
- According to aviation reports, every day 2,900,000 passengers fly in and out of airports in the United States of America.
- Every year, annual earnings generated by the aviation department amount to $488 billion.
- Whereas, in 2022 the aviation department contributed 5.2% to the gross domestic product in the United States of America.
- As of 2022, the total number of jobs in the United States of America generated by aviation was 10,857,000.
- Moreover, as of 2022, around 147 terminal radar approach control facilities were reported.
- Every year, the airline carries 44,500,000,000 pounds of freight.
- In the United States of America, there are 34,200 experimental light crafts, more than 167,000 fixed-wing general aviation aircraft, and 10,000 rotorcraft.
- Every year, the reported general aviation flight hours in the US are 25,506,000.
- 20% of the global population has at least once traveled by air in their lifetime.
- As of April 2022, Delta Air Lines was the most valuable airline around the world.
- As of 4th March 2022, the average weekly jet fuel price was $3.24 per gallon.
- Airline Statistics state that Asia Pacific is the largest growing market for global airline market between 2023 to 2028.
Airlines Statistics by Issues
- As of 2022, the highest rate of customer complaints in US carriers was received by Frontier Airlines resulting in 20.26 customer complaints for every 100,000 enplanements on domestic scheduled flights.
- American Airlines reported an average of one bag mishandled for every 100 bags enplaned, having the highest rate of mishandled baggage in US airlines in 2022.
- Moreover, as of 2022, Spirit Airlines recorded the highest number of mishandled wheelchairs and scooters resulting in 5.8% of total transported.
- 20% of the passengers experienced disruptions in travel by air whereas, 60% of the travelers faced it during connecting flights.
- 59% of the travelers are satisfied with their chosen airlines while 20% of passengers who have requested special assistance experienced baggage mishandling.
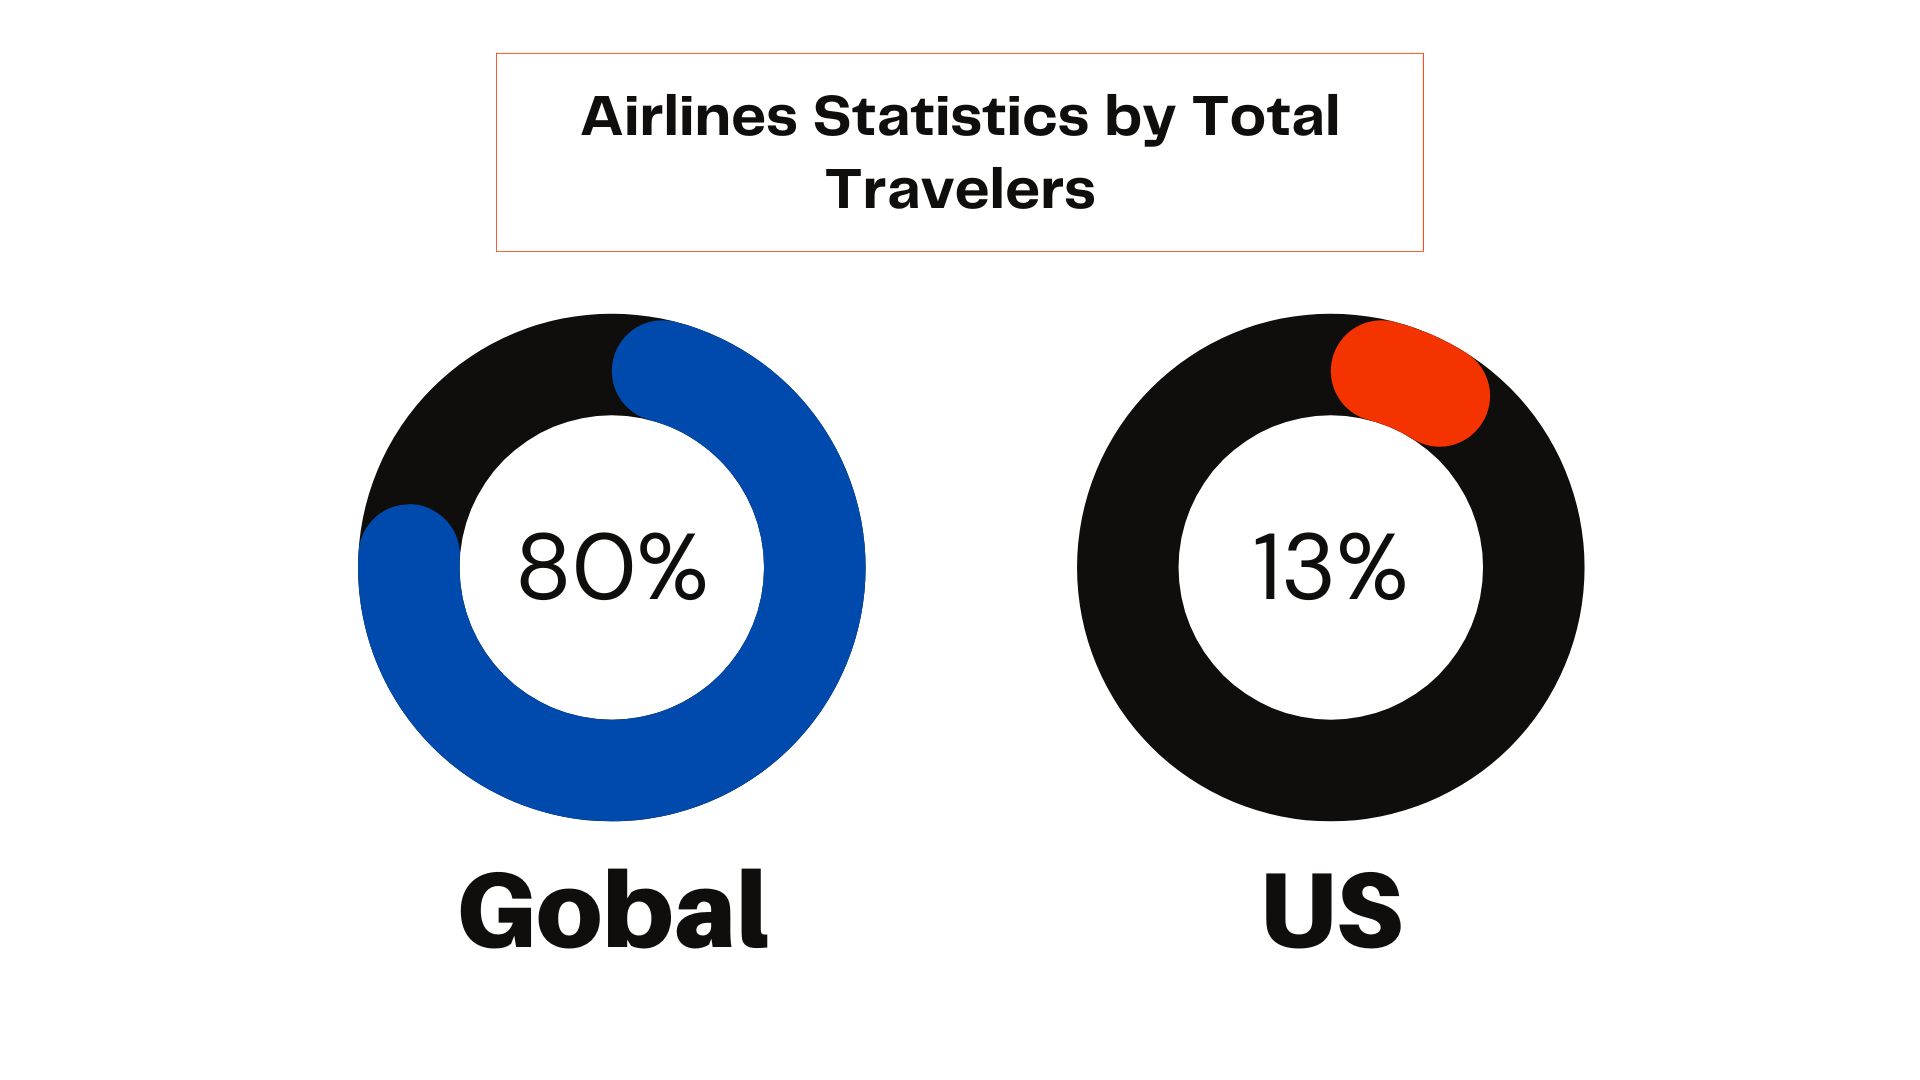
Airlines Statistics by People who have never flown
- As of 2022, 80% of the global population stated that they have never traveled by air.
- On the other hand, 13% of the population in the United States of America stated similarly.
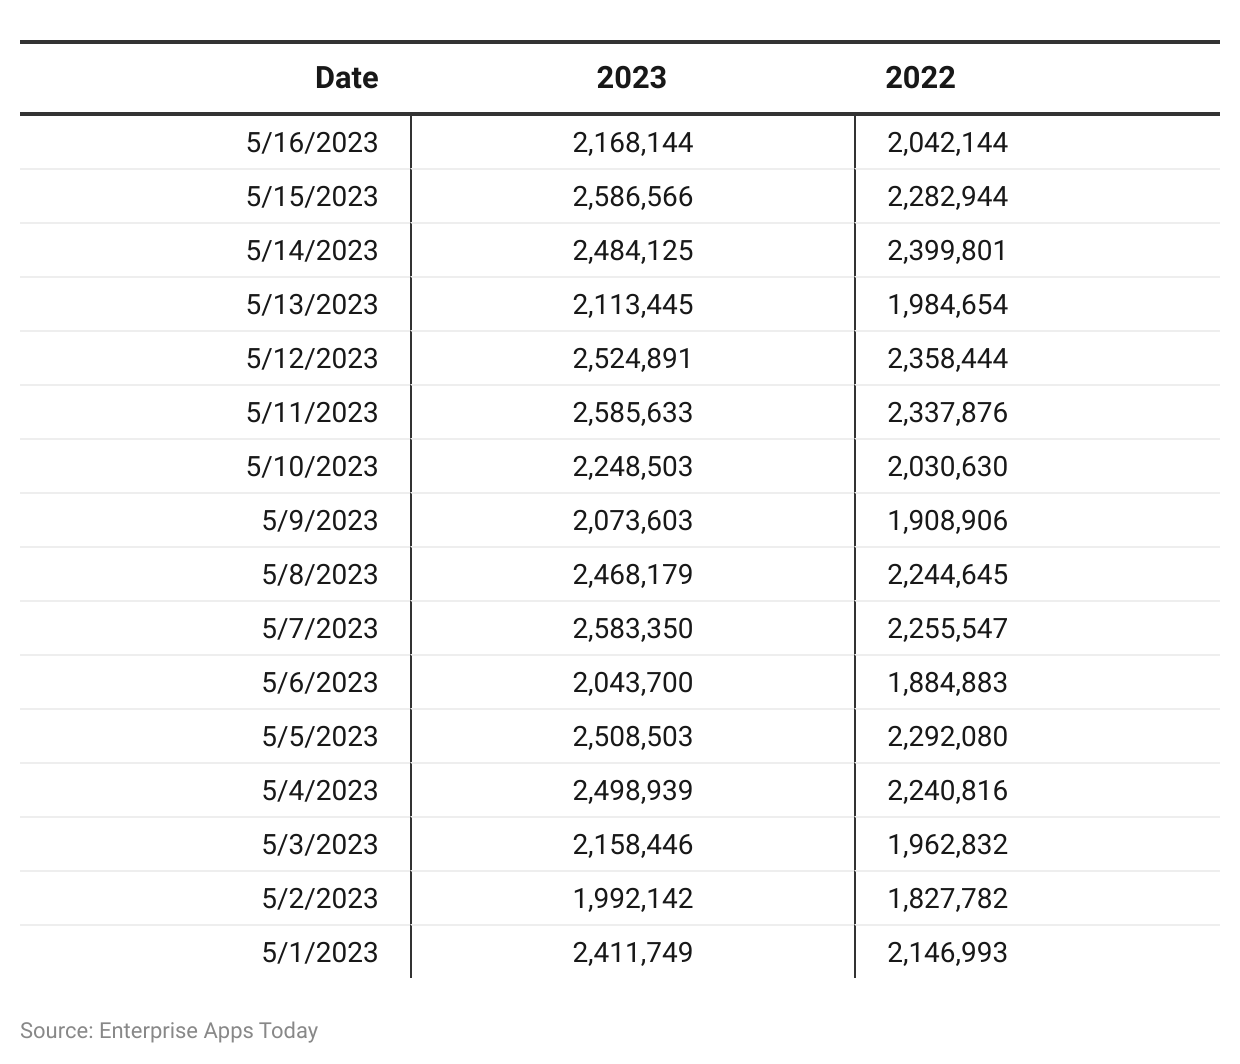
Airlines Statistics by Total Travelers
(Reference: tsa.gov)
- Airline Statistics confirms in the above chart, the same day year-wise comparison of travelers by air in May 2023.
- As compared to 2022, the year 2023 observed more air travelers resulting in 2,585,633 the highest on 11th May 2023.
- The lowest number of travelers was observed on 2nd May 2023.
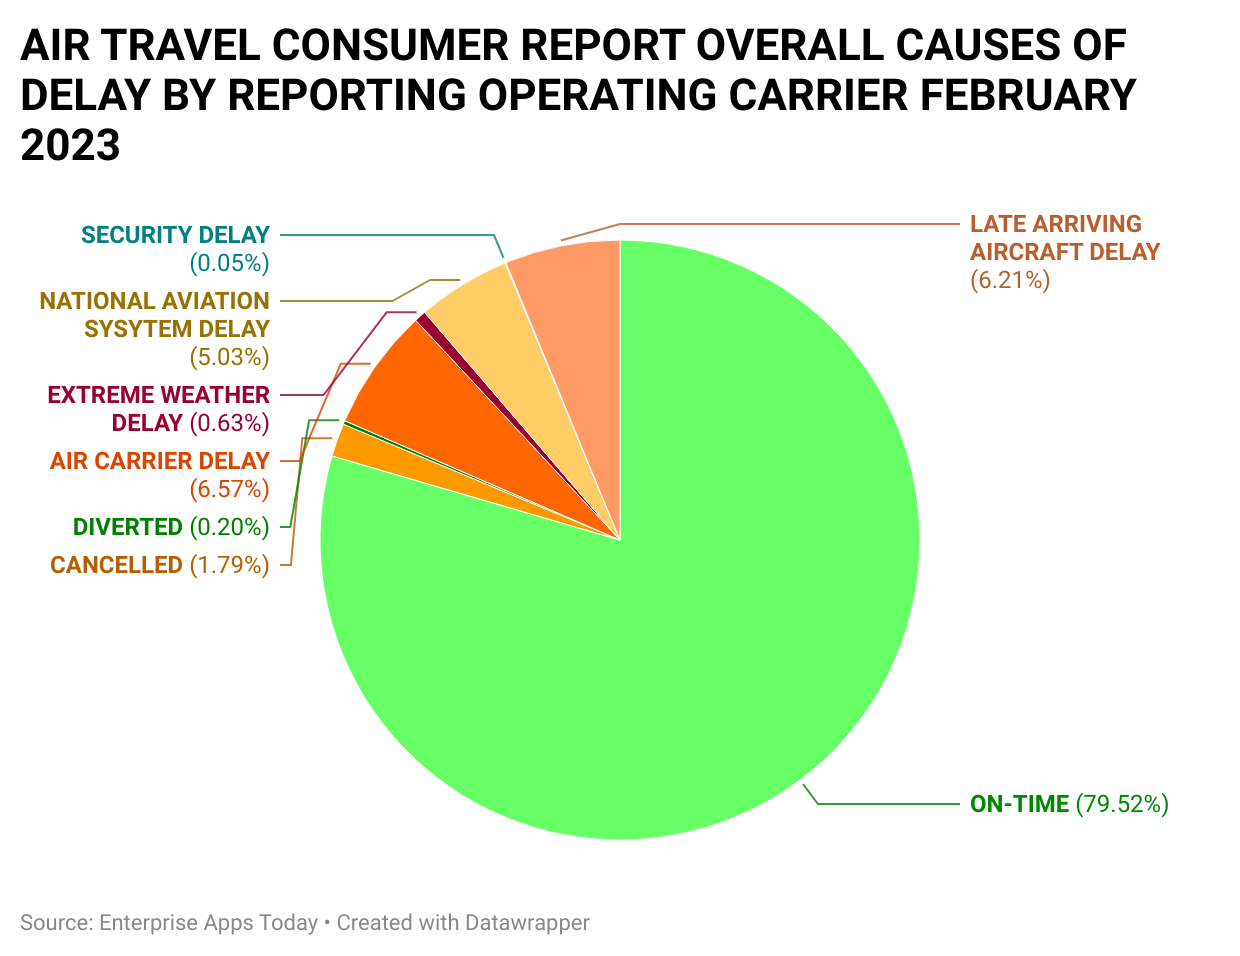
Airlines Statistics by Causes of Delay
(Reference: transportation.gov)
As of February 2023, Airlines Statistics confirmed that 79.52% of airlines landed on time.
Other issues that caused delays by operating carriers as of February 2023 are as follows
- Canceled (1.79%)
- Diverted (0.20%)
- Air carrier delay (6.57%)
- Extreme Weather day (0.63%)
- National Aviation System Day (5.03%)
- Security delay (0.05%)
- Late arriving aircraft delay (6.21%)
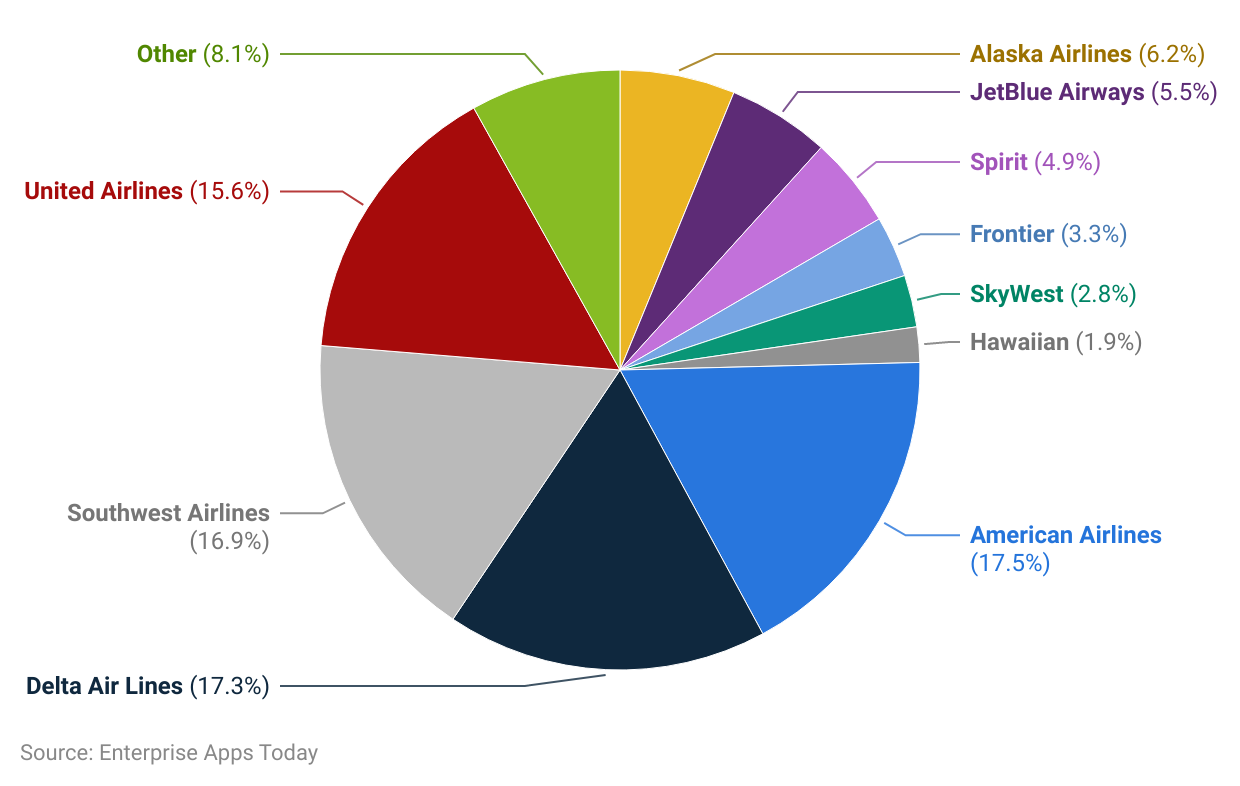
(Reference: statista.com)
American Airlines has the largest domestic market share in the united states of America resulting in 17.5% between February 2022 to January 2023. In addition to these, other leading airlines in the domestic market of the US, similar periods are
- Delta Airline -17.3%
- Southwest Airlines – 16.9%
- United Airlines – 15.6%
- Alaska Airlines – 6.2%
- JetBlue Airways – 5.5%
- Spirit – 4.9%
- Frontier – 3.3%
- SkyWest – 2.8%
- Hawaiian – 1.9%
- And other airlines collectively make 8.1%
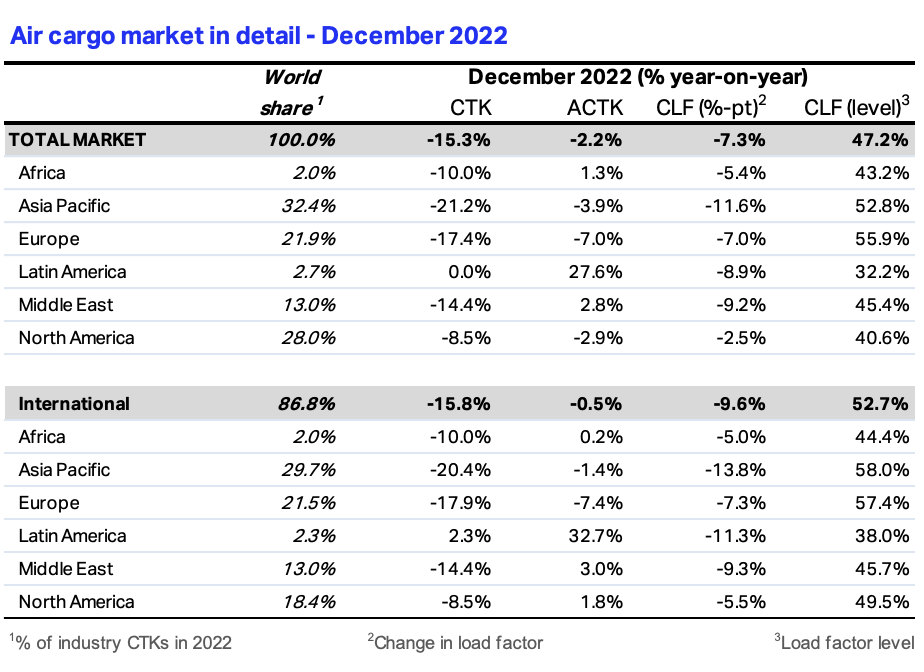
Airlines Statistics by Cargo
(Reference: iata.org)
As of December 2022, out of the total Cargo market, the highest international cargo shipments were conducted by the Asia Pacific region resulting in 29.7%.
Other regions in a similar category are
- Europe – 21.5%
- North America – 18.4%
- Middle East – 13%
- Latin America – 2.3%
- Africa – 2%
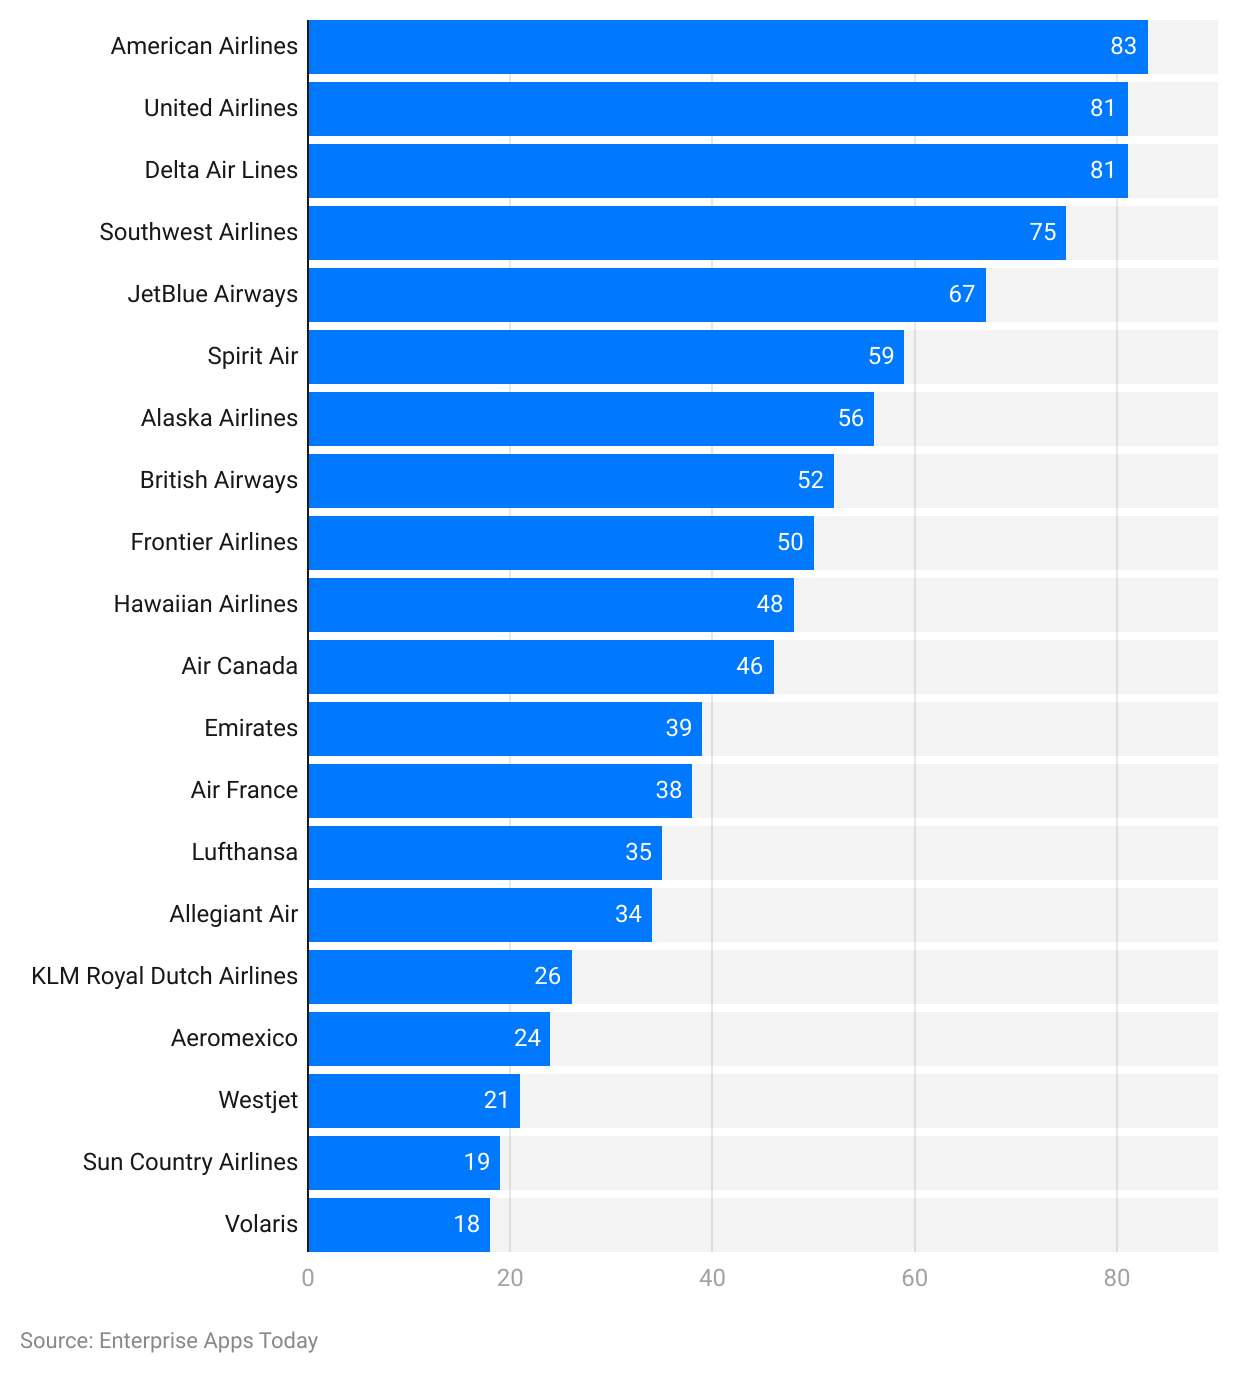
Airlines Statistics by Leading Airline Brands
by Brand Awareness
(Reference: statista.com)
American Airlines (83%), United Airlines (81%), and Delta Air Lines (81%) are the leading airline brands in the United States of America as of 2022 by brand awareness. Followed by
- Southwest Airlines (75%)
- Jetblue Airways (67%)
- Spirit Air (59%)
- Alaska Airlines (56%)
- British Airways (52%)
- Frontier Airlines (50%)
- Hawaiian Airlines (48%)
- Air Canada (46%)
- Emirates (39%)
- Air France (38%)
- Lufthansa (35%)
- Allegiant Air (34%)
- KLM Royal Dutch Airlines (26%)
- Aeroméxico (24%)
- Westjet (21%)
- Sun Country Airlines (19%)
- Volaris (18%)
By Market Cap
(Reference: companiesmarketcap.com)
- Ryanair ($22.91 billion)
- Delta Air Lines ($22.04 billion)
- Air China ($20.77 billion)
- Southwest Airlines ($17.65 billion)
- China Southern Airlines ($17.45 billion)
- United Airlines Holdings ($14.96 billion)
- China Eastern Airlines ($14.69 billion)
- Singapore Airlines ($13.32 billion)
- Lufthansa ($11.96 billion)
- ANA Holdings ($11.20 billion)
Airline Statistics by The Largest Airports in the World
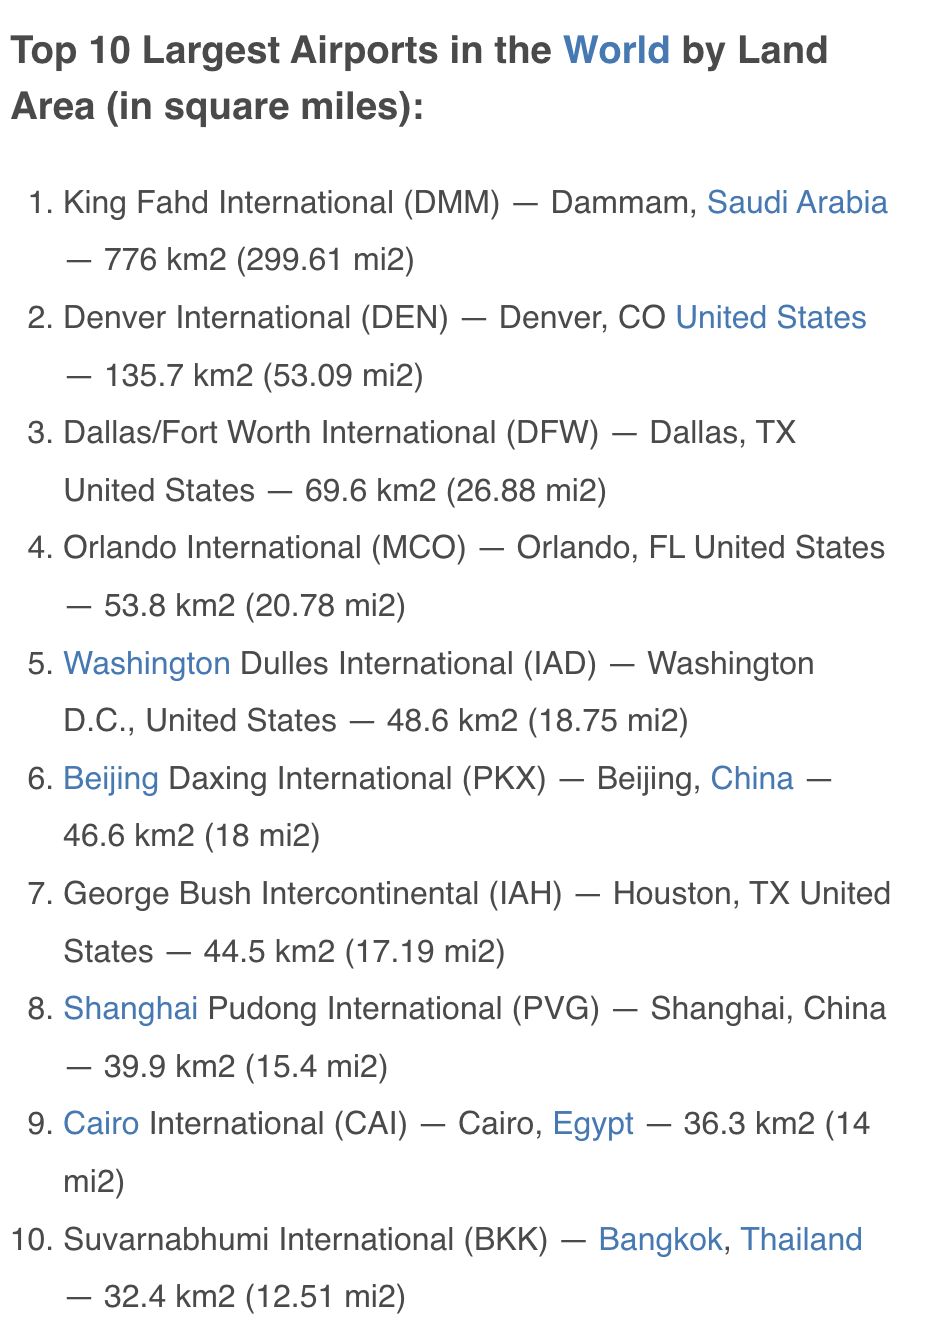
(Reference: worldpopulationreview.com)
- King Fahd International, Dammam (Saudi Arabia), 776km2
- Denver International, Denver (USA), 135.7km2
- Dallas/ Fort Worth International, Dallas. TX (USA)
- Orlando International, Orlando, FL (USA) 53.8km2
- Washington Dulles International, Washington DC (USA), 48.6km2
- Beijing Daxing International, Beijing (China), 46.6km2
- George Bush International Houston, TX (USA), 44.5 km2
- Shanghai Pudong International, Shanghai (China) 39.9km2
- Cairo International, Cairo (Egypt), 36.3km2
- Suvarnabhumi International, Bangkok (Thailand), 32.4km2
Airline Statistics by Region
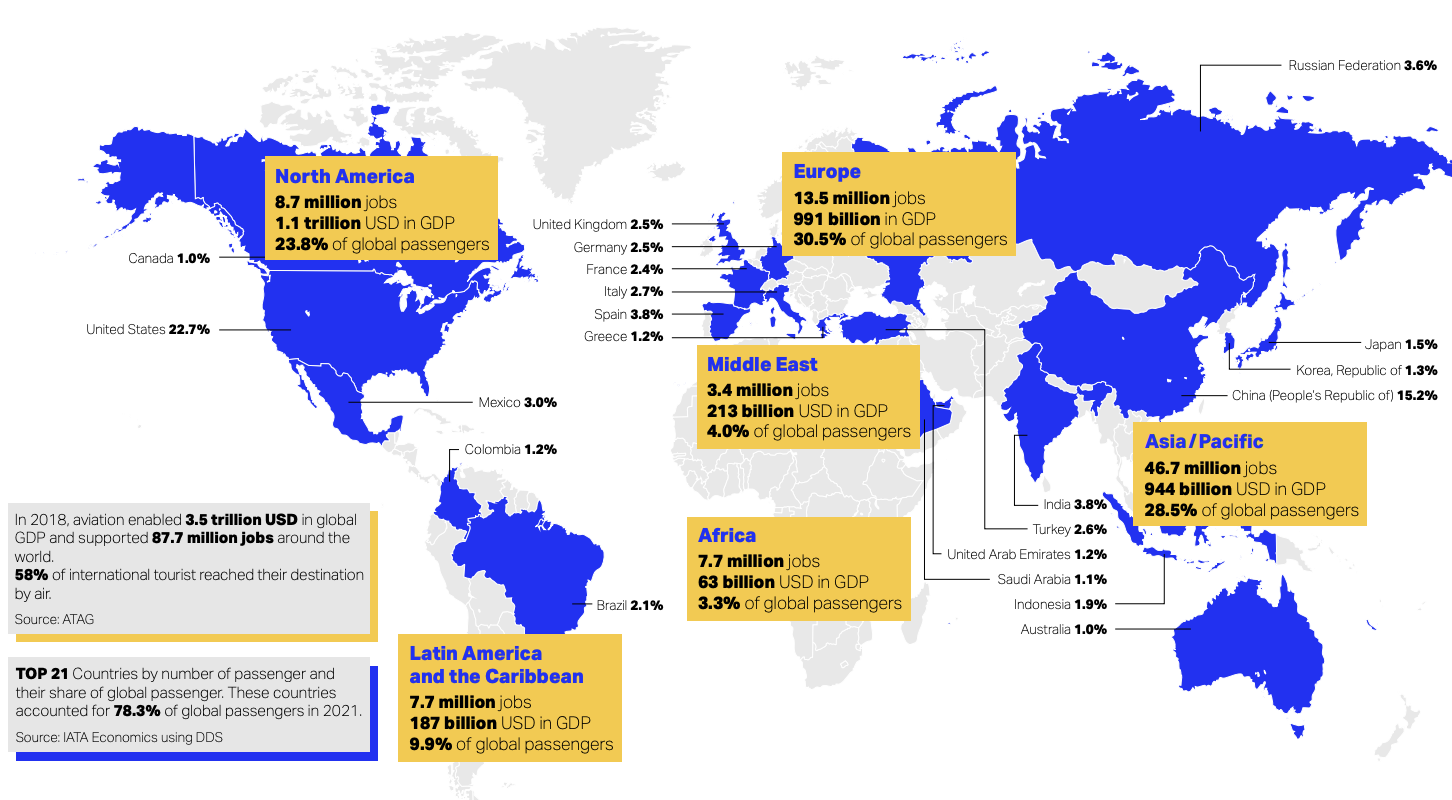
(Reference: iata.org)
By Total Air Passenger
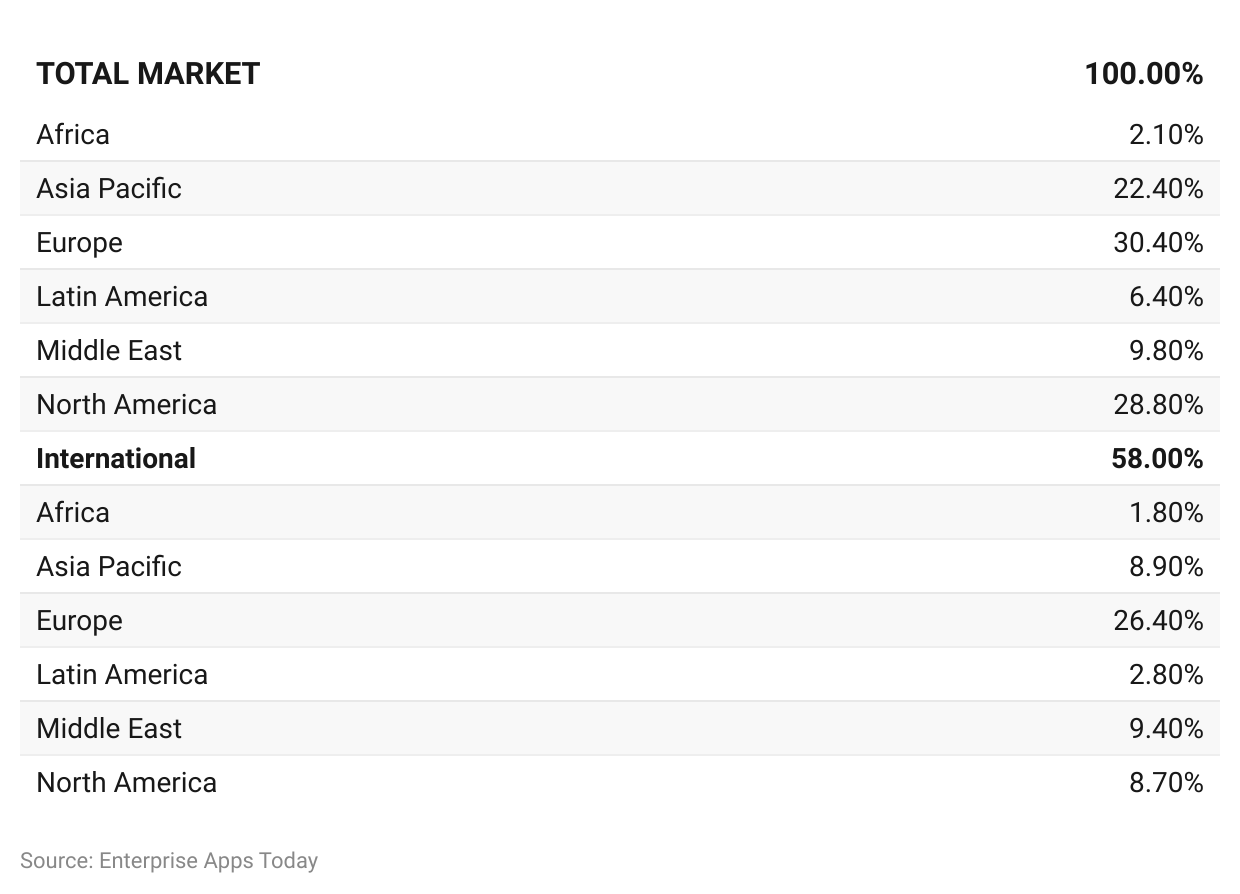
(Reference: iata.org)
Domestic travelers around various destinations in 2022 accounted as follows
- Europe (30.4%)
- North America (28.8%)
- Asia Pacific (22.4%)
- Middle East (9.8%)
- Latin America (6.4%)
- Africa (2.1%)
Whereas, international travelers around various destinations in 2022 accounted as follows
- Europe (26.4%)
- Middle East (9.4%)
- Asia Pacific (8.9%)
- North America (8.7%)
- Latin America (2.8%)
- Africa (1.8%)
Airline Statistics by Most Popular Travel Countries
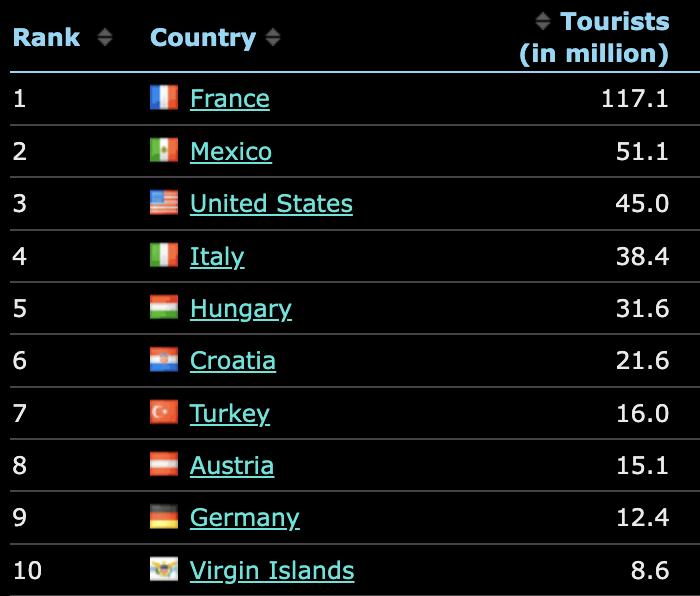
(Reference: worlddata.info)
France, Mexico, and the United States of America are the most popular destinations for international travel. Each country received 117.1 million, 51.1 million, and 45 million travelers last year.
In addition to the top three most popular destinations for international travel, other countries are
- Italy – 38.4 million travelers
- Hungary – 31.6 million travelers
- Croatia – 21.6 million travelers
- Turkey – 16 million travelers
- Austria – 15.1 million travelers
- Germany – 12.4 million travelers
- Virgin Islands – 8.6 million travelers
Conclusion
Airplanes are the best mode of transport to travel internationally. Today, we can easily travel to international destinations without any worries. Looking at these Airline Statistics, it is definitely coming out of the lockdown recovery mode. Many travelers are still hesitant to go around countries, while some are already on planes landing on the beaches.
In addition to people traveling to other countries, small-scale businesses are also able to reach global markets using digitalization and cargo facilities. With surprising elements to doorstep deliveries, Amazon has already started delivering packages via drones in the United States of America. Although air travel is expensive, is cozy and comfortable as well.
Sources
FAQ.
Start by researching the best pilot schools, and take admission. Once done, apply for FAA medical certificate along with an FAA student pilot certificate. You can start flight training lessons after receiving the mentioned documents. To become a certified qualified pilot you are required to pass a private pilot knowledge test along with a private pilot practical exam.
On average the salary of a pilot is $211,790 as of 2022. The largest airlines offer to earn more than $700,000 per year.
As of 2023, United Airlines, Delta Airlines, American Airlines, and Southwest Airlines are the largest airlines in the world.
MakemyTrip or Expedia offers the cheapest prices to book domestic as well as international flights.

Barry is a lover of everything technology. Figuring out how the software works and creating content to shed more light on the value it offers users is his favorite pastime. When not evaluating apps or programs, he's busy trying out new healthy recipes, doing yoga, meditating, or taking nature walks with his little one.