
Open Source Vendors Blaze a Trail in Advanced Analytics
For eight years now, Gartner has been issuing a Magic Quadrant (MQ) for business intelligence. The rise of advanced analytics has been so strong and sustained that the analyst firm has split off that portion of BI into its own MQ.
Until now, Gartner's review has tended to focus on the traditional query and reporting capabilities of the various BI vendors. But as data visualization, predictive and prescriptive analysis have risen in popularity and sophistication, there has been a tendency for organizations to deploy multiple tools, for example a full-fledged business intelligence platform from an established vendor supplemented by analytics tools from a startup.
Gartner defines advanced analytics as: “the analysis of all kinds of data using sophisticated quantitative methods (for example, statistics, descriptive and predictive data mining, simulation and optimization) to produce insights that traditional approaches to business intelligence (BI) — such as query and reporting — are unlikely to discover.”
The Magic Quadrant for Advanced Analytics Platforms seems to show companies frequently look to companies other than the traditional BI vendors for advanced analytics capabilities.
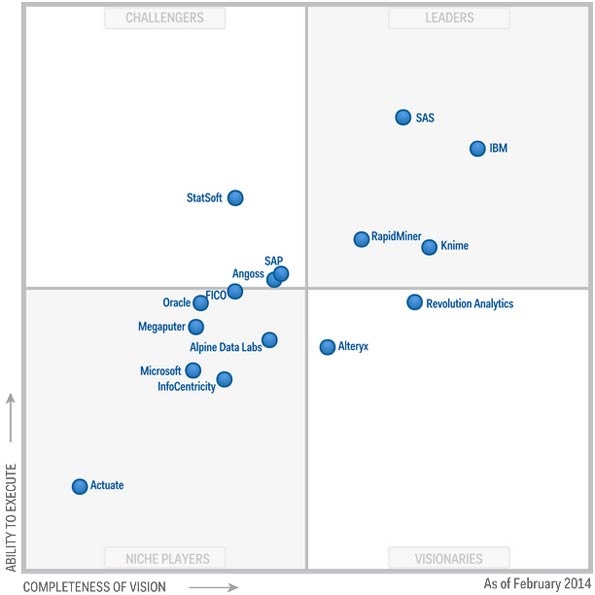
The top right “Leaders” quadrant includes just two veteran vendors: SAS and IBM. The other two are open source newcomers and relative unknowns RapidMiner and Knime. Another open source provider, Revolution Analytics, is on the cusp of joining them. Notable omissions are Oracle, SAP and Microsoft, who Gartner does not include in either the “Leaders” or “Visionaries” quadrants.
Open Source Analytics
Gartner analyst Gareth Herschel describes RapidMiner (it used to be known as Rapid-I) as an open-source client/server-based tool that is also available in a commercial version. It enables users to work on larger datasets and connect to many data sources, and it can integrate with other open-source tools such as R and Weka.
“RapidMiner's all-in-one tool for data integration, analysis and visualization provides strong support for the analysis of structured and unstructured data, as well as user support built directly into the tool based on the best practices of practitioners,” said Dr. Ingo Mierswa, RapidMiner's CEO and founder.
Mierswa added that revenues have been growing up to 300 percent per year since 2011. The company counts 500 enterprise customers, including Lufthansa, PayPal, Pepsi, Siemens and Volkswagen, among its base of more than 200,000 active users. Pricing varies but starts at less than $100 a month.
“Business users are shifting their thinking and changing their mindset to focus on what will happen, not on what has already happened,” Mierswa said. “This new predictive thinking is what is powering the growth of the sector.”
Mierswa is also quick to point out the benefits of being backed up by the open source community.
“The massive community backing the RapidMiner platform provides some of its biggest benefits. We have approximately a quarter million users crowd-sourcing new innovative algorithms and adding them to the platform,” he said. “Moreover, every user can opt in to share anonymized workflows with other users and benefit directly from the best practices of other experts.”
While Gartner had plenty of praise for RapidMiner, it also offered some cautions. Herschel and his team felt that it did not have high visibility in the market outside the data mining community. The report also mentions some difficulties in moving users from the free to the commercial version and weaknesses in areas such as project management.
Mierswa candidly answered that these are areas the company is striving to fix. A recent round of funding, for instance, is being spent on sales and marketing to help increase visibility and convert more users to the commercial version. (The commercial version allows users to work on larger datasets and includes Web-based reporting, model management, greater collaboration and more flexible deployment options.)
Joining RapidMiner in the top quadrant is Knime. Like its counterpart, Knime offers both a free version (desktop-based) as well as a commercial (server-based) advanced analytics platform. The latter comes in on-site or cloud versions.
Just out of the top quadrant, Revolution Analytics provides Revolution R Enterprise 7 (RRE 7). Powered by open source R, it includes a library of Big Data-ready algorithms with a “write once deploy anywhere” capability that enables users to harness the computational power of data management platforms like Hadoop and second-generation enterprise data warehouses for predictive analytics.
David Smith, chief community officer at Revolution Analytics, said that traditional enterprise tools struggle to match the open-source community's ability to innovate, iterate and evolve rapidly.
Gartner, though, noted a few issues with Revolution's approach. These mainly revolve around the fact that the R language can be difficult to use, unless you are a data scientist or a recent graduate already trained in it. Revolution Analytics' solution is to partner with companies that specialize in business intelligence and business analyst applications, which provide a simpler front-end for the custom analytics developed by data scientists in R.
“Our integration with Alteryx — the other Visionary in the Magic Quadrant — is an example, which provides a simple drag-and-drop interface to business analysts, all the while replicating investment in data science across the organization,” said Smith.
Old Guard Analytics Evolves
This new wave of open-source companies doesn't command the quadrant. In fact, Gartner still has them trailing heavyweights SAS and IBM. Gartner praised IBM for making predictive analytics accessible to multiple user types and skill levels, and also lauded its Watson initiative, speed of development and customer satisfaction. Integration issues between different analytics tools, ease of use and responsiveness to user needs were cited as negatives.
Gartner felt SAS had the widest product stack in the industry, only rivaled by the open-source programming environment R. Additionally, the analyst firm gave it high marks for listening to customers, quality and user satisfaction. On the downside, its challenges include a fragmented product stack, complexity, upgrade hassles and cost.
Malene Haxholdt, global analytics marketing manager for SAS, answered the Gartner cautions by arguing that SAS is not working in a “one size fits all” market, but one in which users range from a basis business analyst all the way to the data scientist or statistician. “Their needs are different, and therefore they most likely would prefer different user interfaces even if they are both playing with a regression analysis,” she said.
The company caters to these different needs by offering the less technical users easy access to different analytical capabilities through SAS Visual Analytics and its point-and-click interface. The more savvy, however, might prefer access to self-coding.
Haxholt said SAS is addressing the explosion of interest in advanced analytics on several fronts, including assisting educational institutions in building analytics programs and putting more emphasis on ease of use. The company is also developing more software that works with the fast-growing Big Data architecture Hadoop. A Hadoop product will be released later this year.
More Than One Analytics Answer
Herschel doesn't believe the future in this space lies in a company choosing between one vendor and another in an all-or-nothing proposition. Organizations adopt advanced analytics in several different ways, he pointed out. Some prefer to harness an advanced analytics platform, while others outsource the function to service providers like Accenture, Mu Sigma or Opera Solutions, and still others gravitate to tools aimed at their own specific industry vertical.
“Organizations should think of multi-sourcing advanced analytic capability,” he said. “Some will come from platforms (such as those in the Magic Quadrant), some will come from service providers and some will come from the purchase of vertical analytic applications.”
Drew Robb is a freelance writer specializing in technology and engineering. Currently living in California, he is originally from Scotland, where he received a degree in geology and geography from the University of Strathclyde. He is the author of Server Disk Management in a Windows Environment (CRC Press).

Drew Robb is a writer who has been writing about IT, engineering, and other topics. Originating from Scotland, he currently resides in Florida. Highly skilled in rapid prototyping innovative and reliable systems. He has been an editor and professional writer full-time for more than 20 years. He works as a freelancer at Enterprise Apps Today, CIO Insight and other IT publications. He is also an editor-in chief of an international engineering journal. He enjoys solving data problems and learning abstractions that will allow for better infrastructure.