
iPhone Usage Statistics 2024 By Region, Market Share, App Retention and Demographics
Page Contents
- Introduction
- Editor’s Choice
- What is an iPhone?
- Apple iPhone Models
- General iPhone Usage Statistics
- By Country
- By Region
- By App Retention
- By Market Share
- By Demographics
- By Leading Apps
- By Model Prices
- A 10-Years Analysis of iPhone Usage Statistics by Total Users
- By Depreciation Value in 5G enabled iPhone
- iPhone Usage Statistics by Factors Affecting Purchase Decision
- By iOS Version Compatibility
- By Shipped Smartphones in 2023 and 2022
- Smartphone Brand Awareness in the USA
- Smartphone Brand Ownership Ranking in the USA
- Conclusion
Introduction
iPhone Usage Statistics: Apple is the leading smartphone producer in the world. However, with some upgrading technology, it is not only limited to smartphones but has other products such as wearables, laptops, PCs,iPads, and much more. Samsung is the toughest competitor for Apple, and it is also offering similar features enabled smartphones with almost pocket-friendly pricing plans. These two players are currently dominating the smartphone industry.
These iPhone Usage Statistics show the overall performance of the brand in 2023. Tell us which iPhone model you love and why.
Editor’s Choice
- As of 2023, the trending app category in the App Store is Navigation with a 104.5% conversion rate.
- iPhone Usage Statistics by App Retention 2023, show that the majority of iPhones keep recently downloaded apps on their phones only for 24 hours resulting in 25.6%
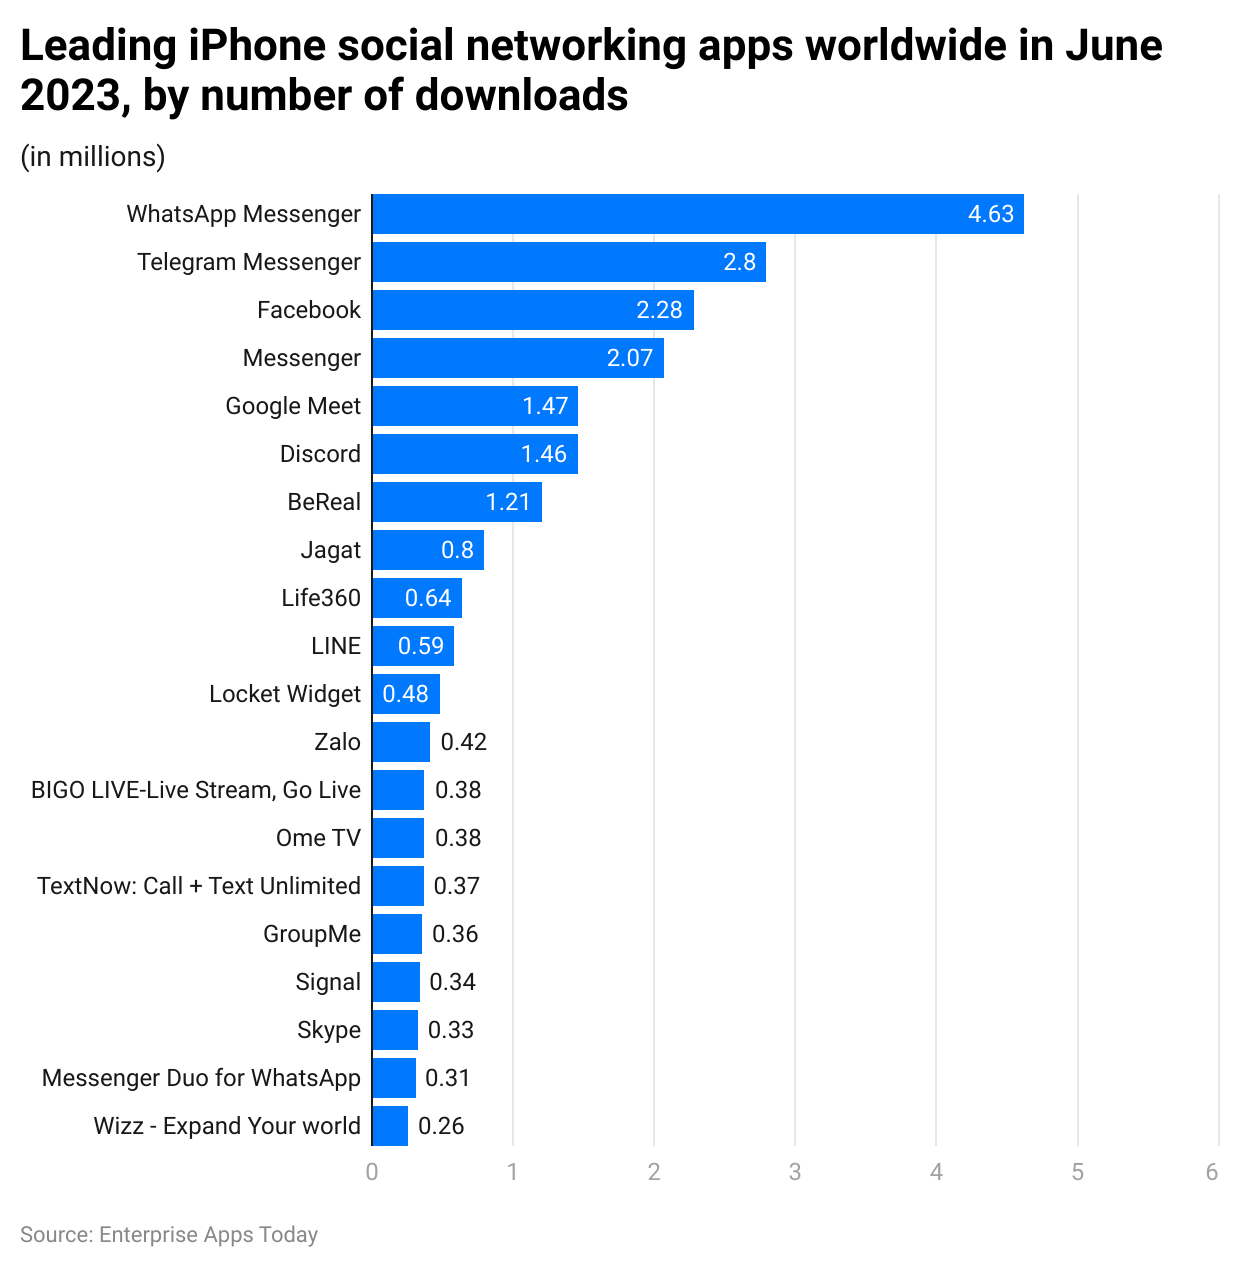
- As of June 2023, WhatsApp Messenger has 4.63 million downloads on iPhones around the world in the social networking apps category.
- A study of iPhone users suggested that they are more likely to spend money on paid apps as compared to Android users.
- In the United States of America, iOS has captured the majority of the market at 57.93% while Android has 41.64%.
- As of today, the iPhone 6 is the third most-sold Apple phone in history with around 222.4 million units sold.
- As of November 2023, the majority of the market share of the iOS version is captured by iOS 16.6 resulting in 31.51%.
- Similar to other iPhone Usage Statistics by demographics, the iPhone has low participation of users aged 35 and above as compared to Android users.
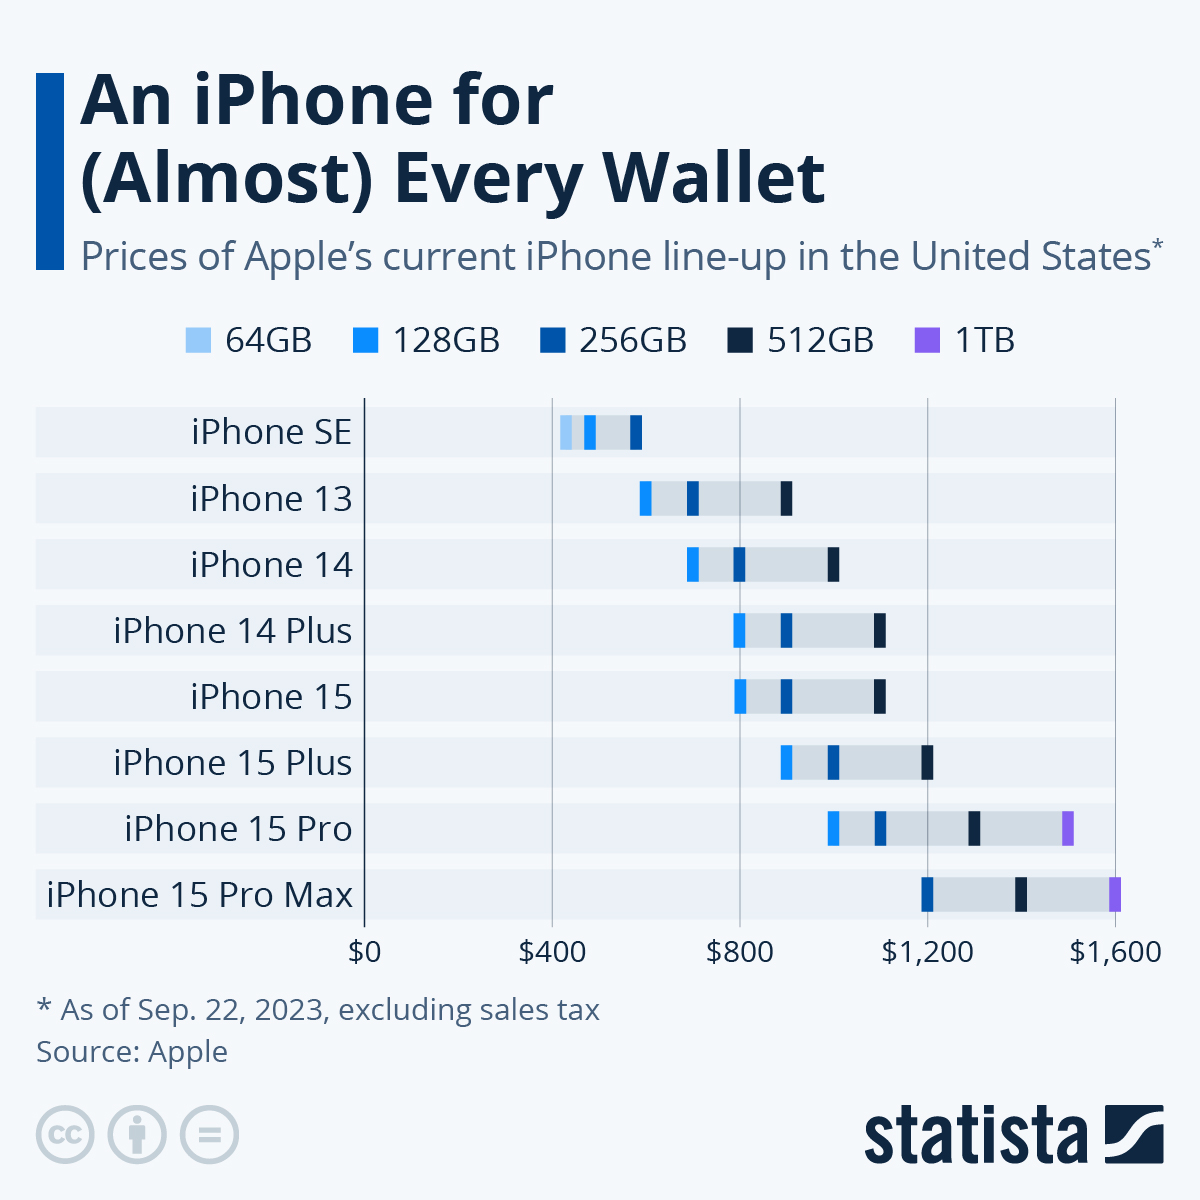
- All models of the iPhone are priced at more than $400. However, iPhone 15 Pro Max is the priciest iPhone of all models with a starting price of $1,200 to $,1600 depending on the storage capacity.
- Users between 18 to 34 years are highest in the case of iPhone resulting in 58% and Android (41%).
What is an iPhone?
IPhone is the a line of smartphones manufactured by Apple, Inc. The iPhone runs only with the iOS mobile operating system. The first ever Phone was launched in 2007. Since then, Apple has been successfully launching various models of iPhones with more impressive features with each model.
Unlike other brands, Apple releases models in multiple series, such as Pro Max, Max, Mini, etc. This provides consumers with a suitable size of the phone to choose from. Today, Apple, Inc. has become a world leader in smartphone brands. Following are the details of iPhone models including discontinued series.
Apple iPhone Models
| Models | Launched | Discontinued as of December 2023 |
| iPhone | 2007 | 2008 |
| iPhone 3G | 1008 | 2010 |
| iPhone 3GS | 2009 | 2012 |
| iPhone 4 | 2010 | 2013 |
| iPhone 4s | 2011 | 2014 |
| iPhone 5 | 2012 | 2013 |
| iPhone 5c | 2013 | 2015 |
| iPhone 5s | 2013 | 2015 |
| iPhone 5s | 2013 | 2016 |
| iPhone 6 | 2014 | 2016 |
| iPhone 6 Plys | 2014 | 2016 |
| iPhone 6s | 2015 | 2018 |
| iPhone 6s Plus | 2015 | 2018 |
| iPhone SE (1st generation) | 2016 | 2018 |
| iPhone 7 | 2016 | 2019 |
| iPhone 7 Plus | 2016 | 2019 |
| iPhone 8 | 2017 | 2020 |
| iPhone 8 Plus | 2017 | 2020 |
| iPhone X | 2017 | 2020 |
| iPhone XR | 2018 | 2019 |
| iPhone XS | 2018 | 2019 |
| iPhone XS Max | 2018 | 2019 |
| iPhone 11 | 2019 | 2022 |
| iPhone 11 Pro | 2019 | 2020 |
| iPhone 11 Pro Max | 2019 | 2020 |
| iPhone SE (2nd generation) | 2020 | 2022 |
| iPhone 12 | 2020 | 2023 |
| iPhone 12 mini | 2020 | 2022 |
| iPhone 12 Pro | 2020 | 2021 |
| iPhone 12 Pro Max | 2020 | 2021 |
| iPhone 13 | 2021 | 2023 |
| iPhone 13 mini | 2021 | 2023 |
| iPhone 13 Pro Max | 2021 | 2022 |
| iPhone SE (3rd generation) | 2022 | Not applicable |
| iPhone 14 | 2022 | Not applicable |
| iPhone 14 Plus | 2022 | Not applicable |
| Iphone 14 Pro | 2022 | 2023 |
| iPhone 14 Pro Max | 2022 | 2023 |
| iPhone 15 | 2023 | Not applicable |
| iPhone 15 Plus | 2023 | Not applicable |
| iPhone 15 Pro | 2023 | Not applicable |
| iPhone 15 Pro Max | 2023 | Not applicable |
(Source: wikipedia.org)
General iPhone Usage Statistics
- According to iPhone Usage Statistics 2023, the worldwide iOS market is less than Android resulting in 28.99% and 70.29% respectively.
- On the other hand, in the United States of America, iOS has captured the majority of the market at 57.93% while Android has 41.64%.
- According to the iPhone Usage Statistics, 95% of the apps on the App Store are free of charge while only 5% are paid.
- Furthermore, a study of iPhone users suggested that they are more likely to spend money on paid apps as compared to Android users.
- Moreover, iPhone Usage Statistics show that users are more likely to spend $12.77 per app on average.
- As of 2023, the trending app category in the App Store is Navigation with a 104.5% conversion rate.
- In 2023, there will be more than 1.6 billion iPhone users across the world.
- However, the majority of them are located in the United States of America alone resulting in 135.97 million.
- As of today, the iPhone 6 is the third most sold Apple phone in history with around 222.4 million units sold.
- 10% of iPhone users own Apple watches.
- In Q2 of 2023, worldwide Apple iPhone contributed a total of 42.5 million units in sales.
- Furthermore, as of 2022, Apple’s smartphone market share around the globe was 18.8%.
- In Q4 of 2023, iPhone total sales revenue around the globe resulted in $43.8 billion.
- As of 2022, Google is the most popular non-gaming iPhone App publisher, whereas X-Hero was the leading gaming app by downloads worldwide.
- As of 2023, around 1.7 million apps were priced less than $1 in the App Store.
- As of today, Apple has sold more than 2.43 billion iPhones around the world.
- As of 2022, Americans are reported to be using the most iPhones for the first time.
- According to reports, country-wise allocation of iPhone ownership shows that most users are located in China.
- On average, a user spends 40 hours on his iPhone per week which is similar to 40 hours of work week.
- “No Location Found” is the highest-ranking issue faced by iPhone users.
- iPhone has an average lifespan of 4 years.
- iPhone is the most owned Apple device by 88% of owners, followed by iPad (73%), Apple Watch (58%), and Mac laptop/ desktop (50%).
- 60% of Apple users own at least 3 to 4 Apple devices, out of which 59% are iPhone users.
- According to iPhone Usage Statistics, only 24% of iPhones are sold directly by Apple itself.
- Per minute apple users around the globe download 51 apps, making it 26,805,600 apps a year.
- In 2023, Apple generated $43.81 billion in revenue just from selling iPhones around the world.
- According to studies, the younger generation is more likely to purchase recently launched iPhones.
- According to reports, the iPhone 15 Pro Max has more carbon emissions than as compared to other iPhones during its life cycle resulting in 75 kilograms of carbon emissions.
By Country
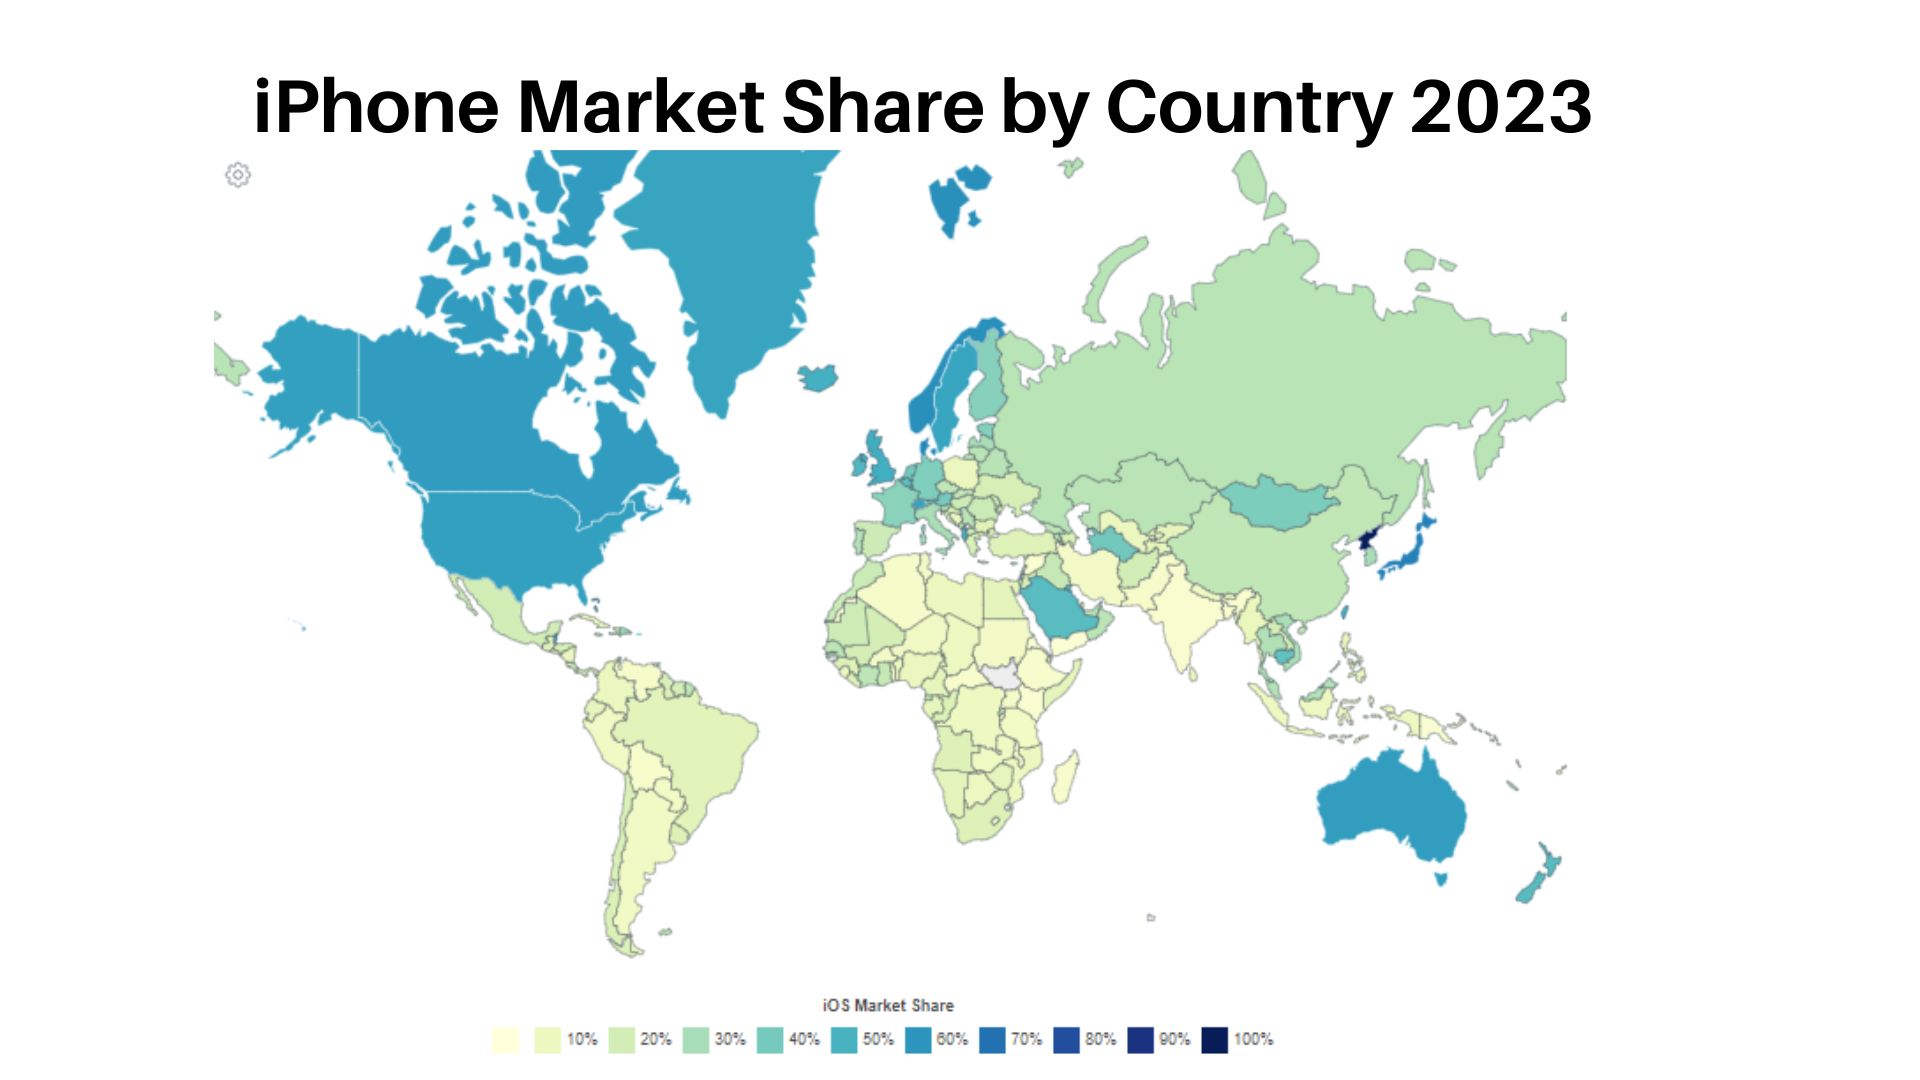
(Source: worldpopulationreview.com)
According to the above iPhone Usage Statistics by region, North Korea has the highest iOS market share in 2022, resulting in 99.49%, followed by Tokelu (95.44%), and Bermuda (92.32%). However, countries with the least iPhone users in 2022 were Eritrea (2.57%), Yemen (2.17%), and Western Sahara (1.6%).
By Region
Below is the table showing the iPhone’s Market share in Different regions of the World:
| Region | iPhone Market Share |
|---|---|
| Worldwide | 27.6% |
| North America | 54.76% |
| South America | 14.33% |
| Asia | 15.94% |
| Europe | 35.84% |
| Oceania | 55.55% |
| Africa | 14.18% |
(Source: demandsage.com)
- Globally, about 27.6% of smartphone users have an iPhone.
- In North America, more than half of the people with smartphones, 54.76%, use an iPhone.
- In South America, a smaller number, 14.33%, use iPhones.
- Asia has a similar number to South America, with 15.94% using iPhones.
- Europe has more iPhone users, 35.84%, which is more than one-third of smartphone users.
- Oceania has the highest number of iPhone users, 55.55%, more than half.
- Africa has the lowest number, almost the same as South America, with 14.18% using iPhones.
By App Retention
| Timeframe | iPhone App Retention Rate | Android App Retention Rate |
| Day 1 | 25.6% | 22.6% |
| Day 3 | 13.7% | 10.6% |
| Day 7 | 9.4% | 6.5% |
| Day 14 | 6.7% | 4.3% |
| Day 21 | 4.3% | 2.6% |
(Source: explodingtopics.com)
iPhone Usage Statistics by App Retention 2023, show that the majority of iPhones keep recently downloaded apps on their phones only for 24 hours resulting in 25.6% which is almost similar to the Android retention rate. In addition, other users showed the retention rate for iPhone as follows 3 Days (13.7%), 7 Days (9.4%), 14 days (6.7%), and 21 days (4.3%).
By iOS Version
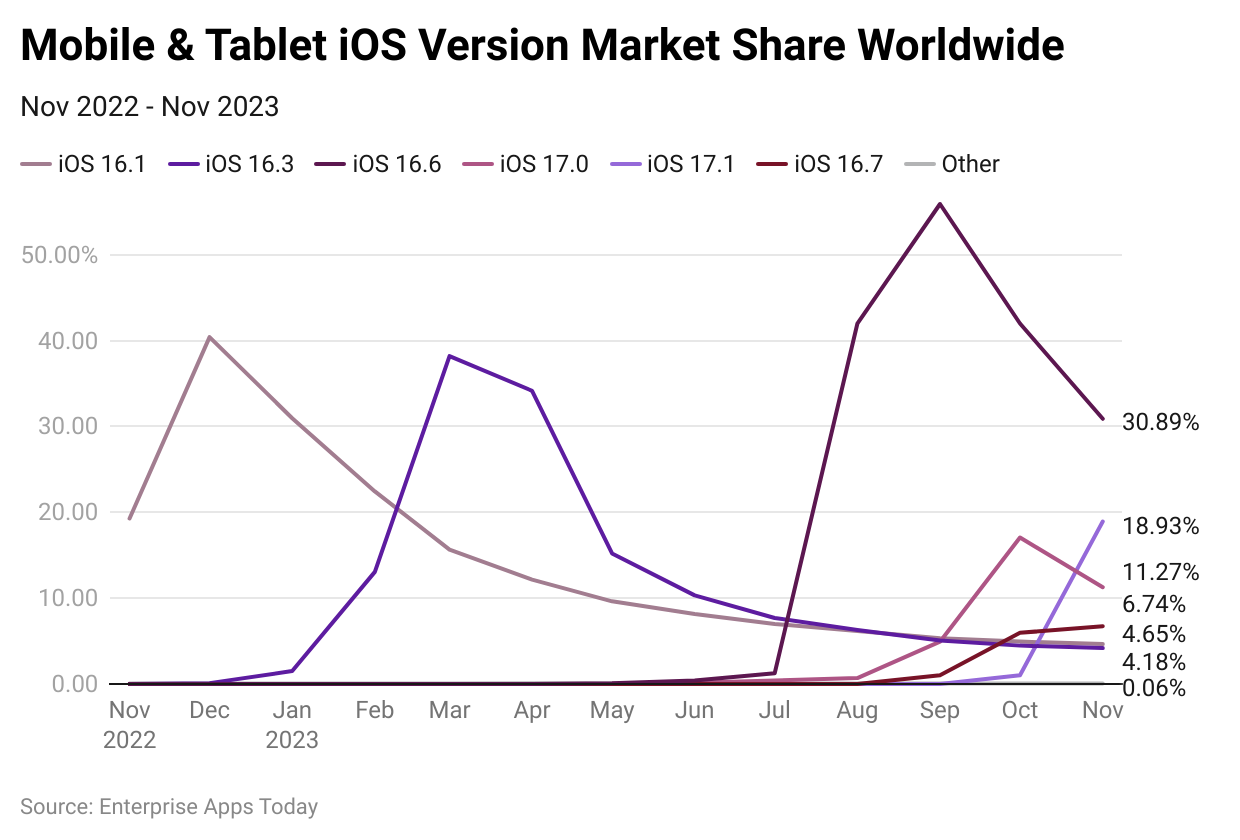
(Source: statcounter.com)
As of November 2023, the majority of the market share of the iOS version is captured by iOS 16.6 resulting in 31.51%. The iOS Version with the lowest market share as of today is 4.18%. iOS 17.1 has a comparatively growing share in 2023 resulting in 17.98%.
By Operating System
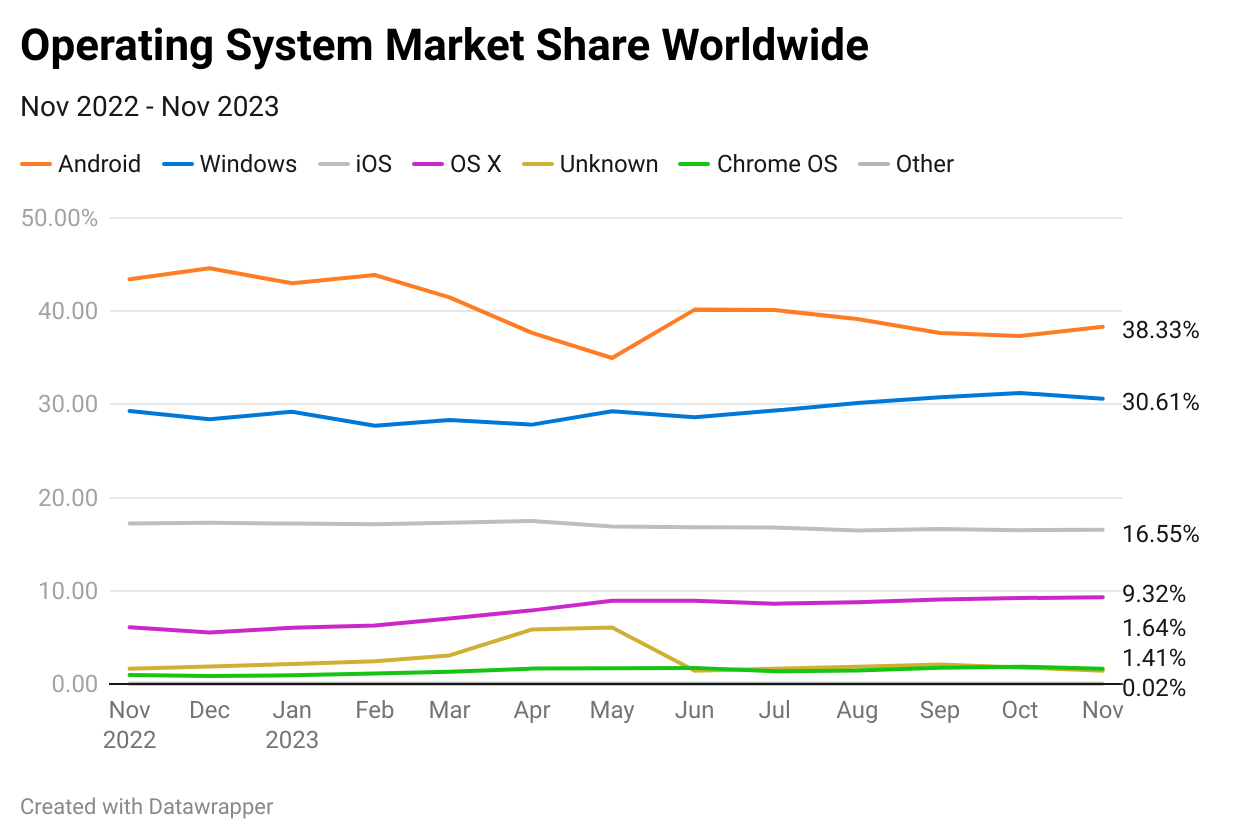
(Source: statcounter.com)
As of November 2023, the top three operating systems leading the market are Android (38.27%), Windows (30.6%), and iOS (16.54%). Compared to other OS Linux has only 1.44% of worldwide market share.
By Demographics
By Gender
iPhone vs Android users by gender worldwide:
| Gender | iPhone | Android |
| Male | 28% | 60% |
| Female | 31% | 54% |
(Source: explodingtopics.com)
As of 2023, global iPhone Usage Statistics show that there are more female iPhone users compared to males resulting in 31% and 28% respectively. However, gender-wise users state that Android has more users resulting in males (60%) and females (54%).
By Generation
iPhone vs Android users by age worldwide
| Age | iPhone | Android |
| Gen Z | 31% | 57% |
| Millennial | 35% | 55% |
| Gen X | 22% | 60% |
| Baby Boomer | 23% | 55% |
(Source: explodingtopics.com)
Compared to Android users around the globe, iPhone users are smaller in numbers. However, considering the generation-wise bifurcation, millennials contribute the highest percentage of users resulting in 35%, followed by Gen Z (31%), Baby Boomers (23%), and Gen X (22%).
By Age
iPhone vs Android users by age, United States
| Age | iPhone | Android |
| 18-34 | 58% | 41% |
| 35-54 | 47% | 53% |
| 55 and older | 49% | 51% |
(Source: explodingtopics.com)
Similar to other iPhone Usage Statistics by demographics, the iPhone has low participation of users aged 35 and above as compared to Android users. However, users between 18 to 34 years are highest in the case of iPhone resulting in 58% and Android (41%).
By Leading Apps
By Social Networking Apps
(Source: statista.com)
As of June 2023, WhatsApp Messenger has 4.63 million downloads on iPhones around the world in the social networking apps category. Other top-ranking apps for iPhone were Telegram Messenger – 2.8 million, Facebook – 2.28 million, Messenger- 2.07 million, and Google Meet 1.47 million.
By Free Apps
Here is a list of the Most Downloaded free iPhone Apps in 2022 and June 2023
| Rank | 2022 | June 2023 |
|---|---|---|
| 1. | Tik Tok | |
| 2. | Youtube | CapCut – Editor De Video |
| 3. | ICOCA | |
| 4. | Snapchat | ChatGPT |
| 5. | TikTok | |
| 6. | Messenger | WhatsApp Messenger |
| 7. | Google maps | YouTube |
| 8. | Gmail | |
| 9. | Zoom | Google Chrome |
| 10. | Amazon Shopping | TikTok – Global Video Community |
(Source: demandsage.com)
Comparing the list of most downloaded free iPhone apps in 2022, there is a vast difference in the rank. The apps that were in the top 5, were seen in the below-ranked numbers such as YouTube, TikTok, and Instagram. Whereas, Google, CapCut – Editor De Video and ICOCA are the top three free leading apps as of 2023.
By Model Prices
(Source: statista.com)
All models of the iPhone are priced at more than $400. However, iPhone 15 Pro Max is the priciest iPhone of all models with a starting price of $1,200 to $,1600 depending on the storage capacity. iPhones with less than 512GB are comparatively affordable models for everyone that includes, iPhone SE, iPhone 13, and iPhone 14.
A 10-Years Analysis of iPhone Usage Statistics by Total Users
(Source: statista.com)
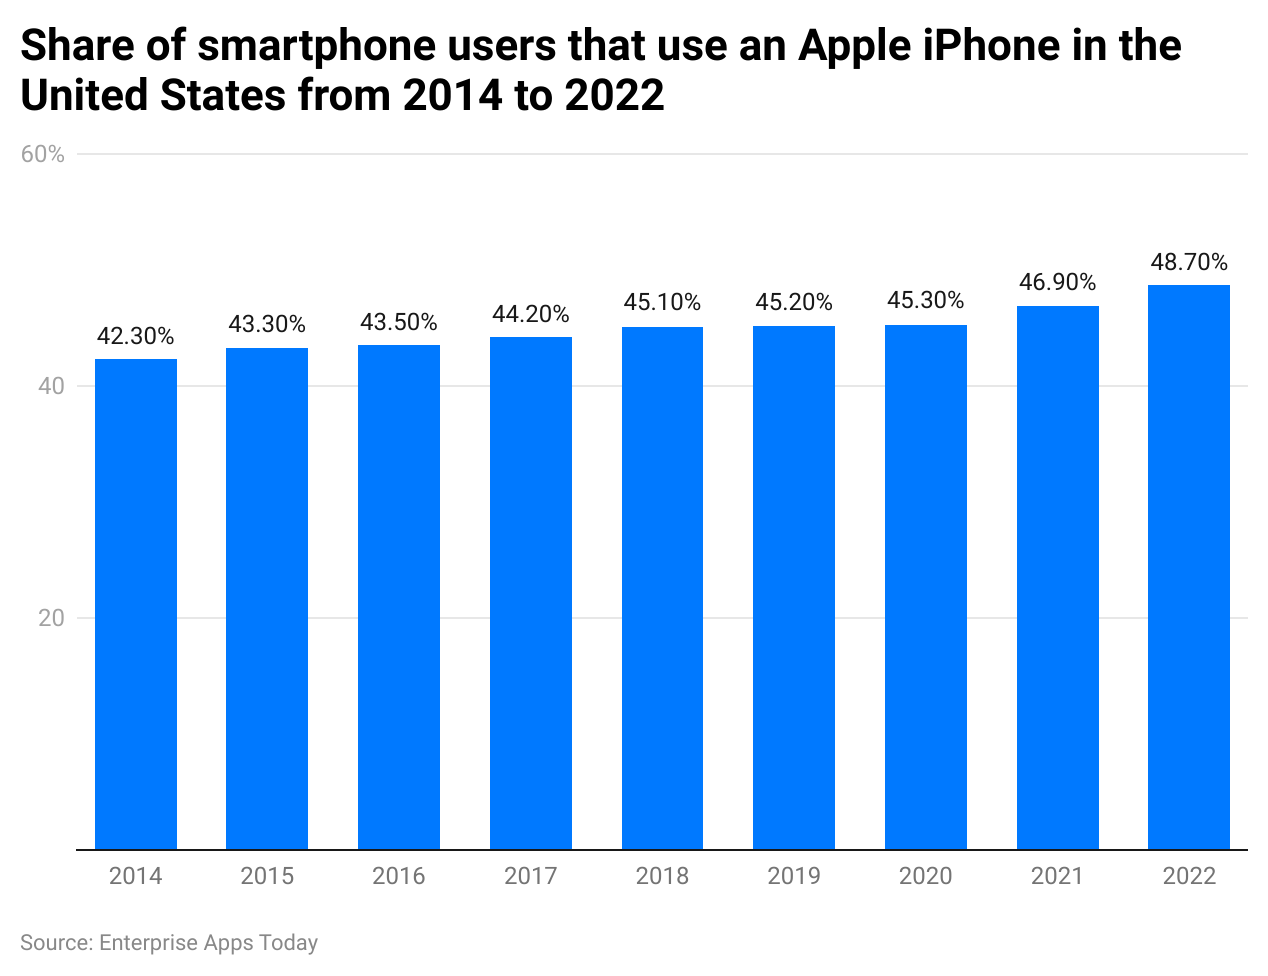
Looking at the above chart, iPhone Usage Statistics show that, the percentage of users in the United States of America has comparatively been stagnant over the past few years. Considering the brand, every year, it has seen only a percent growth in total users till 2022.
By Depreciation Value in 5G enabled iPhone
As of September 2023, the top 3 iPhone models with the highest depreciation value since launch are iPhone SE 2nd Gen (2020) 64 GB (75.7%), iPhone SE 2nd Gen (2020) 128 GB (73.1%), and iPhone SE 2nd Gen (2020) 256 GB (72.5%).
On the other hand, the models with the least depreciation values are iPhone 14 Pro (2022) 128 GB (38.3%), iPhone 14 Pro Max (2022) 128 GB (36.1%), and iPhone 14 Pro Max (2022) 256 GB (33.1%).
iPhone Usage Statistics by Factors Affecting Purchase Decision
(Source: statista.com)
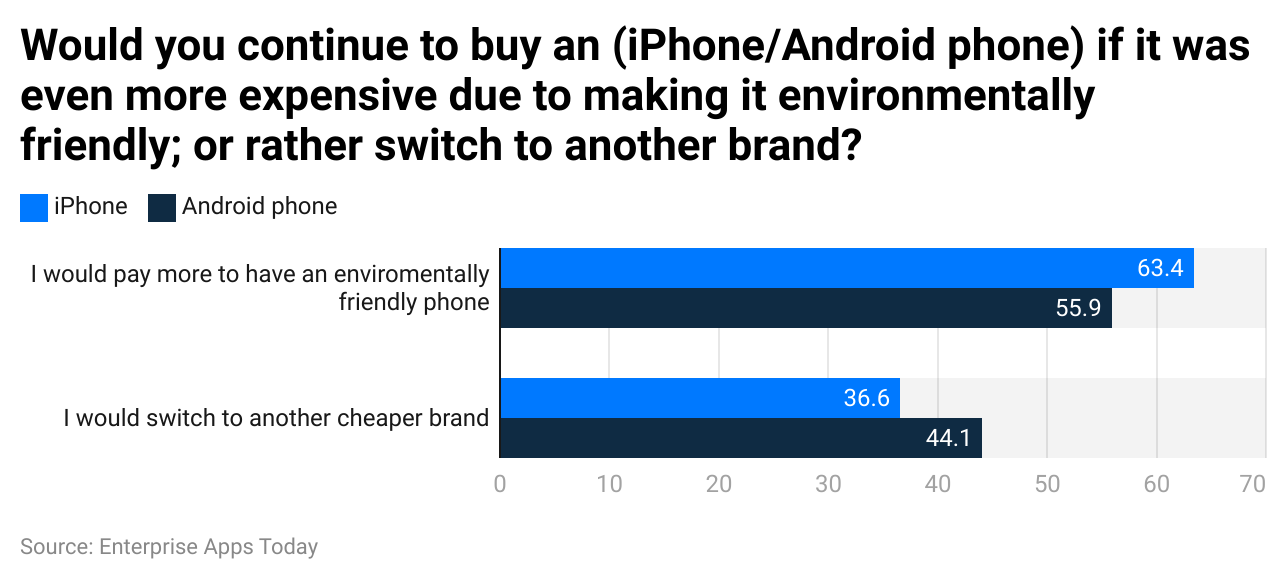
As of 2023, in the United States of America, iPhone users are more comfortable purchasing high-priced iPhone even if it is environmentally friendly resulting in 63.4% compared to Android users resulting in 55.9%.
On the other hand, 44.1% of Android and 36.6% of iPhone users said they would choose a cheaper brand.
By iOS Version Compatibility
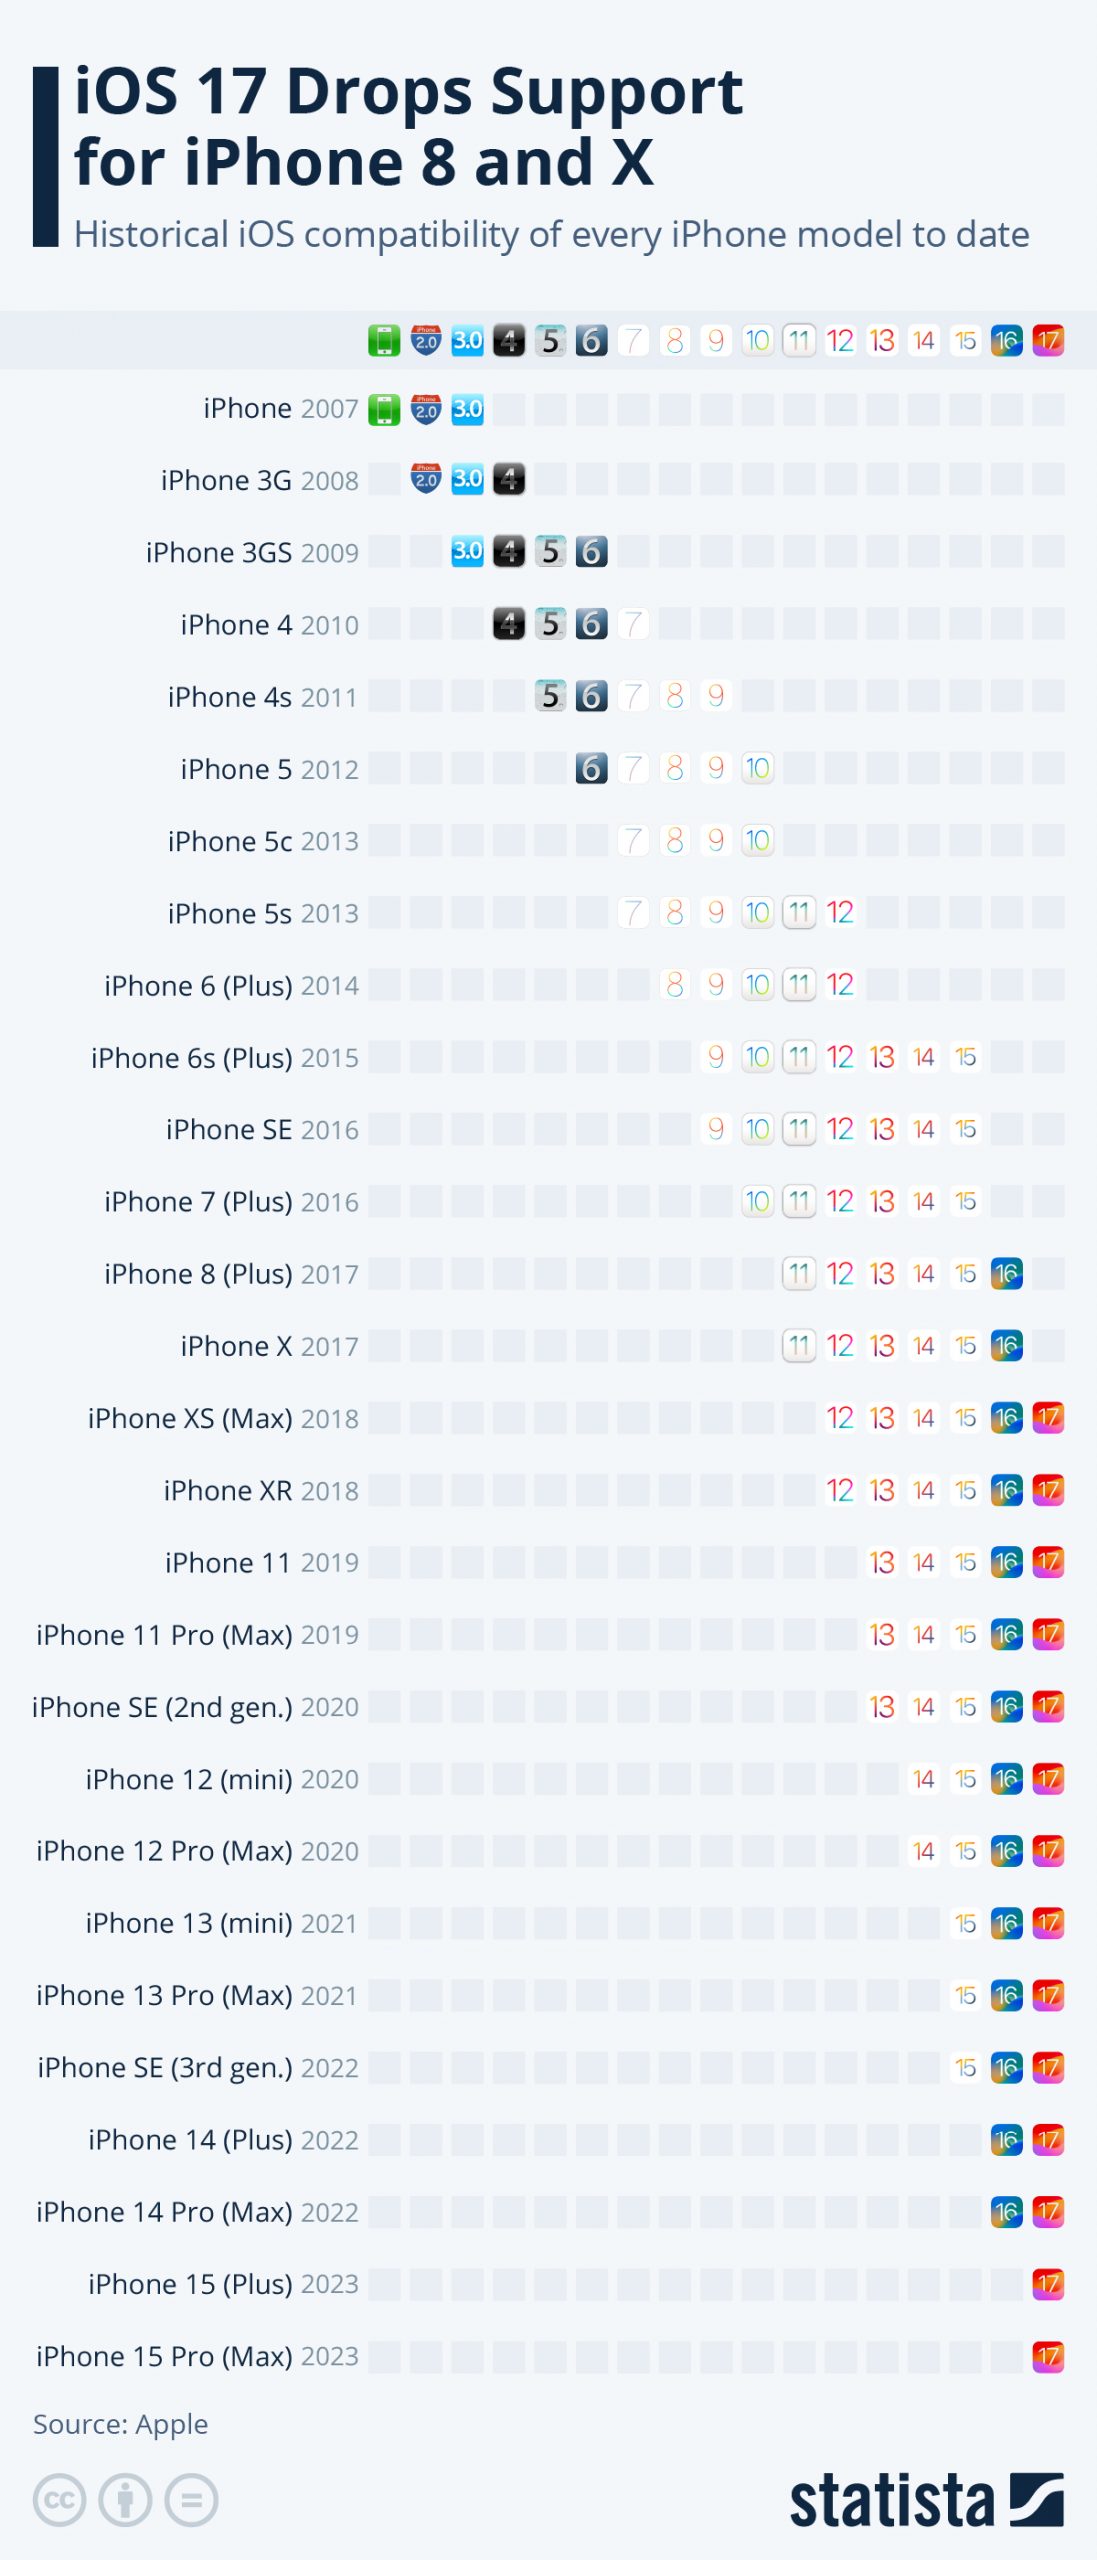
(Source: statista.com)
By Shipped Smartphones in 2023 and 2022
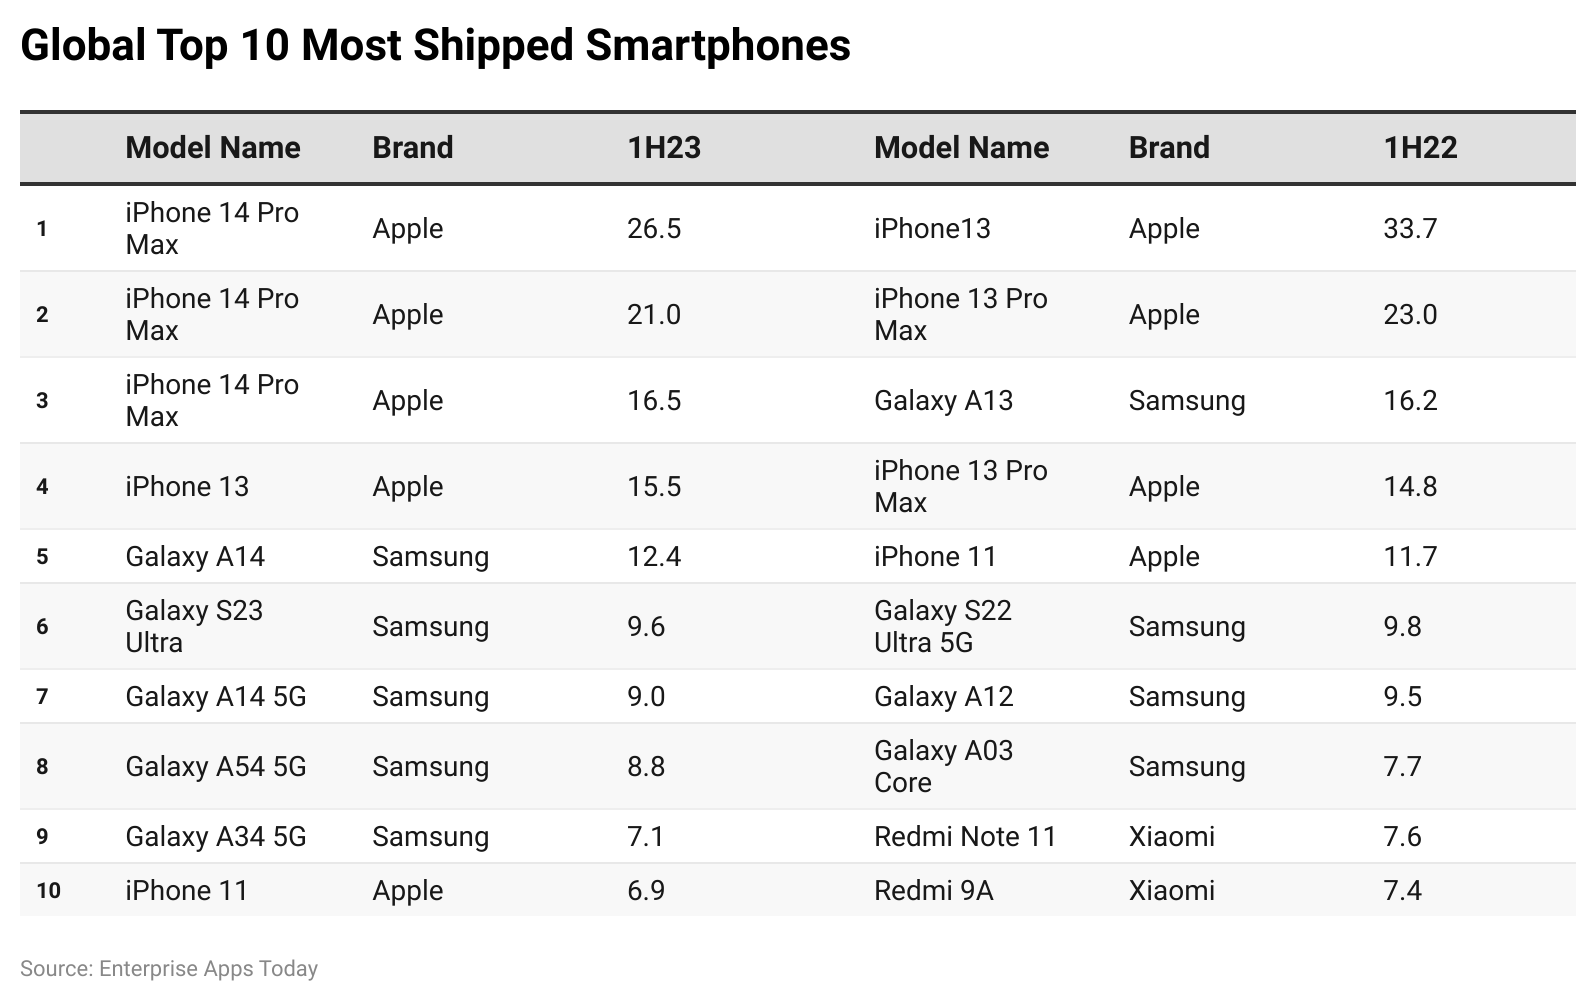 (Source: forbes.com)
During the first half of 2023, the iPhone 14 Pro Max recorded the highest number of shipped smartphones around the world, resulting in 26.5 million, followed by the iPhone 14 Pro (21 million) and iPhone 14 (16.5 million). Moreover, in 2022, the iPhone 13 and iPhone 13 Pro Max generated 33.7 million and 23 million shipments.
Smartphone Brand Awareness in the USA
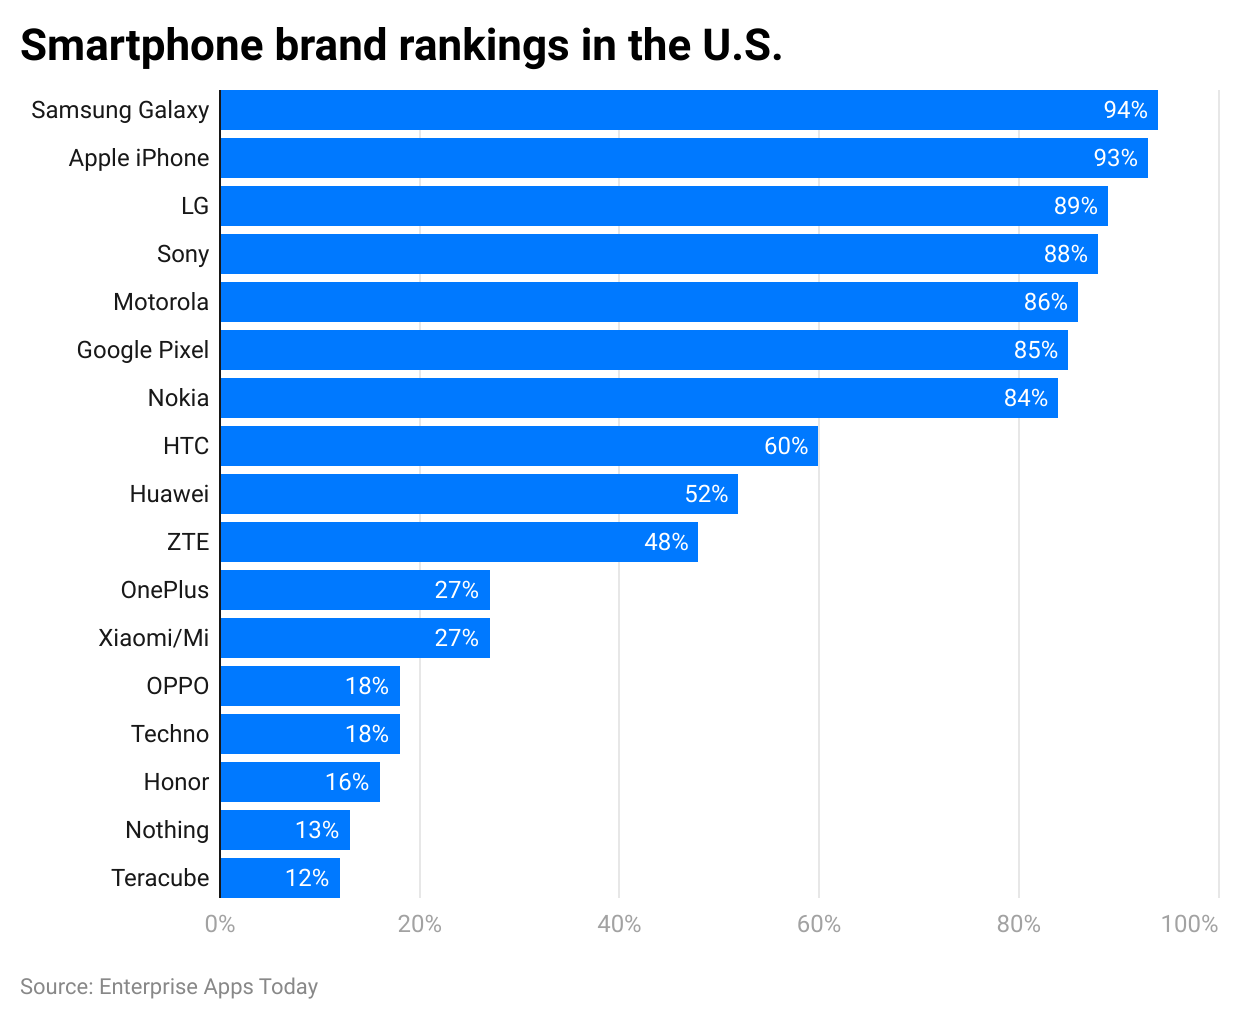
(Source: statista.com)
As of October 2023, the top 3 companies with the highest brand awareness in the United States of America are Samsung Galaxy (94%), Apple iPhone (93%) and LG (89%). However, Honor, Nothing, and Teracube have the least brand recognition in the country resulting in 16%, 13%, and 12%.
Smartphone Brand Ownership Ranking in the USA
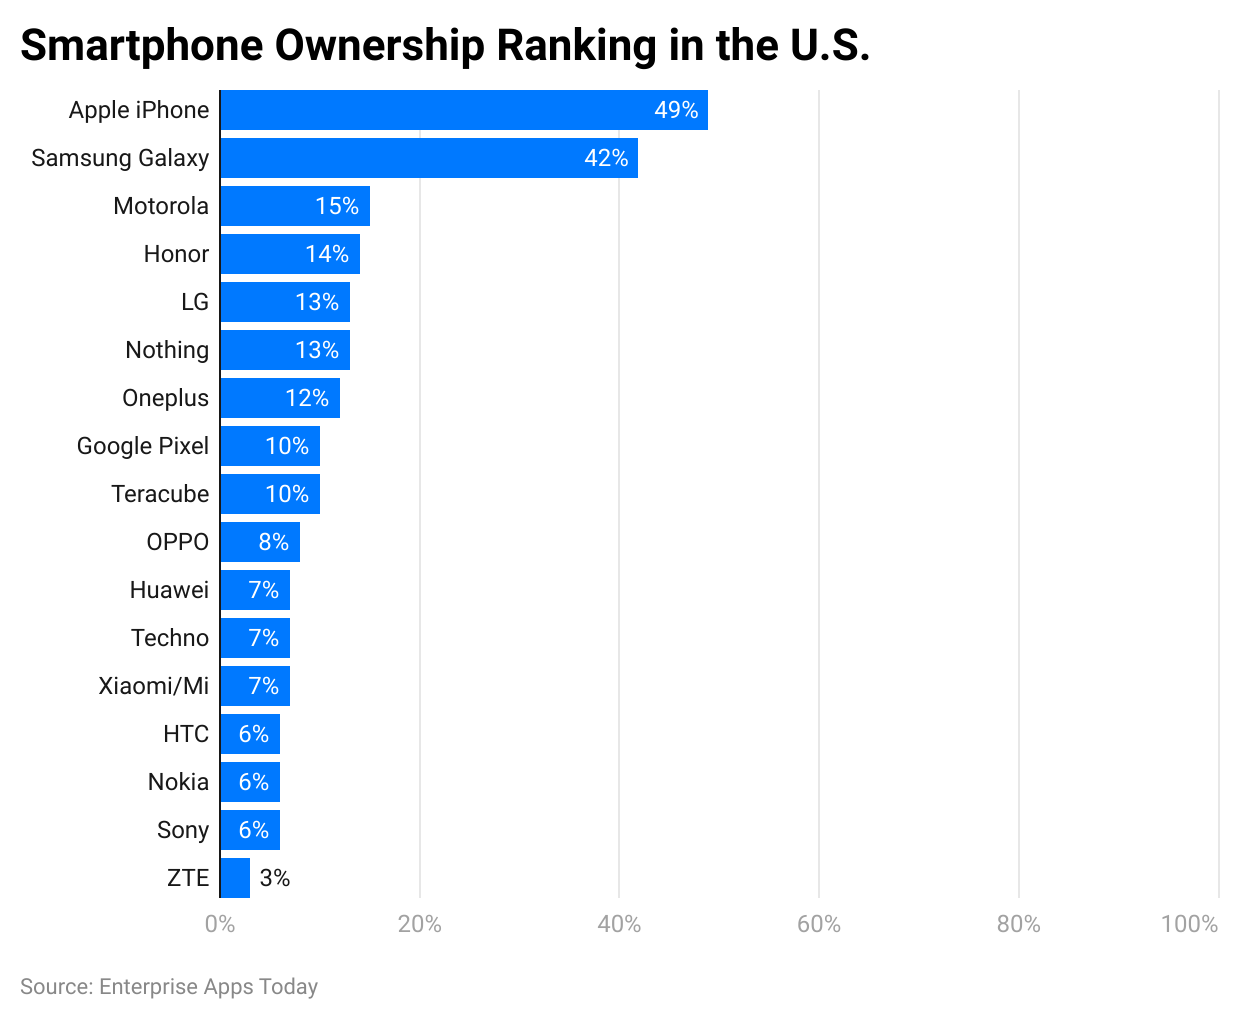
(Source: statista.com)
According to iPhone Usage Statistics, half of the users who own smartphones, are using Apple iPhones resulting in 49% in October 2023. Samsung Galaxy is the second most owned brand contributing by 42%. Apple and Samsung are major players in the market while others are growing brands such as Motorola, Honor, LG, Nothing, OnePlus, etc, all of which with less than 20 of ownership in the USA.
Conclusion
These iPhone Usage Statistics confirm the popularity of the Apple brand. Since its launch, it has gained better brand awareness because of its camera and other features on the smartphone. Apple products are said to be the most secure devices from any attacks. These smartphones can understand the user in a way that it is a person. Apple has a strategy to launch a new series of iPhones each year which is making technology lovers upgrade their phones continuously. Looking at these insights, Apple has a bright future!
FAQ.
As of 2023, the iPhone SE (3rd generation) is the cheapest iPhone to buy which costs $429.
According to PCMAG iPhone 15 Pro Max is the overall best-rated iPhone till today.

Barry is a lover of everything technology. Figuring out how the software works and creating content to shed more light on the value it offers users is his favorite pastime. When not evaluating apps or programs, he's busy trying out new healthy recipes, doing yoga, meditating, or taking nature walks with his little one.