
Workplace Injury Statistics – By Demographics, Causes, Direct costs, Most Expensive Worker Injuries
Page Contents
- Introduction
- Editor’s Choice
- What is Workplace Injury?
- Reasons why Workplace Injury Occurs
- General Workplace Injury Statistics
- Workplace Injury Statistics by Demographics
- Statistics by Direct Costs of Workplace Injuries in 2022
- Statistics by Most Expensive Worker Injuries in 2023
- Workplace Injury Statistics by Causes
- Top 10 Causes of Most Disabling Workplace Injuries in the USA in 2022
- Top 5 occupations with all-time Highest Number of Workplace Deaths
- Top 5 occupations with all-time Lowest Number of Workplace Deaths
- Conclusion
Introduction
Workplace Injury Statistics: Although we live in a technologically developed world, unfortunately, some employees still experience workplace injuries. Workplace injury could occur from the machine or man-made and can even cause fatal injuries. The most common injuries reported by employers are burns, overexertion, and falls. These are considered unforeseen events and sometimes can not be avoided, thus precautions should be taken to avoid such unfortunate events. Looking at these Workplace Injury Statistics, although the overall percentage has reduced, not all companies make efforts to measure safety for their own employees. Be it a large-scale organization or a small-scale organization, employee’s life should be protected.
Editor’s Choice
- The majority of workplace fatalities are reported in the fishing, agriculture, forestry, and hunting industries.
- As of April 2023, in the United States of America, the ratio for workplace fatality rate per 100,000 workers is 1.3. This has reported an increase in the rate as compared to previous years.
- On average, men are 17.3% more likely to get injured in workplaces as compared to women.
- Employees who unfortunately faced illness at their workplaces lasted on average for 14 days. These employees are reported to be aged between 55 to 64 years.
- The least dangerous states in the United States of America for workers are Arkansas, Delaware, and Georgia.
- According to Workplace Injury Statistics, injury rates for men in private sectors are higher as compared to government sectors.
- According to reports, women are more likely to experience injuries resulting from harmful exposure and roadway accidents and unfortunately, men have a higher rate of death during work caused by contact with objects or equipment or falls.
- Hazardous substance-related deaths cause around 650,000 deaths in the United States of America.
- Around the world, the total number of victims of Workplace fatalities has reached 160 million in 2023.
What is Workplace Injury?
Workplace injury or occupational accident is an unforeseen event that occurs at the workplace resulting in casualty or injury. Occupational accidents or injuries can result in physical or mental harm or both, along with disease and in worse cases death. These injuries could occur during business hours and include premises of the company or after work hours. Workplace injuries must be reported by the employer as soon as possible. Why it is important to report workplace injuries is to reduce the fines, chances of litigation, and penalties. Altogether, it is the responsibility of the company to assess the risks and provide preventative measures.
Common types under which workplace injury can considered
- Collisions or Crashes: Occur by Being struck by objects falling from a vehicle, falling from vehicles, semi, tractor-trailer, and tanker truck crashes, large truck drivers drinking and driving, getting stuck under an overturned vehicle, etc…
- Struck by Equipment or falling objects or by workers: Occurred by dropped loads, walking into machinery or walls, falling materials, debris or tools, poorly guarded machinery, excessive vibration, the pressure between the source of the injury and the person, being pushed into a hard surface of any kind, bumping onto an object or any hard surface, etc.
- Overexertion and muscle strains: Occurred by microtasks on a factory line, jumping onto another level, repetitive work with no breaks, collapsing structure, lifting, pushing, carrying or throwing, improper lifting techniques, typing or moving a mouse without good ergonomics, etc…
- Slips fall, and trips: Occurred by falling off roofs, skyscraper construction areas, and ladders, slipping on oily, icy, or wet floors, tripping because of unprotected holes or sides, clutter, etc…
- Fire and Explosions – Occur by Primary, Secondary, Tertiary, or Quaternary blasts such as blast waves, flying objects, or debris by blast wind, injury due to displacement through air or structure collapse, or injuries due to radiation, inhaling toxic substances, burns, or crush injuries, etc…
- Violence and other types of injuries by animals or persons: Occur by working with animals and not wearing proper attire, working with aggressive employees, etc.
Reasons why Workplace Injury Occurs
- No safety measures were taken during work hours
- Other exertions, or bodily reactions ($4.01 billion or 6.91% every year)
- Struck by equipment or object (Compensation costs $1.87 billion or 3.22% every year).
- Non-roadway incidents occurred in the factory, field, or parking lot (Compensation costs $1.39 billion or 2.39% every year).
- Caught in or compressed by objects or equipment ($2.19 billion or 3.77% every year)
- Slip or trip without fall ($2.52 billion or 4.34% every year)
- Falls to lower level ($5.07 billion or 8.73% every year)
- Roadway incidents with motorized land vehicles involving passengers, pedestrians, or drivers ($3.59 billion or 6.18% every year)
- Fall on the same level ($10.26 billion or 17.67%)
- Overexertion ($12.63 billion or 21.76%)
General Workplace Injury Statistics
- As of April 2023, in the United States of America, the ratio for workplace fatality rate per 100,000 workers is 1.3. This has reported an increase in the rate as compared to previous years.
- 20% of worker injuries are reported from construction industries that belong to private companies in the United States of America.
- Hazardous substance-related deaths cause around 650,000 deaths in the United States of America.
- The most dangerous jobs that cause workplace injuries are material movers, heavy truck drivers, tractor-trailers, nursing assistants, and freight laborers.
- The majority of workplace fatalities are reported in the fishing, agriculture, forestry, and hunting industries.
- Around the world, the total number of victims of Workplace fatalities will reach 160 million in 2023.
- The total number of occupational accidents has reached 340 million every year.
- On average, in the United States of America, an employer spends around $120,000 on every workplace injury.
- Moreover, the annual costs of workplace illnesses and injuries amount to $250 billion roughly in the United States of America.
- As of 2023, workplace-related deaths have been reduced by more than 60% in the United States of America.
- The least dangerous states in the United States of America for workers are Arkansas, Delaware, and Georgia.
- According to Workplace Injury Statistics, injury rates for men in private sectors are higher as compared to government sectors.
- Every year, 15% of injuries at the workplace are occurred in the United States of America.
- In the United States of America, every second 14 workers are injured on average.
- On average, the United States of America reported the deaths of 14 workers every day in their workplaces.
- Every year around 2.3 million employees around the globe experience work-related accidents.
- As of 2022, the Construction, Manufacturing & Transportation, and Storage industries shared 55% of major injuries.
Workplace Injury Statistics by Demographics
- According to Workplace Injury Statistics, the most vulnerable workers are younger and older employees.
- Employees who unfortunately faced illness at their workplaces lasted on average for 14 days. These employees are reported to be aged between 55 to 64 years.
- For employees aged between 16 to 24 years, the average number of injury days is reported as 5.
- According to reports, women are more likely to experience injuries resulting from harmful exposure and roadway accidents and unfortunately, men have a higher rate of death during work caused by contact with objects or equipment or falls.
- In 2023, New York, Texas, and California are marked as the most dangerous states in the United States of America for workers.
- On average, men are 17.3% more likely to get injured in workplaces as compared to women.
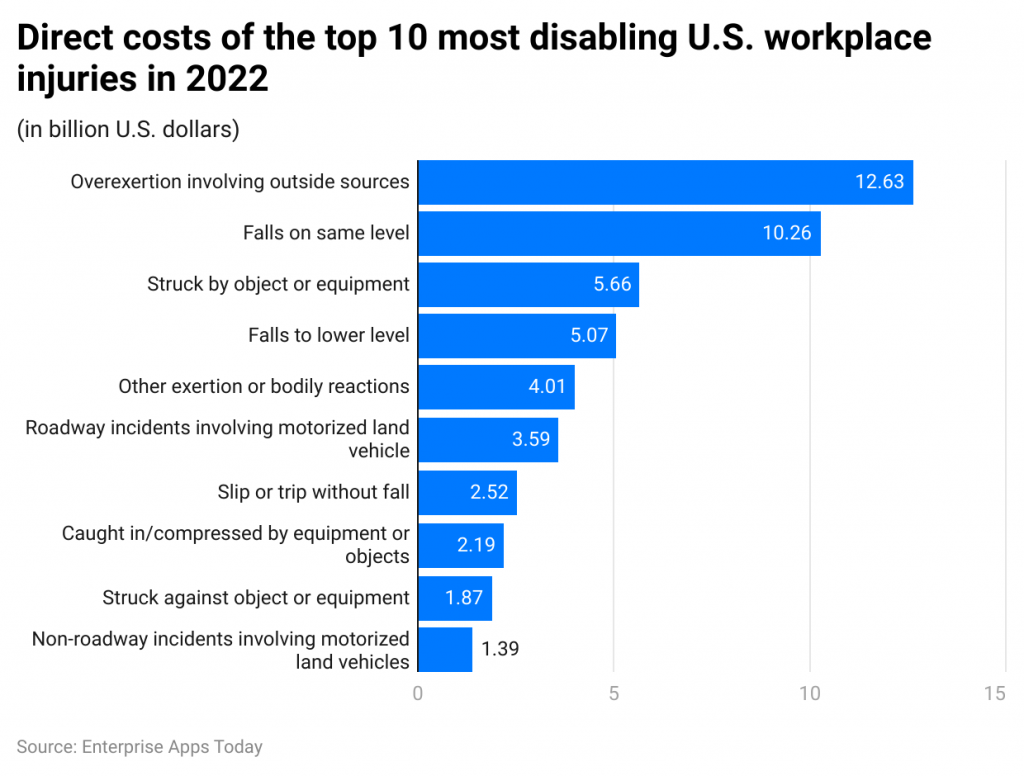
Statistics by Direct Costs of Workplace Injuries in 2022
 (Source: statista.com)
The top three causes of disabling workplace injuries in the United States of America that cost a fortune are overexertion involving outside sources ($12.63 billion), Falls on the same level ($10.26 billion), and Struck by object or equipment ($12.63 billion).
Statistics by Most Expensive Worker Injuries in 2023
- Occupational Diseases and Degeneration – $16,696 per injury average cost
- Concussion – $33,151 per injury average cost
- Lacerations, Punctures, and Ruptures – $33,348 per injury average cost
- Carpal Tunnel Syndrome – $33,477 per injury average cost
- Sprain or Strain – $33,589 per injury average cost
- Infection or Inflammation – $37,498 per injury average cost
- Burns – $48,671 per injury average cost
- Other Traums – $60,228 per injury average cost
- Fracture or Dislocation – $60,934 per injury average cost
- Amputation – $118,837 per injury average cost
Workplace Injury Statistics by Causes
- 84% of the nonfatal injuries were reported after and away from work caused by overexertion resulting in falls, bodily reactions, trips, and slips.
- The most common cause of workplace injuries in the United States of America is overexertion resulting in slips, falls, and trips.
- 3% of the injuries are caused by fires or explosions.
- 275 American workers report injuries due to falls, slips, and trips away from work every day.
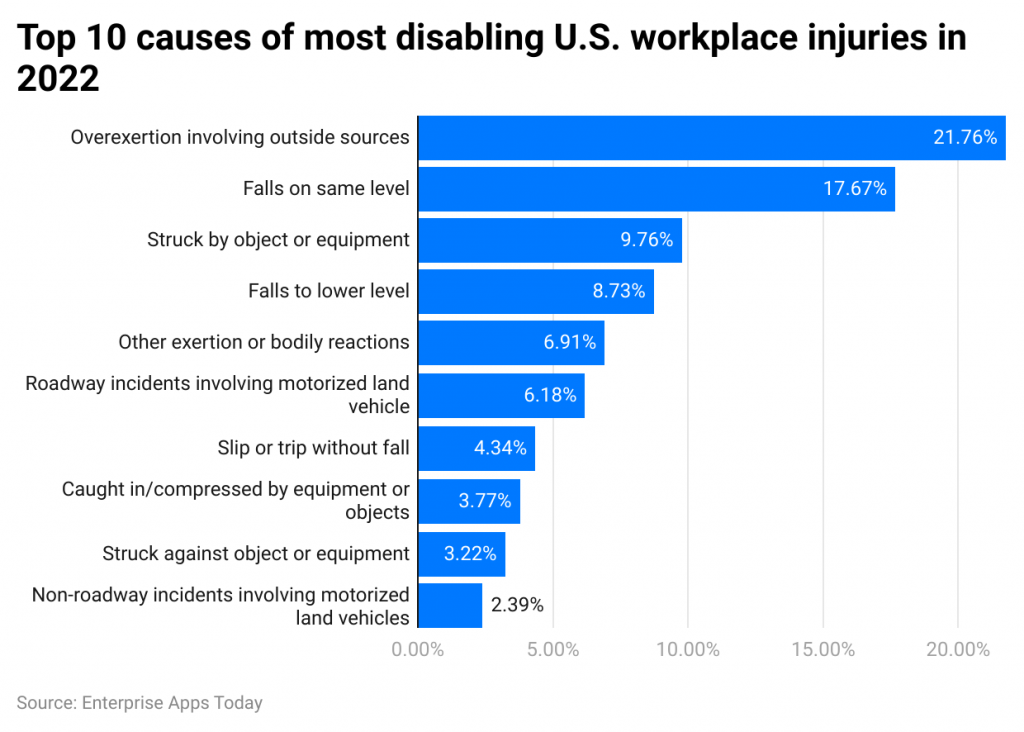
Top 10 Causes of Most Disabling Workplace Injuries in the USA in 2022
 (Source: statista.com)
As of 2022, the top 3 reasons for most disabling Workplace injuries in the USA were overexertion involving outside sources (21.76%), Fall on the same level (17.67%), and Struck by object or equipment (9.76%). The lowest number of accidents were caused by non-roadway incidents involving motorized land vehicles (2.39%).
Top 5 occupations with all-time Highest Number of Workplace Deaths
- Transportation and Material Moving
- Construction
- Installation Maintenance and Repair
- Management
- Building and Grounds Cleaning and Maintenance
Top 5 occupations with all-time Lowest Number of Workplace Deaths
- Legal
- Computer and Mathematical
- Educational Instruction and Library Occupations
- Life, Physical, and Social Science
- Business and Financial Operations
Conclusion
Concluding the Workplace Injury Statistics, even today people experience some unfortunate events but thankfully, the ratio has reduced by 60% compared to previous years. However, it is the responsibility of employers as well as employees to take preventive measures to avoid injuries at the workplace. Of course, these events are unforeseen, but they can be avoided if proper planning and assessments are made in advance. With new trends of remote work, remote workers are eligible for any such compensation, but it also depends on the company’s policies.
Sources
FAQ.
As of 2023, most employers are required to purchase worker's compensation by the law in the United States of America. Moreover, the majority of the employees who are injured at the workplace receive medical care and in some cases, payment to compensate for the disabilities resulting from the same.
As of 2023, Denmark, Netherlands, and Hungary are the top three safest countries in the world to work in.
Risk Assessments, Frequent Inspections, Ongoing and effective training, Personal Protective Equipment placements, accident reporting, physical assessments, and proper means of communication are some of the ways to prevent workplace injuries.
Workplace injuries include injuries that occur because of occupational hazards such as chemical, biological, physical, and psychosocial for example, insect and animal bites, blood-borne pathogens, aerosols, temperature, noise, radiation, hazardous chemicals, and occupational burnout.
Yes. Injuries that occurred during remote work can be considered under Worker’s compensation. These typically include repetitive stress such as carpal tunnel syndrome from typing, slips and falls during work hours, and back and neck caused by employees sitting all day long.
In the United States of America, under Worker’s Compensation benefits for workplace injuries two-thirds of the employee’s gross salary is provided.

Shivanjali, a Digital Marketing Expert, regularly contributes to various industry-specific magazines. She is interested in tech statistics, SMO, and raising awareness about technical how-to guides. She can often be found exploring different places on weekends.