
Business Travel Statistics By Industry and Business Size
Page Contents
- Introduction
- Editor’s Choice:
- Key Business Travel Statistics
- Benefits of the U.S. Business Travel
- Operating Partners of Business Travel in the U.S.
- Reasons for Constraints in Business Travel
- Expensive Cities in the United States
- U.S. Business Travel Statistics
- Travel Statistics By Business Size
- U.S. Business Travel: Industry Statistics
- Remote Employee Statistics
- Sustainable Business Travel Statistics
- Some Important Statistics
- Conclusion
Introduction
Business travel statistics: Business travel is a type of trip that is taken for work purposes only and is not a travel holiday, or vacation. Business trips usually involve tasks that require at least a day away from home. Generally, these are of two types: domestic and international. Statistics say that by the end of 2022, the United States will have around 460 million business travelers, and the annual revenue generated will be $387 billion. This article includes many important travel statistics on different businesses which will provide a proper understanding of the topic.
Editor’s Choice:
- In 2022, the market for business travel in the US was worth $201.3 billion.
- Spending on business trips has increased by 34% by the end of 2022.
- As of 2022, business travel has turned out to be 12% of overall travel in the U.S.
- Over 460 million business travelers have traveled in the U.S.,
- In the United States, businesses spend more than $111.7 billion annually on travel.
- By the end of 2022, around 50% of American business travelers belonged to the age group of 35-54 years.
- In April, travel expenditures slightly decreased from the first quarter of the year.
- International travel expenses of the U.S. corporate have increased by 21% in 2022 and expecting to increase by 33% by the end of 2023.
- Business travels that had stopped in the last two years have been renegotiated again in 2022.
- One-third of US businesses claimed to achieve 2030 sustainability goals. Thus companies have started to cut back on staff travel by more than 20%.
- The number of business trips is expected to reach 487 million by 2026.
Key Business Travel Statistics
- The market size value of the U.S. in 2022 was $1.22 billion.
- The growth rate is expected to reach a CAGR of 10.3% starting from 2022 to 2030.
- The market size of the travel agency sector in the U.S. reached 48.53 billion in 2022.
- 12% of American business travelers remained near the nation in 2022 due to some pre-pandemic factors.
- In 2022, 45% of international business travel in the U.S. has been postponed.
- 43% of no or little international travel because of pandemic factors in 2022.
- The proportion of firm spending invested in business travel increased by 10.7 percent.
- American businesses are reducing expenditures on travel for business trips by 25%.
- The United States suffered in the first quarter with a loss of $43 million and a negative operating margin of 0.4 percent due to changes in the seasonality of its business travel.
- Air travel increased by 10% since last year in April 2022.
- Due to more travel, the demand for the hotel increased by 2%.
- The overall overseas arrivals in the U.S. decreased by 27% in April 2022.
Benefits of the U.S. Business Travel
- 54% of travelers developed better relationships with stakeholders.
- 29% = Proper training and professional development
- 29% = involved in building awareness about products and services of different organizations.
- 24% = focused on understanding the current business trends.
- 22% = achieved proper motivation and engagement.
- 20% = involved in analyzing sales reports.
- 15% = has gained knowledge in dealing with competitor companies.
Operating Partners of Business Travel in the U.S.
- Expedia, Inc.
- Booking Holdings Inc.
- American Express Global Business Travel (GBT)
- TCS World Travel
- Abercrombie & Kent USA, LLC
- Exodus Travels Ltd.
- BCD Travel
- Intrepid Travel
- Topdeck Travel Ltd.
- Trafalgar
Reasons for Constraints in Business Travel
- 2021 has impacted most of the business sectors of the United States and those consequences had contained business travel.
- 23% of U.S. businesses have lagged about the importance of business travel.
- 71% of business firms had replaced their business travel with a virtual meeting process.
- Spending on business travel has increased by 66% because of having more remote employees.
- As stakeholders have also started working remotely, thus around 64% of companies limited their business travel.
- 63% of all business firms in the U.S. have faced many financial issues which became the cause of less travel.
- 59% of companies were working under risk mitigation that reduced the cost of traveling.
Expensive Cities in the United States
(Reference: statista.com)
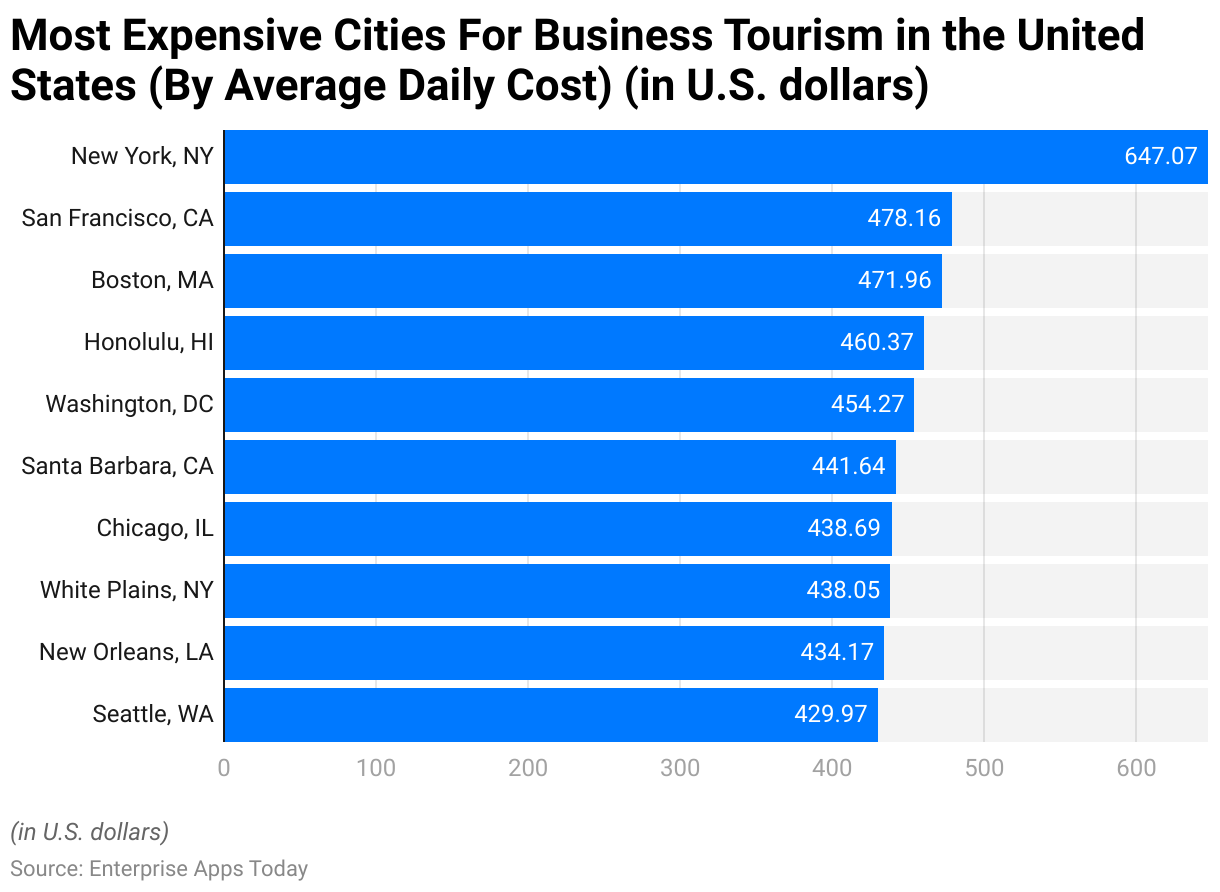
- The above graph shows the highest to lowest expenses in business travel cities of the United States in the 4t quarter of 2022.
- The amount above is calculated on a daily basis.
- New York ranked top with $647.07 on accommodation, food, and car.
- San Francisco = $478.16
- Boston = $471.96
- Honolulu = $460.37
- Washington = $454.27
- Santa Barbara = $441.64
- Chicago = $438.69
- White Plains = $438.05
- New Orleans = $434.17
- Seattle = $429.97
(Source: spendesk.com)
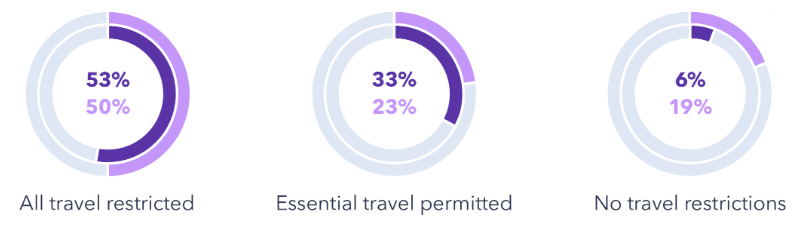
- The color of the above graph represents travelers’ restrictions in 2022.
- 50% of all U.S. business travel got restricted.
- Only essential travel was permitted by 23% of business
- No travel restriction was applicable on 19%.
(Reference: zippia.com)
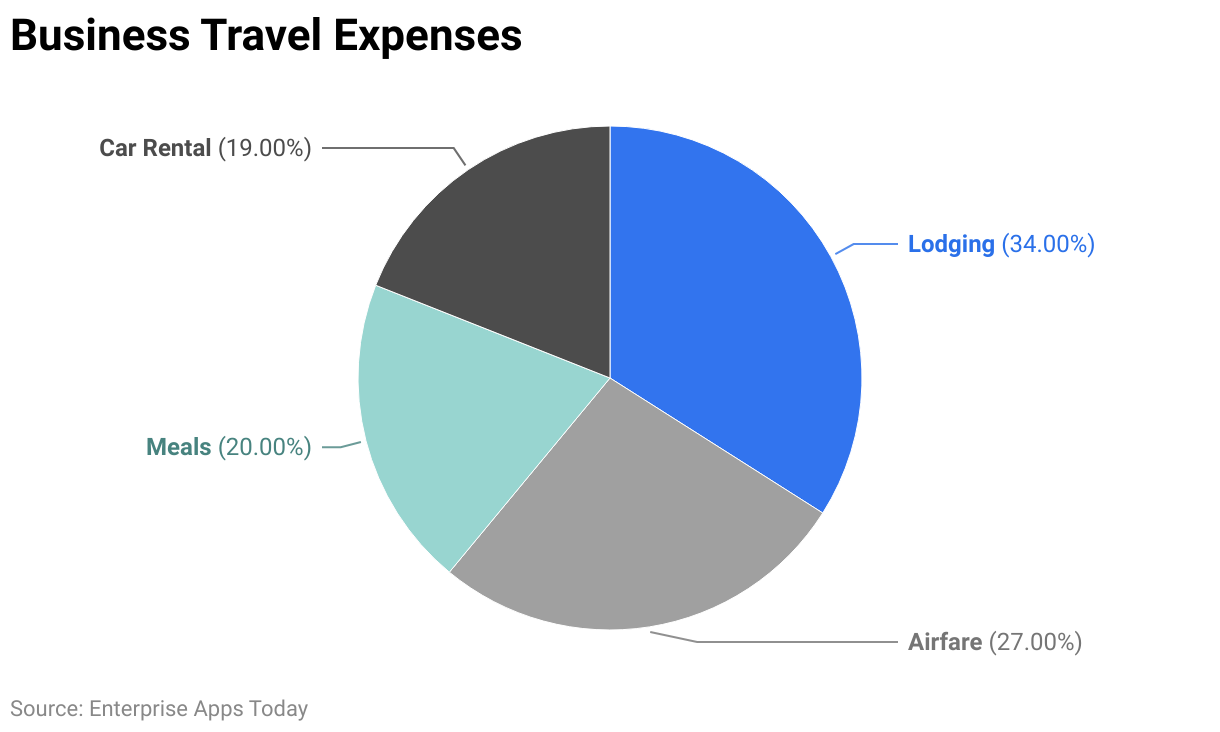
- The above pie chart represents the different sections of expenses for business travel in 2022.
- Lodging costs increased by 34%.
- Airfare increased by 27% and Car rentals = by 19%
- Meal by 20%.
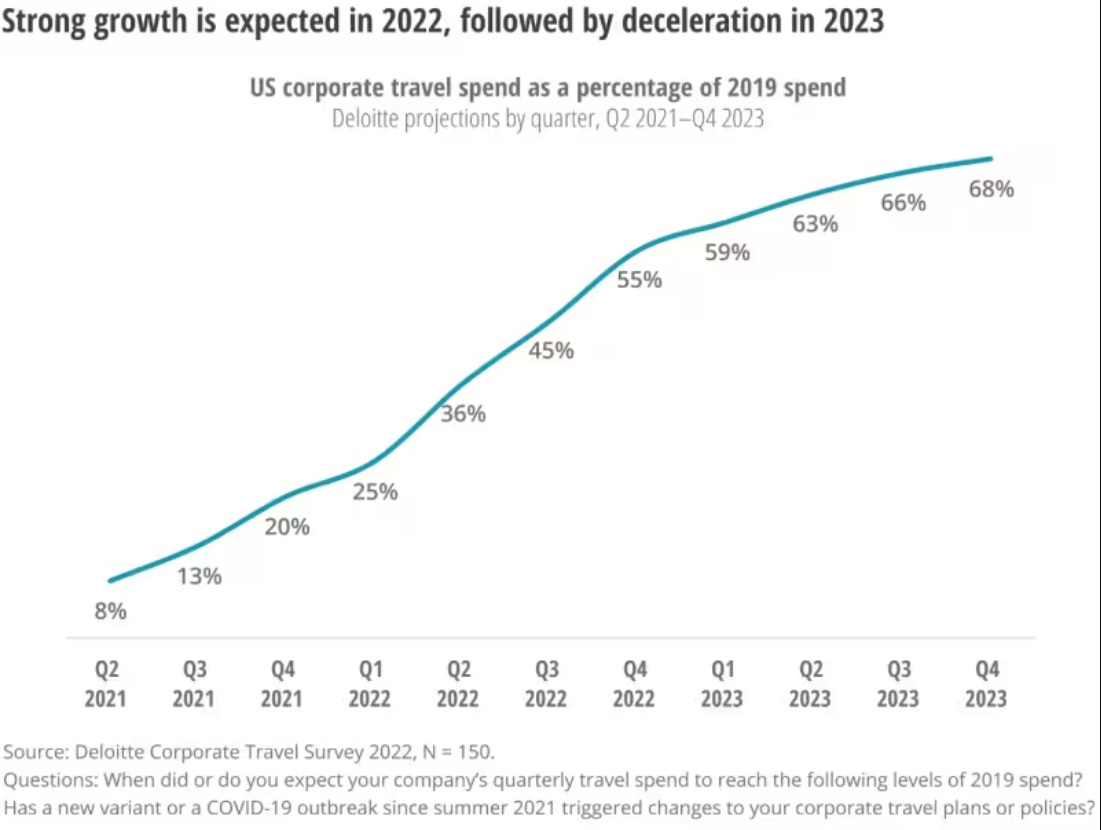
(Source: deloitte.com)
- The above graph represents the business travel spending in the United States.
- As of 2022, the growth was expected to increase after a huge decline in the previous two years.
- In the 1st quarter of 2022, it has increased to 25%.
- 2nd quarter = 36%
- 3rd quarter = 45%
- 4th quarter = 55%
- As of 2023, the spending is expected to reach 68% by the 4th
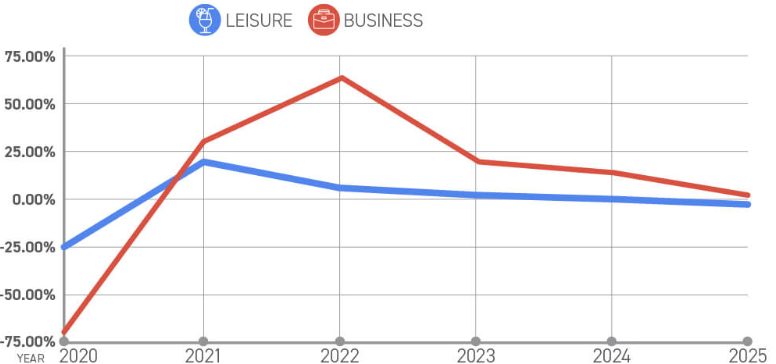
(Source: maddenmedia.com)
- The above graph shows the U.S. domestic spending between leisure travel and business travel.
- In 2022, the spending ranked higher in business travel and is estimated to be reduced in the coming years.
![]()
(Reference: ustravel.org)
- The above graph explains the business travel percentage in the U.S. depending on different business purposes.
- In 2022, 2nd quarter (conferences, conventions, or trade meetings) = 81% and 3rd quarter = 78%.
- In 2022, 2nd quarter (customer, supplier, and stakeholder meetings) = 80% and 3rd quarter = 75%.
- Internal meetings in 2022, 2nd quarter = 85% and 3rd quarter = 80%.
- If compared between quarters 2 and 3, then quarter 3 had made one travel in the next six months.
- Total number of business trips in Q1 = 2593, Q2 = 2545, Q3 = 1641
U.S. Business Travel Statistics
- 8 trips per month as compared with 1.9 pre-pandemic with a drop of 5.1% by the mid of 2022.
- The percentage of planned business travels that are travel for external purposes, including meeting mostly with individuals outside of their organization, conferences, conventions, or trade exhibitions was 67%.
- By the end of 2022, internal meetings on an average = 0.6 / month
- Customer and stakeholder meetings = 0.7 / month
- Conferences and trade meetings = 0.5 / month
Travel Statistics By Business Size
- In 2022 there was a rise in travel assurance in smaller businesses has increased than in larger businesses.
- Companies with less than 1000 employees are termed as smaller businesses and more than 1000 are larger businesses.
- Conferences and convention meetings (smaller companies) = 82% and (larger companies) = 73%.
- Customer, supplier, and stakeholder meetings (smaller companies) = 76% and (larger companies) = 72%.
- Internal meetings (smaller companies) = 80% and (larger companies) = 80%.
U.S. Business Travel: Industry Statistics
- (Health care and social services) = 10.2%
- (Information and technology) = 9.8%
- (Manufacturing) = 9.4%
- (Professional, Scientific, and Technical Services) = 6.9%
- (Banking, Finance, and Insurance) = 5.5%
- (Construction) = 5.4%
- (Retail Trade) = 4.7%
- (Food Services, Restaurants, and Hospitality) = 3.8%
- (Educational Services) = 3.7%
- (Aviation and Aviation Services) = 3.7%
- (Arts, Sports, Entertainment, and Recreation) = 3.4%
- (Transportation and Warehousing) = 3.2%
- (Utilities) = 3.1%
- (Agriculture, Forestry, Fishing, and Hunting) = 3.0%
- (Mining) = 2.9%
- (Real Estate and Rental and Leasing) = 2.6%
- (Wholesale Trade) = 2.3%
- (Public Administration/Government) = 2.2%
- (Management of Companies and Enterprises) = 2.1%
- (Administrative and Support) = 0.7%
- (Waste Management and Remediation Services) = 0.4%
- (Other sectors) = 11%
Remote Employee Statistics
- In 2022, the United States is having one-third of business travelers those were working from home.
- Fully remote employee = 35%
- Mostly remote and sometimes office employees = 26%
- Fully office employee = 15%
- Mostly office and sometimes remote employees = 24%
- By the end of 2022, went for business travel was 1641 remote employees in the U.S.
Sustainable Business Travel Statistics
- In 2022, 77% of all U.S. business firms had increased business trips only when sustainable options were available.
- 76% of companies increased the rate of travel without bothering about the expenses.
- 74% of organizations invested in business travel in return for financial gains.
- 72% of companies will implement new policies on increasing business trips by 2023.
Some Important Statistics
- The quarterly U.S. business travel index of 2022 has decreased since 2019 but had increased from the previous year.
- In the 1st quarter of the 2022 it remained 67 out of 100; 2nd quarter = 82; 3rd quarter = 85 and 4th quarter = 85+
- By the mid of 2022, 85% of remote employees in the U.S. had expected to travel for internal meetings as compared to 72% of office employees.
- 73% of remote employees traveled more for conference meetings as compared to office employees.
- While on working trips, 45% of women report positive experiences.
- 81% of remote employees traveled more for stakeholder meetings as compared to office employees.
- In 2022, U.S. business trips have increased by 32%.
- Traveling for business in New York costs $500 per day, making it the most costly city.
- In the U.S. every year around 400 million business travel takes place.
- Traveling helped the nation in gaining more than 700K job opportunities.
- Every month, travelers of U.S. businesses make 2 trips.
- Around 33% of U.S. international business travelers’ toped destination was in Mexico in 2022.
- The U.S. had spent 80% of its expenditure on domestic business travel.
- In July 2022, almost 122K flights have been canceled because of post-COVID-19 restrictions.
- Around 43% more employees have scheduled to travel for business work.
Conclusion
After completing the article on business travel statistics it can state that the overall business sector in the United States represents business travel as an effective investment. This travel is beneficial as it gives chances to enhance network, attend conferences, and discover new markets in addition to giving chances to interact directly with business clients. In 2022, the market for business travel has increased with a worth of $201.3 billion. Many stats above in the article describe several positive and negative factors on different kinds of companies and industries will provide a clear idea about the topic.
FAQ.
By the end of 2022, the U.S had made more than 12% of business travel and over 460 million travelers have traveled.
This provides more networking opportunities, influences employees' prospective, allow them in experiencing new working cultures, and many more.
Whenever an employee returns from a business trip, they have to adhere to a difficult reimbursement process.
Flight tickets, car rentals, parking facilities, hotel including meal, and lodging services and Wi-Fi are the basic expenses provided by companies.

Barry is a lover of everything technology. Figuring out how the software works and creating content to shed more light on the value it offers users is his favorite pastime. When not evaluating apps or programs, he's busy trying out new healthy recipes, doing yoga, meditating, or taking nature walks with his little one.