
Film Industry Statistics 2024 By The Distributor, Running Time, Demographic and Box Office Revenue

Page Contents
- Introduction
- Editor’s Choice
- What Includes The Film Industry?
- General Film Industry Statistics
- PWC's Entertainment and Media Report
- China Film Industry Statistics
- Top International Markets of 2022
- By The Distributor
- By Running Time
- By Demographic
- By A Visit Movie Theaters
- By Box Office Revenue
- By The Top Movies of 2022
- By The Language Of Movies
- By The Production Method
- Conclusion
Introduction
Film Industry Statistics: The film industry is the most significant contributor to the global economy. The only major downfall faced by this industry was during 2020 due to the lockdown situation. As of today, it is no doubt that this industry has become more than a billion-dollar industry. The film industry belongs to the creative field therefore, yearly on a global level millions of people are employed in terms of acing, graphic design, video editing, writing, etc.
The film industry in 2023 showcases a vibrant tapestry of achievements and challenges, reflecting both the resilience and the evolving dynamics of global cinema. With total box office gross reaching $527,876,195 and over 50 million tickets sold, the industry continues to captivate audiences worldwide, underscoring the enduring appeal of cinematic experiences. Musicals have surged to the forefront, commanding a significant market share and redefining genre popularity, while films like “Wonka” and “Mean Girls” lead as top grossers, indicating a diverse audience appetite.
Despite a backdrop of production delays due to strikes and the ongoing search for innovative distribution models, the industry's ability to adapt and thrive is evident. The anticipation for studio tentpoles and a rich slate of mid-budget films suggests a balanced ecosystem poised for growth and surprises.
In this Film industry statistics, and insights are written from a global perspective considering the 2021 and 2023 years. The data received in various segments and categories are unique and interesting.
Editor’s Choice
- In 2022, the average price for a movie ticket in domestic theaters was USD 9.17.
- English emerged as the predominant language for global box office movie releases as of 2023.
- North America was identified as the top-grossing territory in the domestic box office market in 2023.
- The European film industry held a global market share of 26.5% in 2021.
- Approximately 3% of independent films were not distributed theatrically.
- The cinema industry in the United States is projected to expand at a CAGR of 8.3% through to 2027.
- The live-action category led as the highest-grossing segment in the film production methodology, amassing a revenue of USD 5,750,204,733.
- Revenue generated by the domestic box office reached USD 5.99 billion in 2022.
- The global film industry's annual revenue stood at USD 77 billion as of 2022.
- In 2021, 53% of US residents reported feeling uneasy about attending cinema halls due to the pandemic.
- The total box office gross for the year reached USD 528,978,195, with a total of 50,235,295 tickets sold. The average ticket price was maintained at USD 10.53, indicating stable consumer spending on cinema.
- “Wonka” and “Mean Girls” emerged as the top-grossing movies, with musicals gaining significant traction, underscoring a diverse audience appetite for genre variety.
- The industry saw inventive distribution models becoming crucial, especially in the wake of production stoppages caused by the writers' and actors' strikes. This period of adaptation might lead to a more varied and engaging cinematic offering in the years to come.
- Mid-budget films and movie musicals have shown potential for success, challenging the notion of box office poison and indicating a shift in consumer preferences towards varied cinematic experiences.
- The superhero genre remains a staple, with titles like “Kraven The Hunter,” “Madame Web,” and “Venom 3” from Sony, alongside “Deadpool 3” from Marvel Studios, hinting at the sustained popularity of franchise films.
- There's an increasing reliance on established IPs and franchise models, yet there's room for new narratives and ideas, as indicated by the anticipation surrounding “Dune: Part Two” and other mid-budget titles.
You May Also Like To Read
- Media and Entertainment Industry Statistics
- Top 10 Indian OTT Platforms Statistics
- Warner Bros Statistics
- HBO Statistics
- Amazon Prime Video Statistics
- Anime Statistics
- OTT Platform Statistics
What Includes The Film Industry?
The film industry or motion picture industry includes commercial and technological companies which specialize in cinematography, film studios, production companies, film production, animation, pre-and post-production, film festivals, and distributors. All of these things together are the film making industry. Today, the movie/cinema industry is not only limited to theaters, but OTT platforms are majorly contributing to the overall revenues of films.
North American Movie Territory Statistics 2024 (3 Feb 2024)
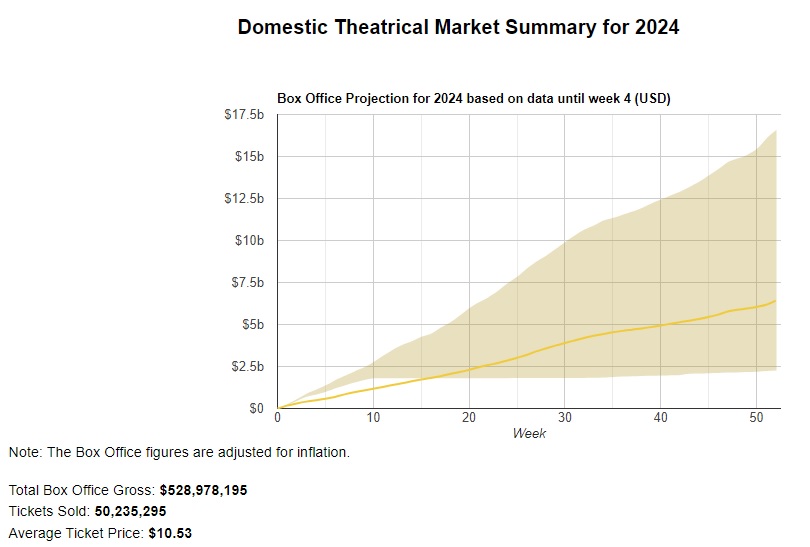
Box Office Gross in 2024
– Total Box Office Gross: $528,978,195
– Tickets Sold: 50,235,295
– Average Ticket Price: $10.53
Top Grossing Movies of 2024
1. Wonka – Released on Dec 15, 2023 by Warner Bros. – Musical Genre
– 2024 Gross: $64,256,470
– Tickets Sold: 6,102,228
2. Mean Girls – Released on Jan 12, 2024 by Paramount Pictures – Musical Genre
– 2024 Gross: $63,406,038
– Tickets Sold: 6,021,466
3. Anyone But You – Released on Dec 22, 2023 by Sony Pictures – Romantic Comedy Genre
– 2024 Gross: $48,994,269
– Tickets Sold: 4,652,827
4. Migration – Released on Dec 22, 2023 by Universal – Adventure Genre
– 2024 Gross: $48,805,330
– Tickets Sold: 4,634,884
5. The Beekeeper – Released on Jan 12, 2024 by MGM – Action Genre
– 2024 Gross: $45,450,661
– Tickets Sold: 4,316,302
Biggest Weekends of 2024
1. Mean Girls – Weekend Revenue on Jan 12, 2024: $28,635,307
2. The Beekeeper – Weekend Revenue on Jan 12, 2024: $16,576,007
3. Wonka – Weekend Revenue on Jan 5, 2024: $14,077,078
Market Share for Each Distributor in 2024
1. Warner Bros. – 23.27% of total earnings
2. Universal – 17.06% of total earnings
3. MGM – 15.85% of total earnings
Market Share for Each Genre in 2024
1. Musical – 27.30% of total earnings
2. Action – 23.47% of total earnings
3. Drama – 16.53% of total earnings
Market Share for Each MPAA Rating in 2024
1. PG-13 – 42.01% of total earnings
2. R – 31.08% of total earnings
3. PG – 23.20% of total earnings
Market Share for Each Type of Source Material in 2024
1. Original Screenplay – 38.09% of total earnings
2. Based on Fiction Book/Short Story – 19.89% of total earnings
3. Based on Musical or Opera – 15.03% of total earnings
Market Share for Each Production Method in 2024
1. Live Action – 87.49% of total earnings
2. Digital Animation – 10.92% of total earnings
3. Hand Animation – 1.59% of total earnings
Market Share for Each Creative Type in 2024
1. Contemporary Fiction – 41.45% of total earnings
2. Kids Fiction – 24.60% of total earnings
3. Dramatization – 11.31% of total earnings
This summary provides key statistics about the movie market in 2024, including top-grossing movies, box office earnings, distributor and genre shares, MPAA ratings, source material, production methods, and creative types.
General Film Industry Statistics
- Compared to the gaming industry in the entertainment category, the Film Industry is less valued at $42.5 billion to $145.7 billion.
- The domestic box office generated a revenue of $5.99 billion as of 2022.
- In 2023, the domestic box office generated a significant revenue of USD 8.91 billion, marking a considerable increase from the previous year.
- The cinema industry in the United States of America is expected to grow at a CAGR of 8.3% by the year 2027.
- In the year 2023, the expected value of movie and video production in the United States of America is $26.7 billion.
- Moreover, the Film industry statistics say that the projected market size growth in the year 2023 in the United States of America is 3.3%.
- As of 2021, the market share of the European film industry around the globe is 26.5%.
- The annual revenue of the global film industry as of 2022 was $77 billion.
- The top countries by the market by the year 2025 in terms of projected highest revenue are China and the United States of America.
- The worldwide cinema box office revenue as of 2022 was $26 billion as stated by film industry statistics.
- North America recorded the highest-grossing territory in the box office domestic market in the year 2022.
- According to Film industry statistics, the average ticket charge for domestic theater was $9.17 in the year 2022.
- 3% of independent films do not receive any theatrical releases.
- The global movie production and distribution market size as of 2023 is $77.2 billion.
PWC's Entertainment and Media Report
- In 2022, global entertainment and media (E&M) revenue increased by 5.4% to reach US$2.32 trillion. However, this growth rate decelerated significantly compared to the 10.6% growth in 2021.
- Over the next five years, the growth rate is expected to decline further, with revenue projected to grow by only 2.8% from 2026 to 2027.
- This slowdown in E&M revenue growth is primarily attributed to sluggish consumer spending, driven by factors such as inflation, pandemic effects, and geopolitical uncertainties.
- Consumer spending on E&M is expected to grow at a compound annual growth rate (CAGR) of 2.4% between 2022 and 2027, reaching a total of US$903.2 billion by 2027.
- Advertising expenditure is set to surpass consumer spending in 2025, with global advertising revenue expected to rise from US$763.7 billion in 2022 to US$952.6 billion in 2027, representing a CAGR of 4.5%.
- Internet access, another major E&M category, is projected to surpass consumer spending in 2026.
- Despite increased digitalization in E&M, the cost of production and distribution is decreasing. Competition among digital content and service providers is on the rise.
- Consumer spending per capita on E&M is expected to decrease from 0.53% of average personal income in 2023 to 0.45% in 2027.
- Generative AI is being exploredas a means to boost productivity in the creative process within the E&M industry.
- The gaming sector is experiencing significant growth, with total gaming revenue expected to reach US$312 billion in 2027, driven by creativity, consumer spending, and advertising.
- Live sectors, including cinema, esports, and live events, are returning to growth and are expected to outperform the overall E&M industry.
- Technology, particularly generative AI, is seen as a new growth engine for the E&M industry, automating tasks and increasing content production efficiency.
- Deals activity in the E&M industry has seen fluctuations, with some major mergers and acquisitions, while others have faced challenges.
- Regulation and privacy concerns, such as tracking changes and data protection, are impacting the industry, leading to efforts to offer personalized advertising while preserving user anonymity.
- Geopolitical factors also influence regulatory interventions, with concerns about data security and access.
- As the industry evolves, it's essential for companies to reassess and refocus their strategies to adapt to changing market dynamics.
In summary, the E&M industry is facing challenges related to slower revenue growth, shifting consumer spending patterns, and increased competition. However, opportunities for growth exist in advertising, gaming, live events, and the adoption of generative AI technologies. Regulatory and privacy issues also play a significant role in shaping the industry's future.
China Film Industry Statistics
The China film industry has shown remarkable resilience and growth, positioning itself for a prosperous future. Here are some key statistics that highlight the industry's current state and prospects:
- The Chinese Cinema Market was valued at USD 3.4 billion in 2020, with projections suggesting an impressive growth rate, reaching an estimated USD 16.5 billion by 2026. This growth is driven by several factors including the increase in foreign film quotas, the rise of 3D screens, higher disposable incomes, and rapid technological advancements in film production and screening equipment.
- The beginning of 2024 saw China's box office achieving historical success, particularly during the New Year festivities, setting a new revenue record of 1.533 billion yuan (approximately USD 215 million) from December 30, 2023, to January 1, 2024. This success was largely contributed to by domestic films, which accounted for 92.04% of the market share during this period. (Source: globaltimes.cn)
- The year 2023 was a recovery year for China's film industry, with the total annual box office earnings reaching 54.915 billion yuan. Domestic films played a significant role, contributing 46.005 billion yuan, which is 83.77% of the total earnings. The audience's enthusiasm for movie-watching also made a comeback, with urban cinema attendance hitting 1.299 billion. (Source: globaltimes.cn)
These insights reflect a dynamic and rapidly expanding market, underscored by a strong preference for domestic productions and a significant recovery post-COVID-19 disruptions. With a solid start in 2024 and a diverse range of films set to release during the Chinese Lunar New Year, the industry is well-positioned to continue its growth trajectory and further consolidate its market share domestically and globally.
Top International Markets of 2022
- China: $4.3 billion
- Japan: $1.5 billion
- UK and Ireland: $1.2 billion
- France: $1.1 billion
- South Korea: $0.9 billion
- Germany: $0.8 billion
- Australia: $0.64 billion
- Mexico: $0.63 billion
- Spain: $0.4 billion
- Brazil:$0.35 billion
By The Distributor
 (Source: the-numbers)
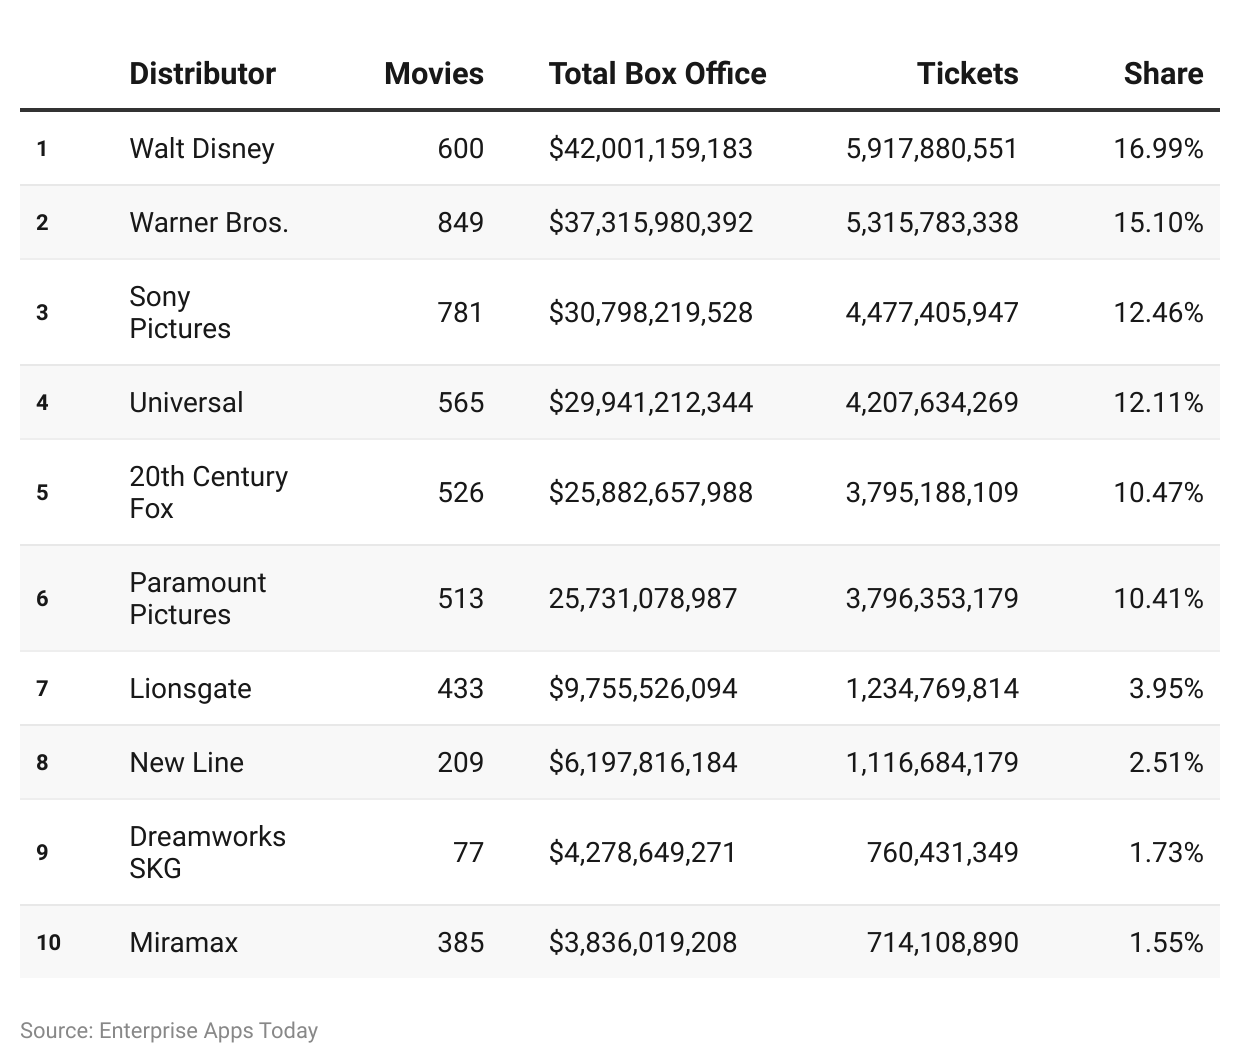
- The Film industry statistics in the above chart provide information on the top 10 distributors of movies by total generated revenue at the box office around the world as of 2022.
- Walt Disney was the largest ever movie distributor in the year 2022 as the company released around 600 movies creating $41,999691,340 of revenue with a 17.01 % share in the market and 5,917,720,480 tickets being sold.
- Warner Bros with a 15.11% of market share generated $37,301,875,235 of total box office revenue. The company sold around 5,314,239,669 tickets for the movies released under their names.
- The third rank was secured by Sony Picture with $30,763,026,050 at the total box office having a share of 12.46% with 775 released movies. The company was able to sell around 4,473,567,373 tickets around the world.
- Other companies with similar segments recorded the following insights Universal – $29,871,134,131 with 560 movies at 12.10 market share and 4,199,992,146 tickets sold.
- 20th Century Fox and Paramount pictures were a little far away from each other with $25,882,657,988 and $25,699,685,719 of revenue by having a market share of 10.48% and 10.41%. They released around 526 and 511 movies respectively which sold around 3,795,188,109 and 3,792,929,694 tickets.
- Lionsgate, New Line, DreamWorks SKG, and Miramax released around 433, 209,77 and 385 movies which sold 1,233,716.644, 1.116.684.179, 760.431.349, and 7.14.108.890 tickets with a share of 3.95%, 2.51%, 1.73%, and 1.55% respectively.
By Running Time
 (Source: NATIONAL STATISTICS OFFICE: MALTA)
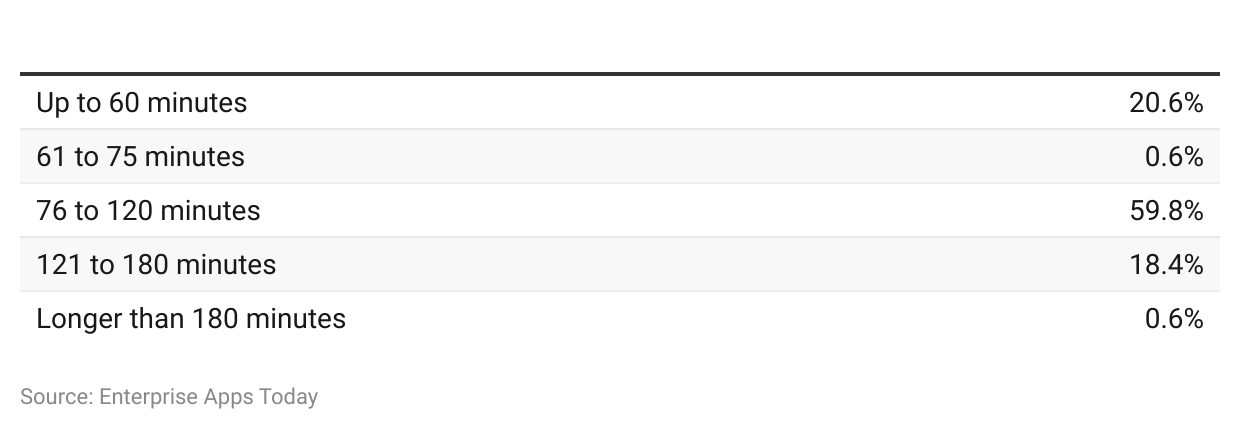
- As of 2022, there overall running of the movie with the highest minutes belongs to 76 to 120 minutes resulting in 59.8%.
- While 20.6% of movies released were of 60 minutes and 18.4% had a screening time of 121 to 180 minutes.
- On the other hand, 0.6% of the movies were screened for 61 to 75 minutes and more than 180 minutes respectively.
By Demographic
By Gender
(Source: ZIPPIA)
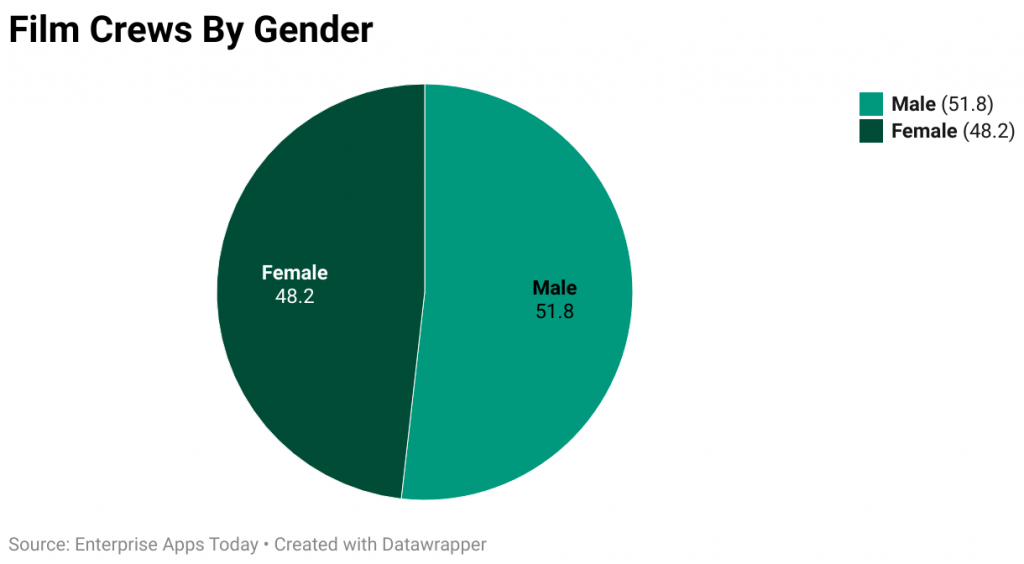
- Film industry statistics say that 51.8% of the crew members are male.
- And with a minor difference, 48.2% are female crew members.
- Above gender statistics in the film industry that this sector is male-dominated.
By Ethnic Background
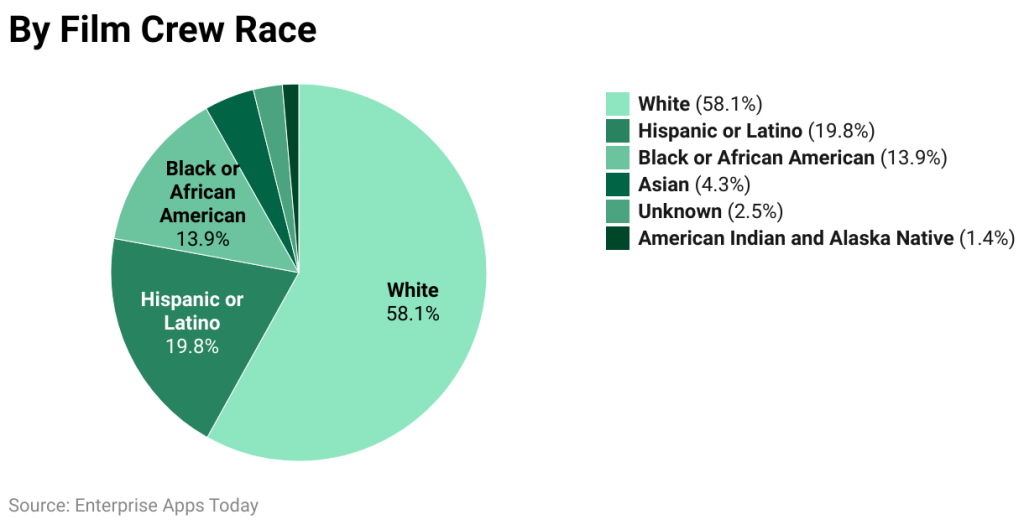
(Source: ZIPPIA)
- 1% of the film crew belong to the white background while 19.8% belong to Hispanic or Latino.
- 9% are black or African American by ethnic background.
- 3% and 1.4% of crew members are Asian or American Indian and Alaska natives respectively.
- On the other hand, 2.5% of the members didn’t reveal their ethnic background.
By Level Of Education
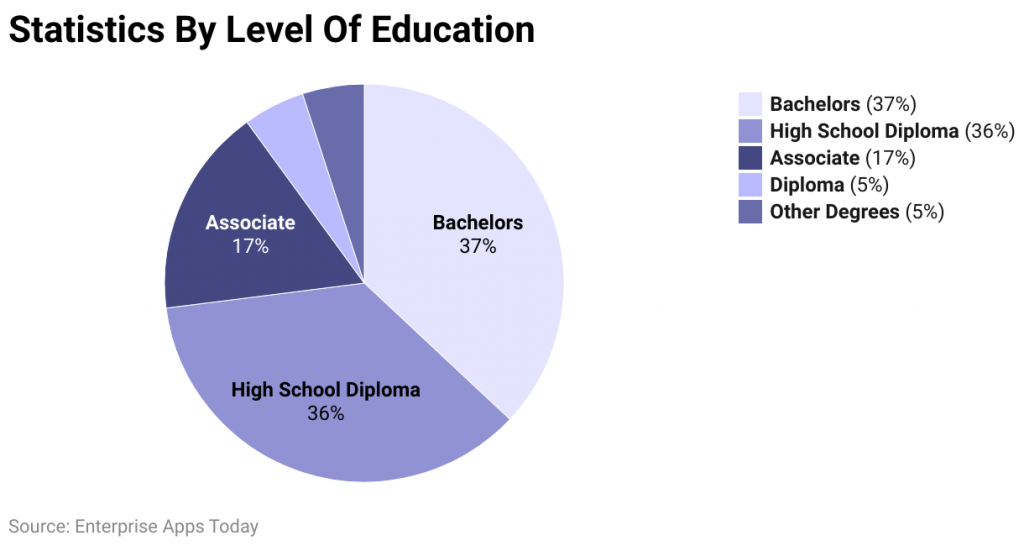
(Source: ZIPPIA)
- Film industry statistics say that there are 37% of the people in the industry have bachelor’s degrees.
- 36% of the people have a high school diploma, while 17% have an associate degree.
- 5% belong to the people with diplomas and other degrees respectively.
By A Visit Movie Theaters
- As of May 2022, 33% of the residents in the United States of America stated they go to cinema halls sometimes.
- On the other hand, 8% of Americans said they often go to movie theaters.
- 41% of Americans rarely go to movie theaters while only 18% never went to cinema halls.
- As of 2021, around the globe, Film industry statistics say that 61% of adults didn’t go to the movie theater in the whole year.
- On the other hand, 31% watched movies in the theater 1 to 4 times while 9% said they visited cinema halls more than 5 times.
- In the year 2021, 53% of the residents in the United States of America said they felt uncomfortable going to cinema halls because of the pandemic.
- However, only 18% of the adults were comfortable going back to movie theaters.
By Box Office Revenue
By Most Genre
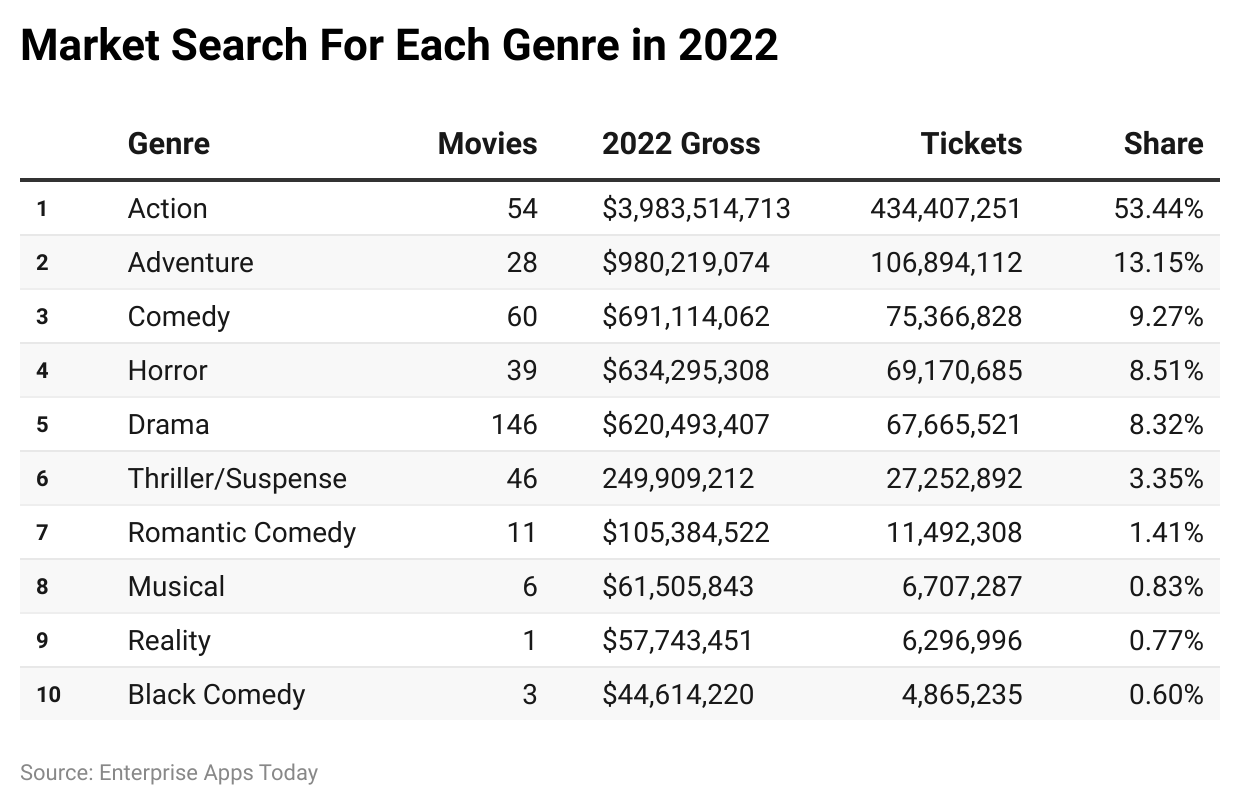 (Source: the-numbers)
- As of 2022, according to the Film industry statistics, the highest genre in the released movies was action with a $3,983,514,713 revenue, having a market share of 53.43%. Around 434,407,251 tickets were sold for movies in this category.
- The action segment had 54 movies released under its segment.
- There were around 28 and 59 Adventure and Comedy movies released in the year 2022. Both of the genres earned $980,219,074 and $691,113,850 gross revenues while having a share of 13.15% and 9.27% in the market respectively.
- Tickets for the genres of adventure and comedy were sold for 106,894,109 and 75,366,805.
- While other genres recorded the following data: Horror 37 movies, 8.51% market share, 69,161,842 tickets sold, and $634,214,244 revenue. Drama 144 movies released, 8.33% of market share, $621,137,428 generated revenue, and 67,735,748 tickets sold.
- Thriller/Suspense 3.35% market share and 46 movies released. 27,252,891 tickets sold and $249,909,212 generated revenues.
- Romantic comedy and musical movies generated around $61,505,843 and &57,743,451 of revenue by releasing 11 and 6 movies respectively. Each of these genres has a market share of 1.41% and 0.83% while 11,492,308 and 6,707,287 tickets sold.
- Similarly, reality and black comedy movies were released 1 and 3 respectively. Each of these genres sold tickets 6,296,995 and 4,865,235 with a market share of 0.77% and 0.60% respectively.
- Reality and black comedy movies generated total revenue of $57,743,451 and $44,614,220 each.
By Country
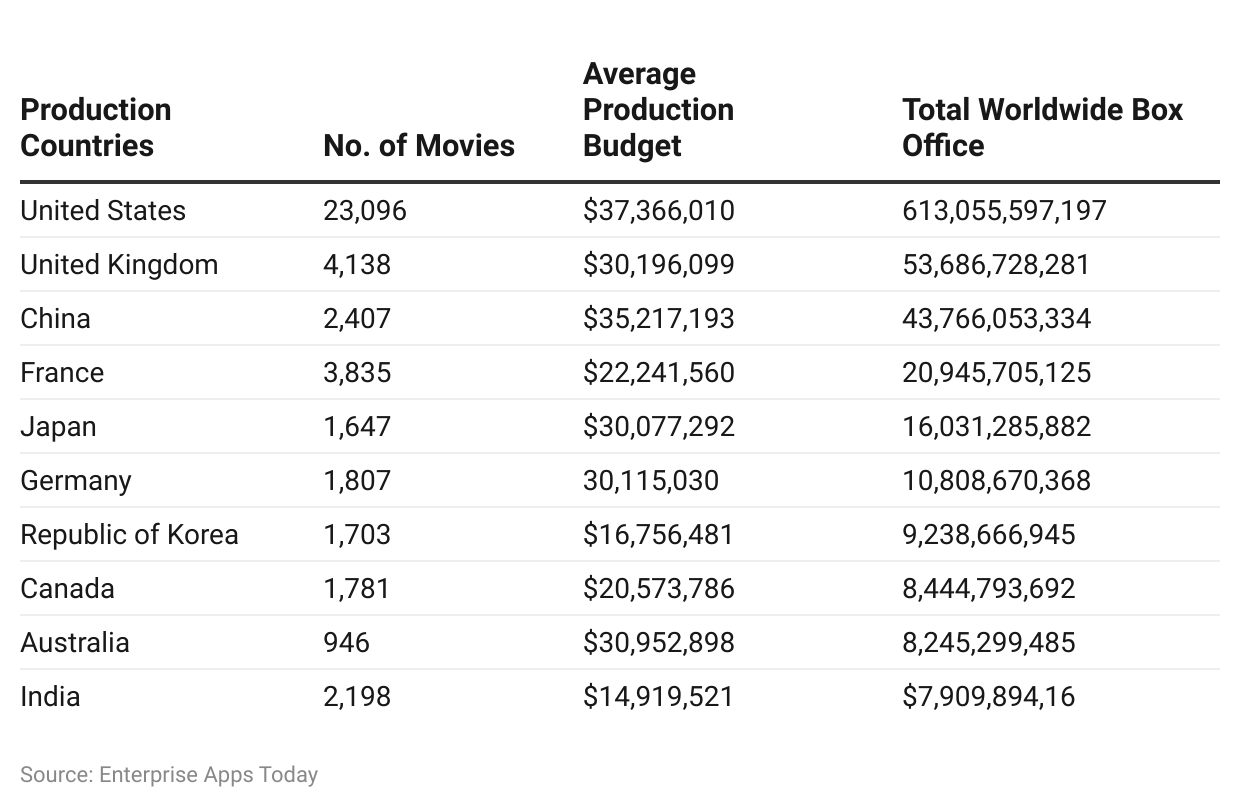 (Source: the-numbers)
- As of 2022, Film Industry statistics reported the United States of America as the top country for producing the highest number of movies resulting in 23,035 with an average production budget of $37,302,936. The revenue at the total worldwide box office was $612,550,083,433.
- Similarly, the United Kingdom and China produced 4,123 and 2,384 movies with average production budgets of $30,196,099 and $35,217,193 respectively.
- UK and China recorded the global box office at $53,665,576,963 and $42,456,671,308.
- Other listed countries as per the Film industry statistics as of 2022 were France, Japan, and Germany with 3,823, 1,638, and 1,786 released movies with a budget of $22,241,560, $30,077,292, and $30,115,030 respectively. The total at the global box office was $20,940,290,308, $16,021,496,459, and $10,793,126,586 each.
- Similarly, the Republic of Korea, Canada, Australia, and India released around 1,697, 1,777, 937, and 2,171 movies with budgets of $16,756,481, $20,573,786, $30,952,898 and $14,919,521 each with a total at the global box office $9,158,176,613, $8,435,663,346, $8,244,858,470 and $7,805,915,445 each.
By The Top Movies of 2022
 (Source: the-numbers)
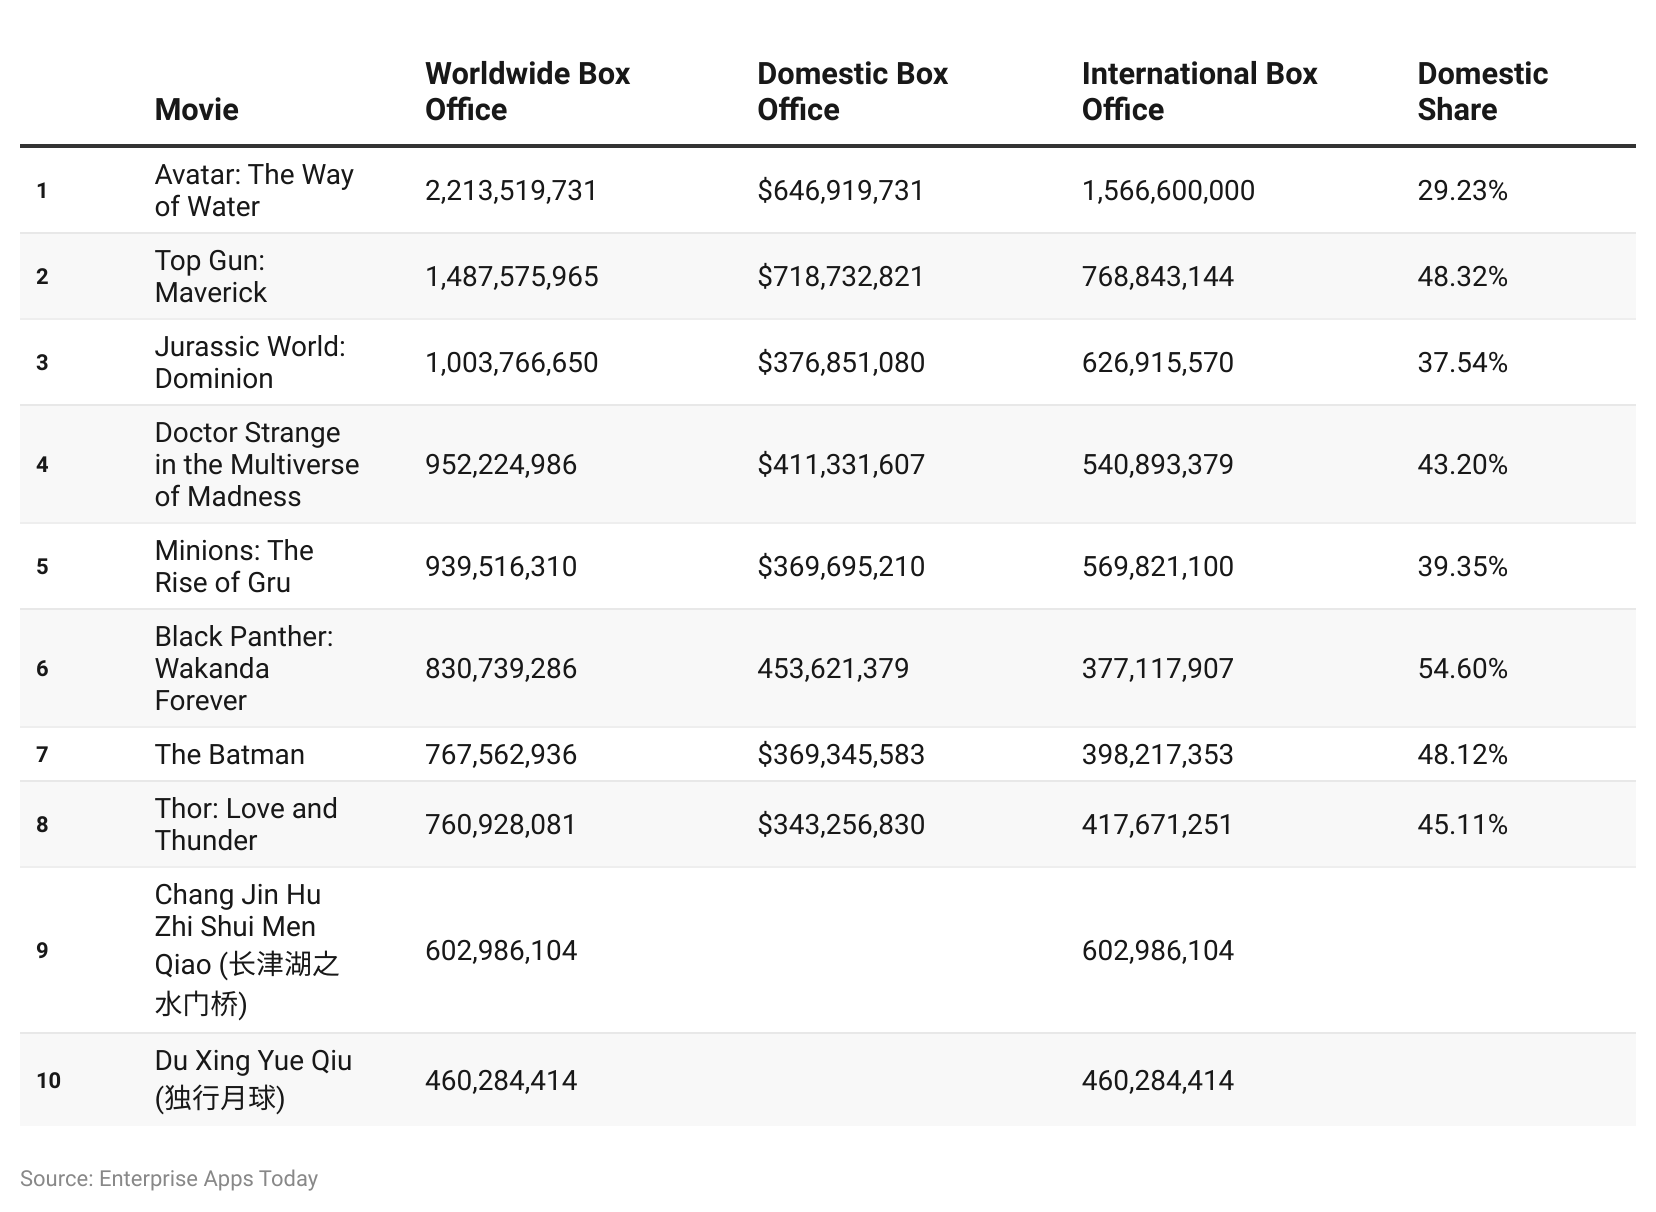
- As of 2022, the film industry statistics say that Avatar: The way of water was the largest revenue-generated movie at the international box office resulting in $1,451,300 with a domestic share of 29.37%. At the domestic and worldwide box office, the movie generated $603,434,732 and $2,054,734,732 respectively.
- The second place in the year 2022 was secured by Top Gun: Maverick which generated $768,843,144 at the international box office with a share of 48.32%. Similarly, the result at the worldwide box office and domestic box office was $1,487,575,965 and $718,732,821.
- Other movies ranked in the list were Jurassic World Dominion, Doctor Strange in the Multiverse of Madness, Minions: the rise of Gru, Black Panther: Wakanda Forever, The batman, Thor: Love and Thunder, Chang Jin Hu Zhi Shui Men Qioa and Du Xin Yue Qiu with the respective share in the domestic market at 37.54%, 43.20%, 39.40%, 54.40%, 48.12%, and 45.11%.
- At International box office each movie generated around $6.26.914.109 , $540.893.379 , $568.654.600 $378.979.068, $398.217.353, $417.671.251, $602,986.104 and $460.284.414 respectively.
By The Language Of Movies
 (Source: the-numbers)
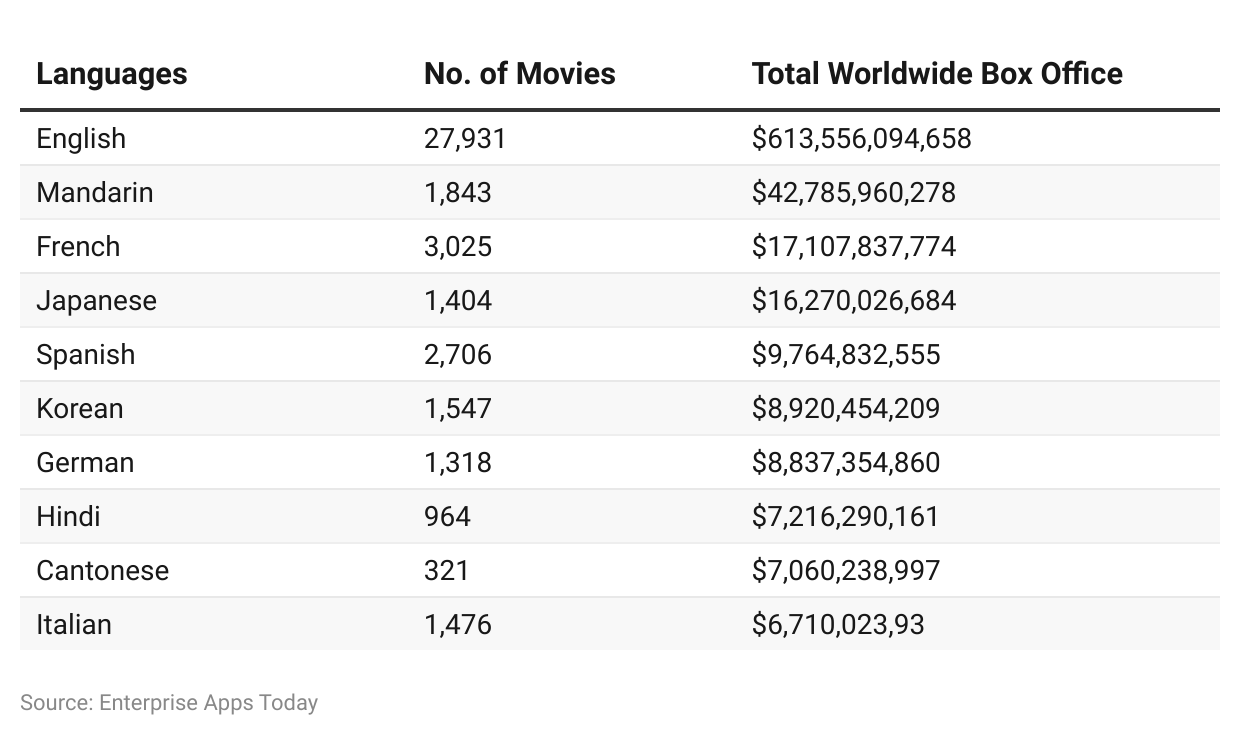
- The English language is the most used language around the worldwide box office movie releases as of 2022. It generated around $612,486,194,772 in revenue with 27,821 movies released in the English language.
- Mandarin is the second largest language used in movies resulting in 1,819 movies released in the year 2022 with total worldwide box office revenue of $41,474,715,274.
- The French language ranked third as per the Film Industry statistics with 3,015 movies released creating $17,103,721,124 of revenue.
- Other languages of movies ranked as the total worldwide box office rank are as follows Japanese $16,260,249,367 (1,394 movies released), Spanish $9,759,008,116 (2,693 movies released), Korean $8,839,865,540 (1,541 movies released), German $8,828,861,598 (1,300 movies released), Hindi $7,112,680,299 (955 movies released), Cantonese $7,032,317,264 (320 movies released), and Italian $6,697,369,534 (1,460 movies released).
By The Production Method
 (Source: the-numbers)
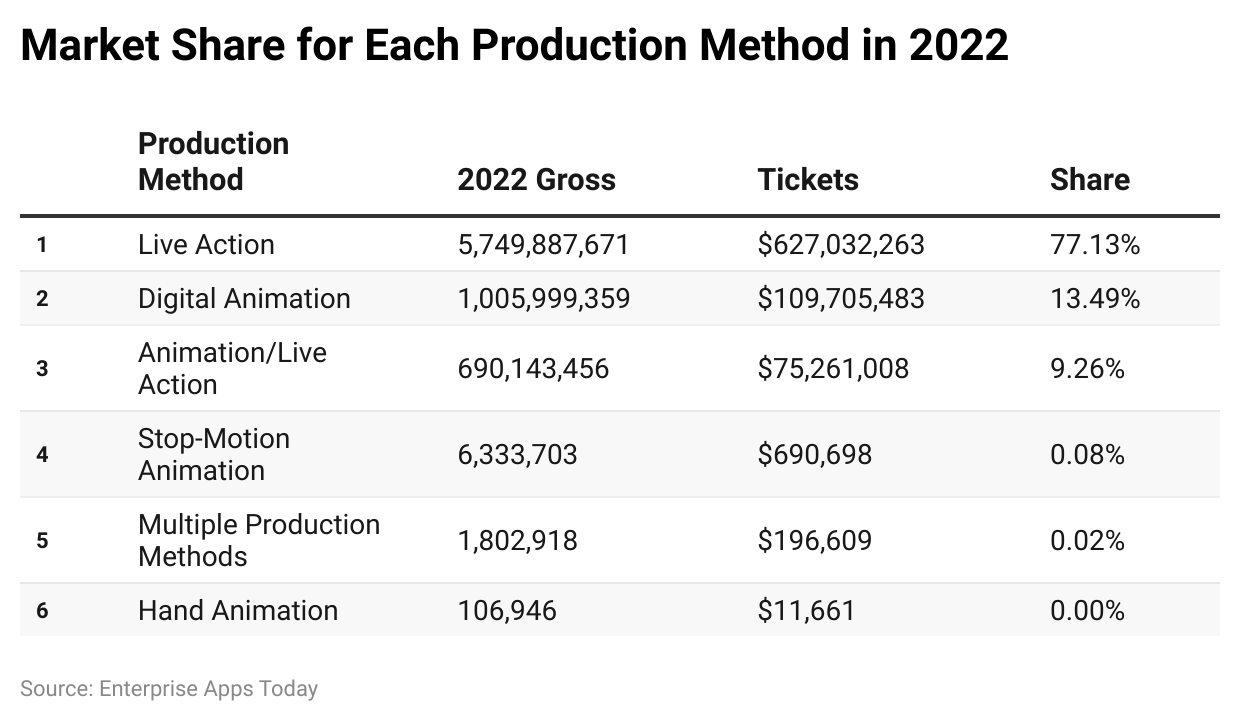
- As of 2022, Film industry statistics say that the live-action category was the highest-grossing type in product method resulting in $5,750,204,733 of overall revenue and 6,27,066,832 tickets sold in the domestic market in this genre.
- The films with a live-action production method recorded the highest share in the market 77.13% in the year 2022.
- The second largest type of film by production method in the domestic market as of 2022 is digital animation with a grossing revenue of $1,005, 999,359 and around 109,705,481 tickets sold.
- Digital animation has a market share in the production method of 13.49%.
- The third largest product method in the domestic market is an animation/live-action which sold overall 75,261,007 tickets by generating gross revenue of $690,143,456 by having a market share of 9.26%.
- Other methods in the similar market as recorded by film industry statistics of 2022 were stop-motion animation, multiple production methods, and hand animation.
- Each of the above three categories respectively sold overall tickets by 690.698, 196.609, and 11,661 with a market share of 0.08%, 0.02%, and 0.00% respectively.
Conclusion
Concluding the Film industry statistics, each region and country along with the chosen language of the film is helping to earn billions of revenue. Irrespective of the pandemic effects, the cinema sector is evolving every year with more and more technological developments. The entertainment sector is never dying, therefore, considering career opportunities is also well observed in the coming years.
Not only the United States of America, but India also has a major market share in the regional language of the movies. Hindi movies released in the year 2022 recorded a total revenue of $7,112,680,299 on a worldwide level. Thus, the movie industry is a trending industry in the entertainment sector around the world.

Barry is a lover of everything technology. Figuring out how the software works and creating content to shed more light on the value it offers users is his favorite pastime. When not evaluating apps or programs, he's busy trying out new healthy recipes, doing yoga, meditating, or taking nature walks with his little one.