
Identity Theft Statistics 2024 By Country, Consequences, Type of Crime and Demographics
Page Contents
- Introduction
- Editor’s Choice
- General Identity Theft Statistics
- Identity Theft Statistics by Region
- Identity Theft Statistics by Country
- Identity Theft Statistics by Attitude
- Identity Theft Statistics by Consequences
- Identity Theft Statistics by Type of Crime
- Top 10 Insurance by Direct Premiums Written
- Identity Theft Statistics by Demographics
- Identity Theft Statistics by Methods of Crime
- Identity Theft Statistics by Industry
- Identity Theft Statistics by Number of Consumer Complaints by Type
- Conclusion
Introduction
Identity Theft Statistics: Increasing digitalization and the use of online utilities is kind of posing a threat to the personal lives of many individuals. On average more than 50% of people around the world use the same password for all accounts and thus are more likely to face identity theft. Moreover, unknowingly sharing personal information such as Social Security number, date of birth, and name makes it easy for fraudsters to target people.
Following Identity Theft Statistics shows us how much the rate of such crimes has increased around the world over the past years. Keeping up to date with authentic sources is the best way to avoid any likely fraud.
Editor’s Choice
- By 2026, Identity Theft Statistics projections state that credit card fraud will be valued at USD 43 billion.
- 40% of Americans believe that when using public WiFi their personal information is at risk.
- Surprisingly, every 22 seconds, a person in the USA becomes a victim of identity theft.
- A person hit by such incidences spends on average 200 hours in 6 months to clear the records of the issues.
- Sharing passwords is one of the leading causes of identity theft in the USA, as 49% of Americans have a habit of sharing them.
- In 2023, in terms of synthetic identity fraud, there has been an increase of 52% compared to last year.
- According to Identity Theft Statistics 2023, the most followed event of identity theft is spending time resolving the issues by 43% of adults around the globe.
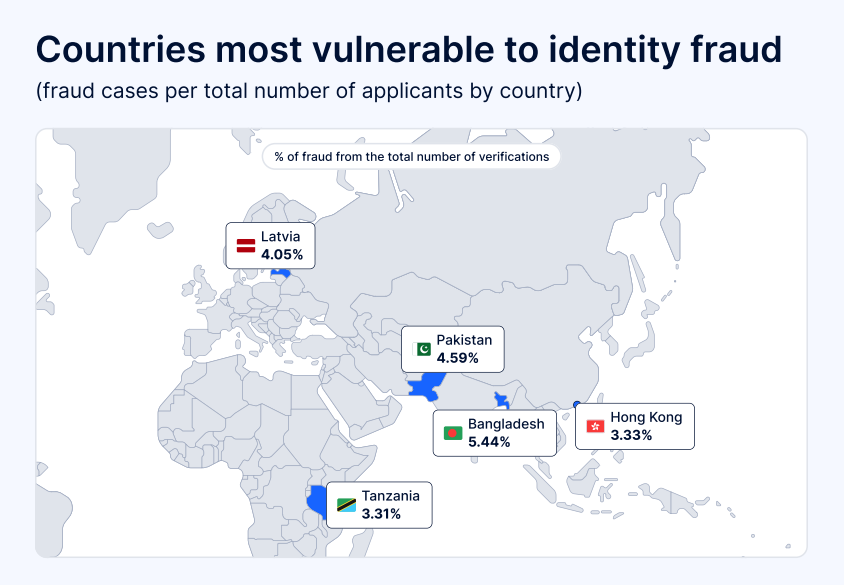
- As of 2024, the top 3 countries with the highest vulnerability toward identity theft are Bangladesh (5.44%), Pakistan (4.59%), Latvia (4.05%), Hong Kong (3.33%) and Tanzania (3.31%).
- The majority of the respondents to a survey conducted by Statista in 2023 said that they feel more vulnerable to identity theft as compared to the last few years contributing 68% of votes.
- 50% of identity theft attacks are more likely to happen after shopping online, as stated by 43% of Americans who experienced the same situation.
General Identity Theft Statistics
- 64% of individuals did not own any insurance when identity happened.
- 44% of persons took legal action after meeting with identity theft.
- According to a survey by US News and World Report 2023, 1 in 3 people have experienced a company data breach, making up 30% of all respondents.
- Every year, more than 300,000 Americans become victims of phishing.
- 87% of individuals unknowingly provide personal information on the internet.
- 40% of Americans believe that when using public WiFi their personal information is at risk.
- 50% of identity theft attacks are more likely to happen after shopping online, as stated by 43% of Americans who experienced the same situation.
- Identity Theft Statistics surveyed that 50% of Americans are not likely to trust family members in the case of any financial losses.
- Individuals in their 30s are more likely to be a victim of identity theft.
- Sharing passwords is one of the leading causes of identity theft in the USA, as 49% of Americans have a habit of sharing them.
- On average, every year there are 14.5 billion Americans become victims of identity fraud which is 30% of total US adults, giving $2 billion in consumer loss.
- The average fraud amount per victim identified by Identity Theft Statistics is $320.
- By 2027, it is expected that the identity theft protection market will grow at a CAGR of 13.7%.
- Surprisingly, every 22 seconds, a person in the USA becomes a victim of identity theft.
- In 2022, more than 40 million Americans became victims of identity fraud scams.
- On the other hand, 33% of Americans have become victims at some point in their lives.
- By 2026, Identity Theft Statistics projections state that credit card fraud will be valued at $43 billion.
- 1 out of 50 children become victims of identity theft. On average the cost of this incident is $737 per family, making it $1 billion a year.
- A person hit by such incidences spends on average 200 hours in 6 months to clear the records of the issues.
- As of today, 74% of people experienced extreme levels of stress while 60% had anxiety.
- 33% of the global population makes purchases online.
- Around the globe, as of today, 86% of individuals have become victims of identity theft at least once in their lifetime.
- 26% of victims are more likely to be repeat victims.
- In 2022, the new account fraud cost was valued at $8.8 billion.
- By 2027, estimates state that the number of fraudulent transactions will be valued at $40.62 billion.
- As per Identity Theft Statistics, a stolen identity with a social security number, date of birth, and name is more likely to be sold on the dark web for $60 to $80.
- It takes on average 30 days to discover a fraudulent account.
- As of 2023, the top 5 worst states in the USA for most filed identity theft complaints per capita (1000 residents )were: Washington D.C (261), Georgia (253), Florida (240), Nevada (213), and Delaware (207).
- On the other hand, comparatively safer states in the USA on the same method of calculation were Vermont (51), South Dakota (52), Montana (53), Wyoming (61), and West Virginia (61).
- Users with active social media accounts are 30 to 46% more likely to experience identity theft fraud.
Identity Theft Statistics by Region
(Source: fintechnews)
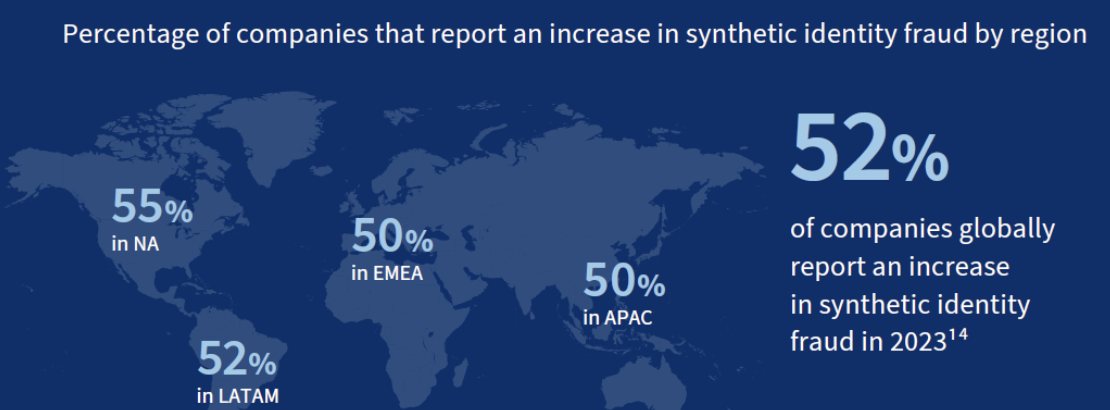
In 2023, in terms of synthetic identity fraud, there has been an increase of 52% compared to last year. Similarly, Identity Theft Statistics 2024 states that, around the globe, there has been more than a 50% increase in crimes contributing as follows APAC (50%), EMEA (50%), LATAM (52%), and North America (55%).
Identity Theft Statistics by Country
By Total Number of Victims
(Reference: statista.com)
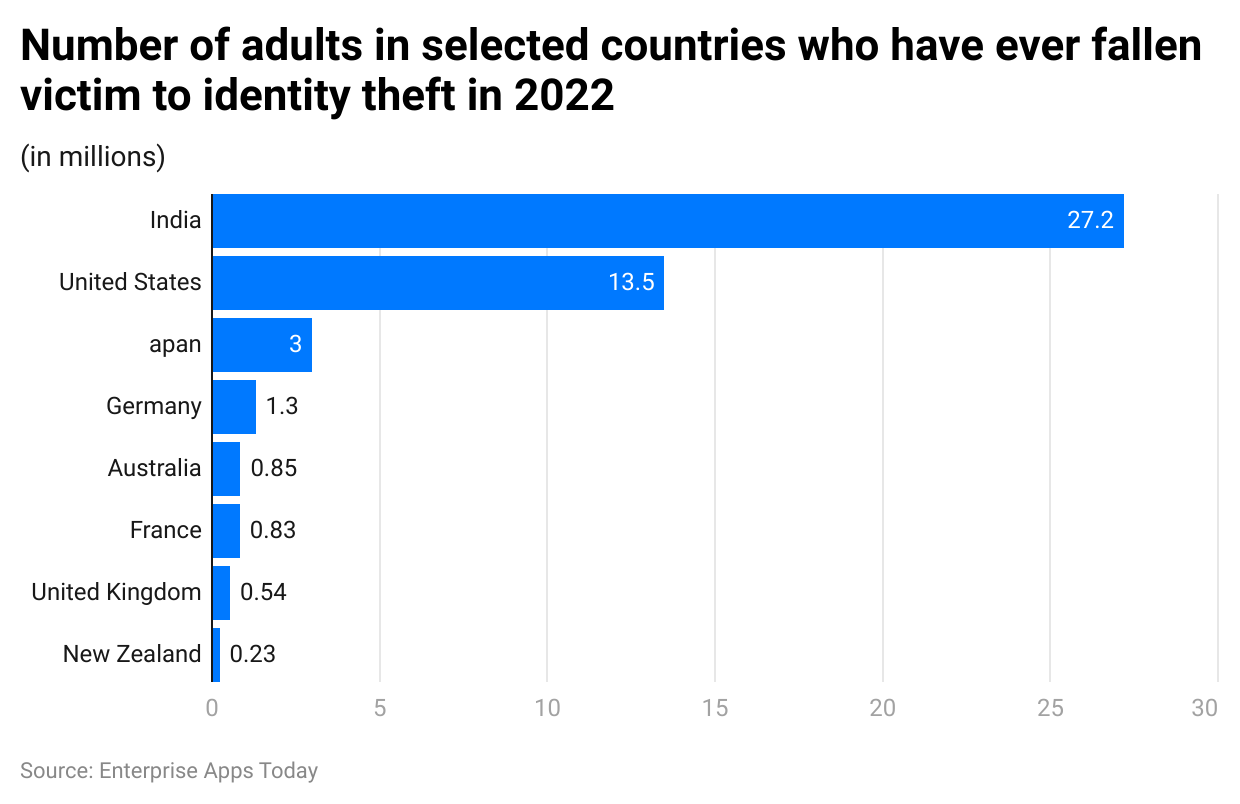
According to Identity Theft Statistics 2022, the highest number of cases were registered in India contributing 27.2 million. The United States followed the list by 13.5 million and Japan experienced 3 million identity theft cases. In the list of selected countries, New Zealand comparatively encountered 0.23 thousand cases.
By Vulnerability
(Source: fintechnews)
As of 2024, the top 3 countries with the highest vulnerability toward identity theft are Bangladesh (5.44%), Pakistan (4.59%), Latvia (4.05%), Hong Kong (3.33%) and Tanzania (3.31%).
Identity Theft Statistics by Attitude
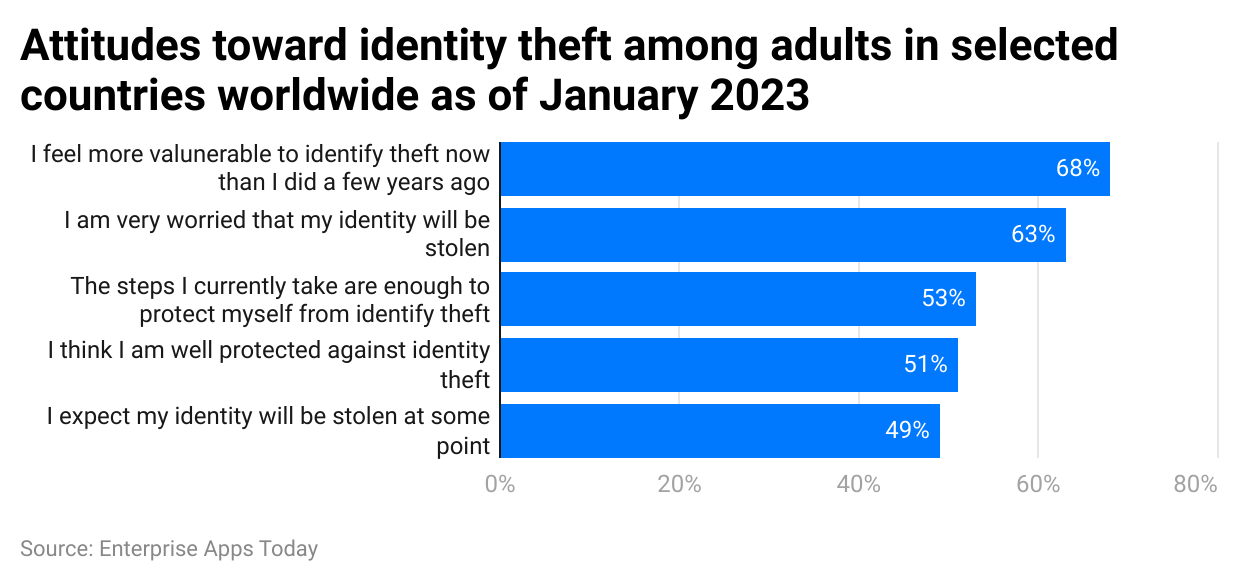
(Reference: statista.com)
The majority of the respondents to a survey conducted by Statista in 2023 said that they feel more vulnerable to identity theft as compared to the last few years contributing 68% of votes. 63% of individuals were worried about their identity being stolen. Furthermore, more than half of the respondents said they have taken enough steps to protect themselves from such events and some said they are well protected. 49% of the respondents were worried about their identity being stolen at some point in their life.
Identity Theft Statistics by Consequences
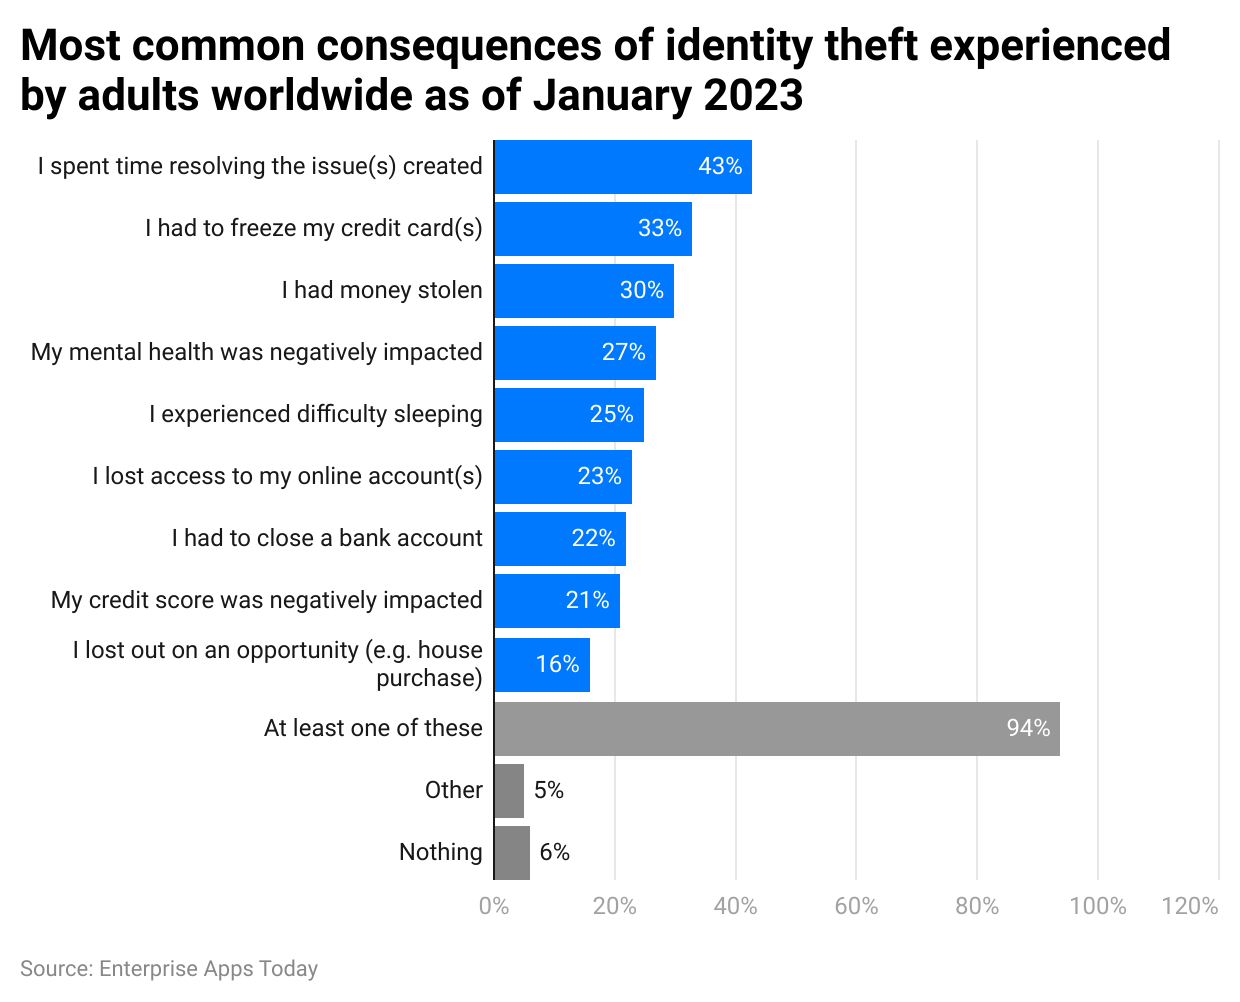
(Reference: statista.com)
According to Identity Theft Statistics 2023, the most followed event of identity theft is spending time resolving the issues by 43% of adults around the globe. 33% of individuals had to freeze their credit cards. Unfortunately, 27% of individuals faced mental health issues, while 25% disturbed their sleep cycles. On the other hand, 6% of respondents to a survey by Statista did not do anything at all.
Identity Theft Statistics by Type of Crime
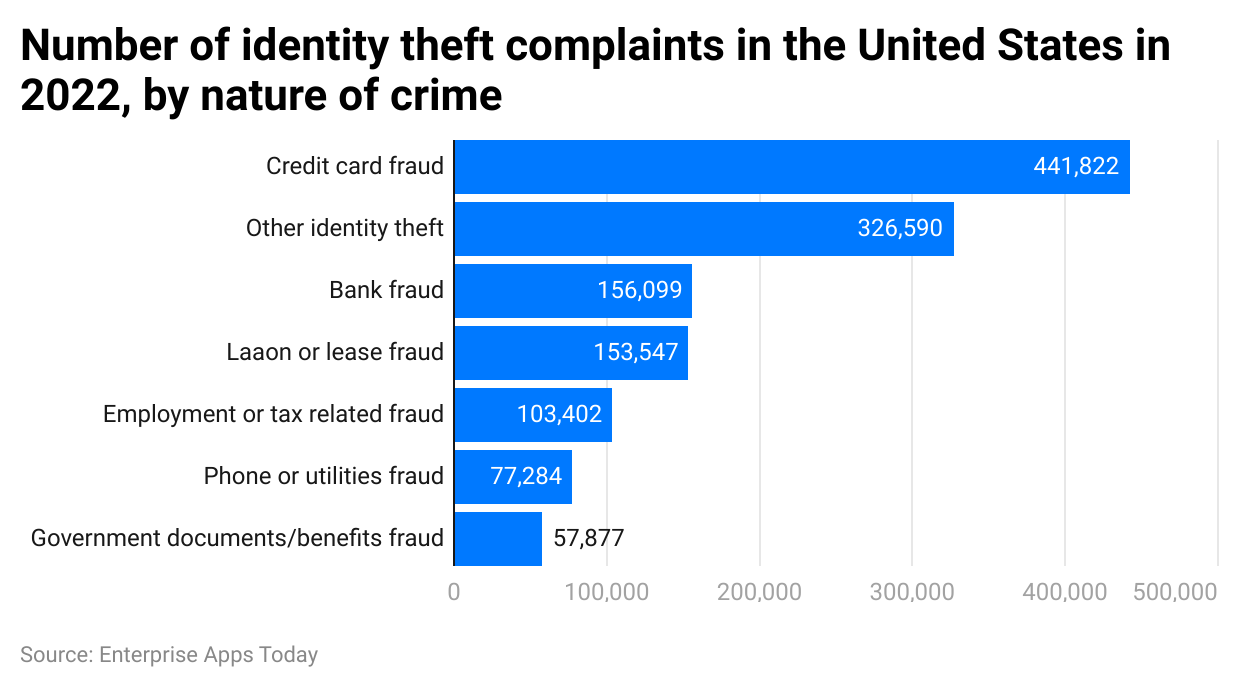
(Reference: statista.com)
In the USA, as identified by Identity Theft Statistics 2022, there were credit card fraud events registered with 441,822 cases. Other types of crimes that followed in the list in 2022 were other (326,590), Bank fraud (156,099), Loan or lease fraud (153,547), Employment or tax-related fraud (103,402), Phone or utility fraud (77,284), and government documents or benefits fraud (57,877).
By Percentage
- Credit card frauds – New or existing accounts (32.3%)
- Employment or tax-related fraud (5.5%)
- Bank fraud – new or old account, ACH, electronic funds, or debit cards (7.3%)
- Phone and Utilities fraud – Landing (new or old accounts), mobile (new or old accounts), utilities (new or old accounts) – 11%
- Government documents or benefits fraud – driver’s license (forged or issued), passport (forged or issued), government benefits applied (for or received), other government documents (forged or issued) – 3%
- Loan or Lease fraud – Real estate loan, federal student loan, non-federal student loan, auto loan or lease, apartment or house rented, business or professional loan (14.4%).
- Other identify theft cases – insurance, evading law, social media, email, online shopping, payment accounts, medical services, securities accounts, and others (26.5%).
By Age Group
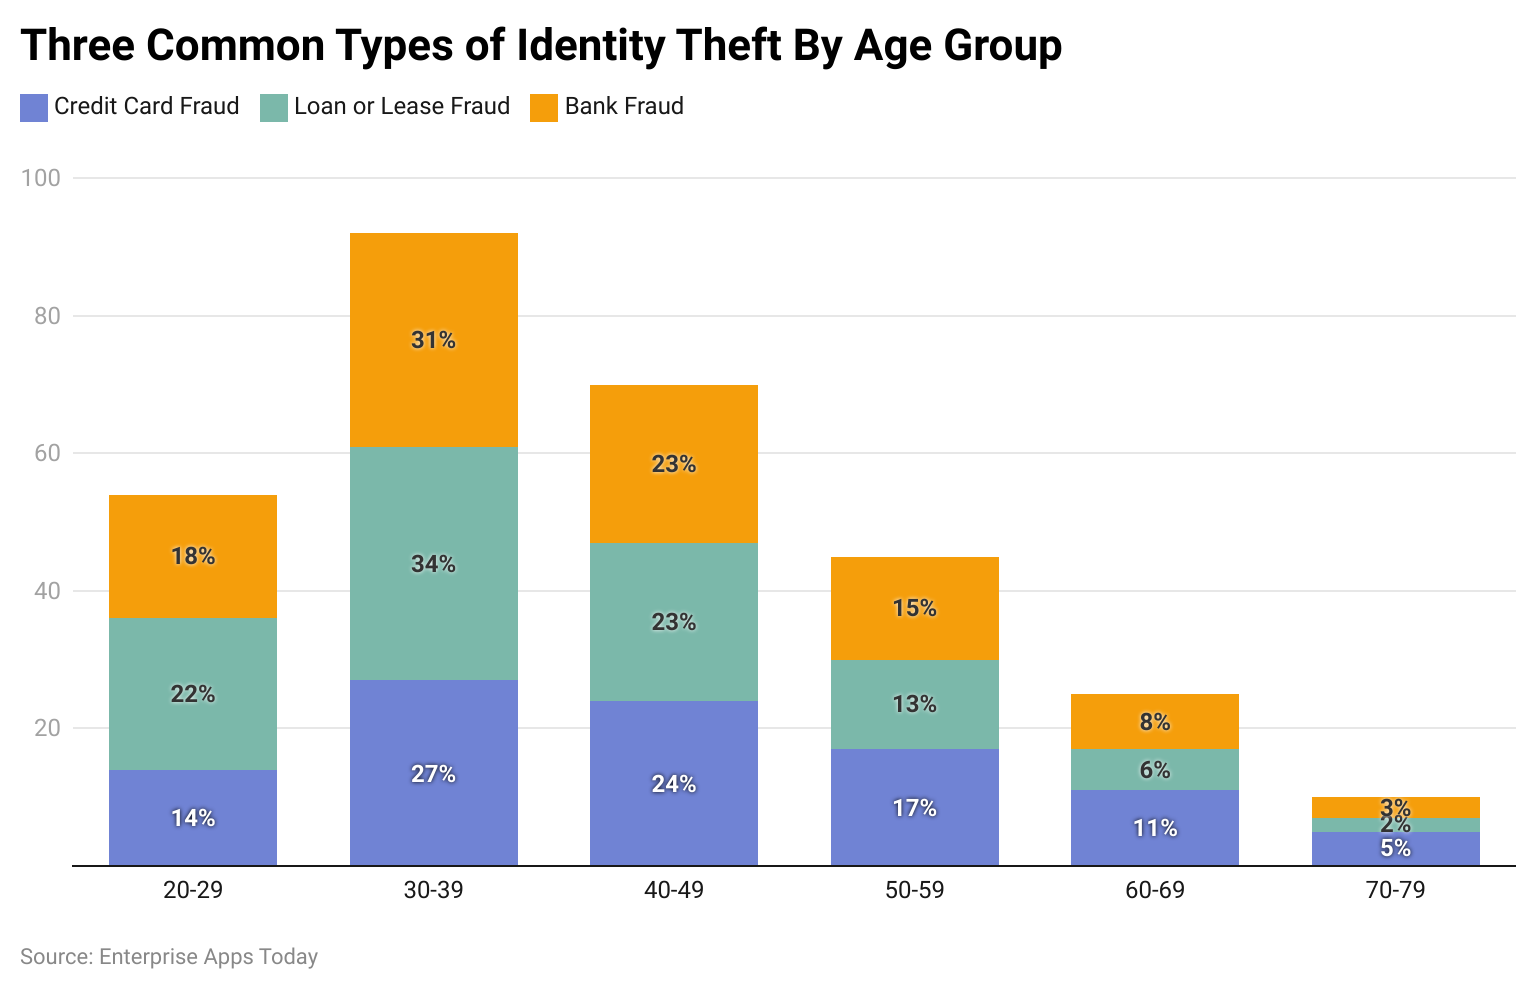
(Reference: forbes.com)
As of 2022, in case of loan or lease fraud, bank fraud, and credit card fraud the largely targeted age group was 30 to 39 years. On the other hand, individuals aged between 70 to 79 years were comparatively on the safer side, with less than 5 and 5% of the number of cases. Bank fraud is less likely to occur in all age groups as compared to loan or lease fraud and credit card fraud.
By Document Type
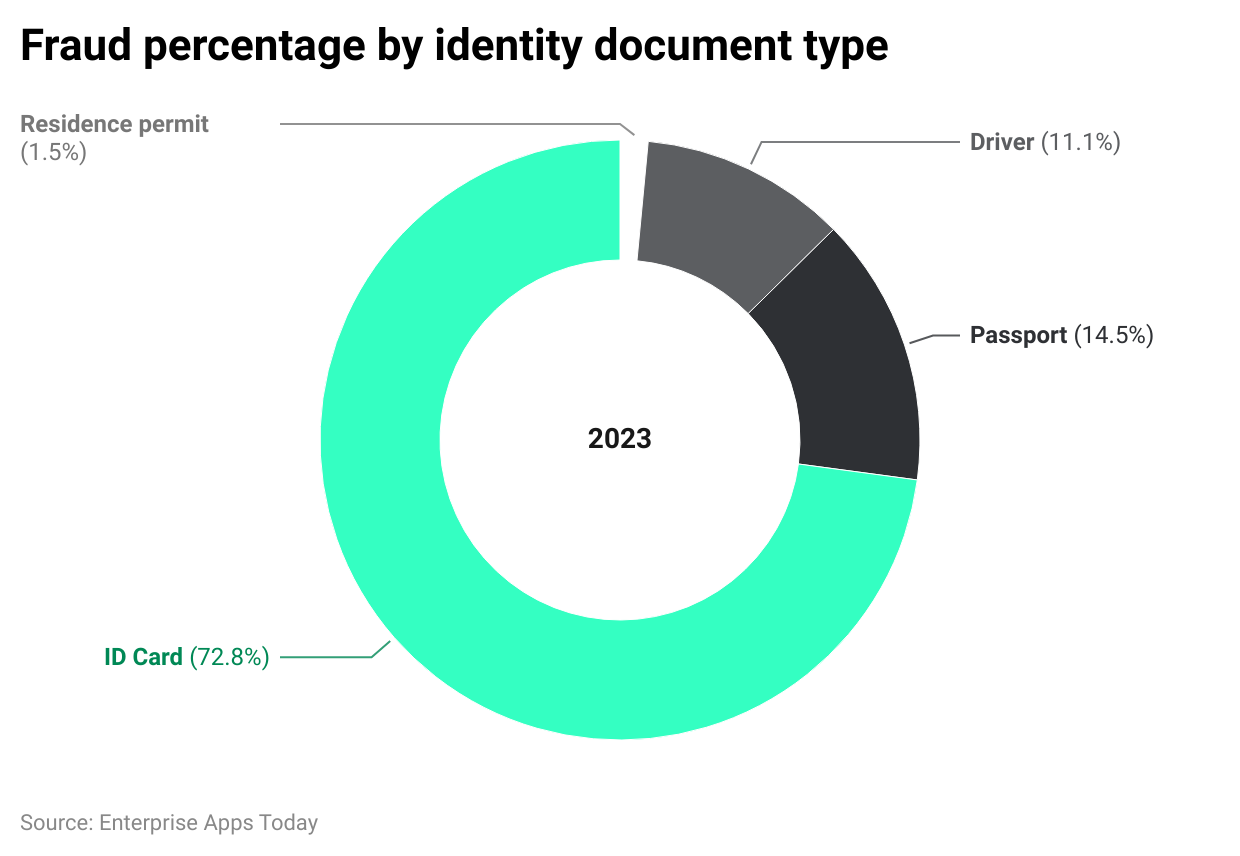
(Source: sumsub.com)
Considering the Identity Theft Statistics 2023, fraud cases through ID cards contributed the highest as compared to other types of documents resulting in 72.8%, followed by passports (14.5%), driver licenses (11.1%), and residence permits (1.5%).
Top 10 Insurance by Direct Premiums Written
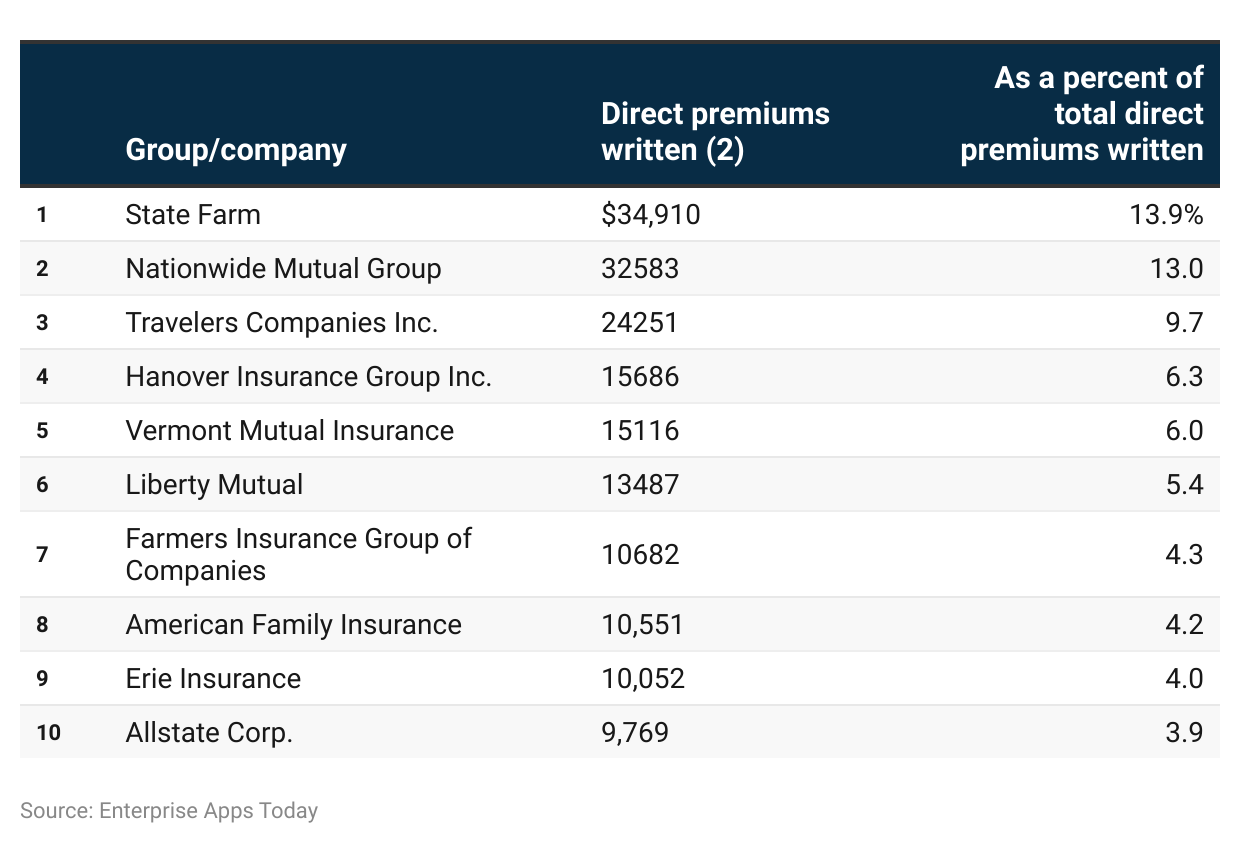 (Reference: iii.org)
As of 2022, in the case of identity theft insurance policies, the total payable amount by a customer for the chosen insurance coverage is direct premiums written. State Farm, Nationwide Mutual Group, Travelers Companies Inc., Hanover Insurace Group Inc., and Vermont Mutual Insurance are the top 5 companies for direct premiums written.
Identity Theft Statistics by Demographics
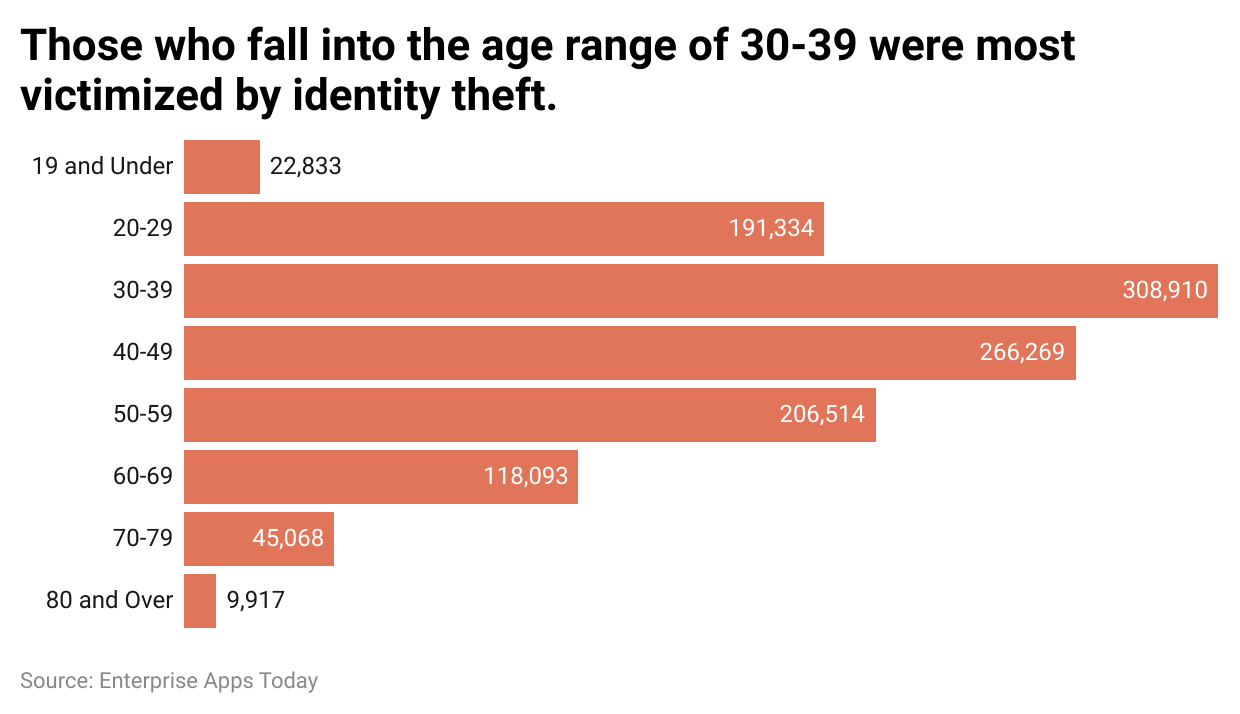
(Reference: identitytheft.org)
The most number of identity theft victims are aged between 30 to 39 years resulting in 308,910 total cases in the USA last year. Surprisingly, there were 22,833 events occurred among young people aged 19 years and below. Overall, individuals in every age group have unfortunately faced such crimes.
Identity Theft Statistics by Methods of Crime
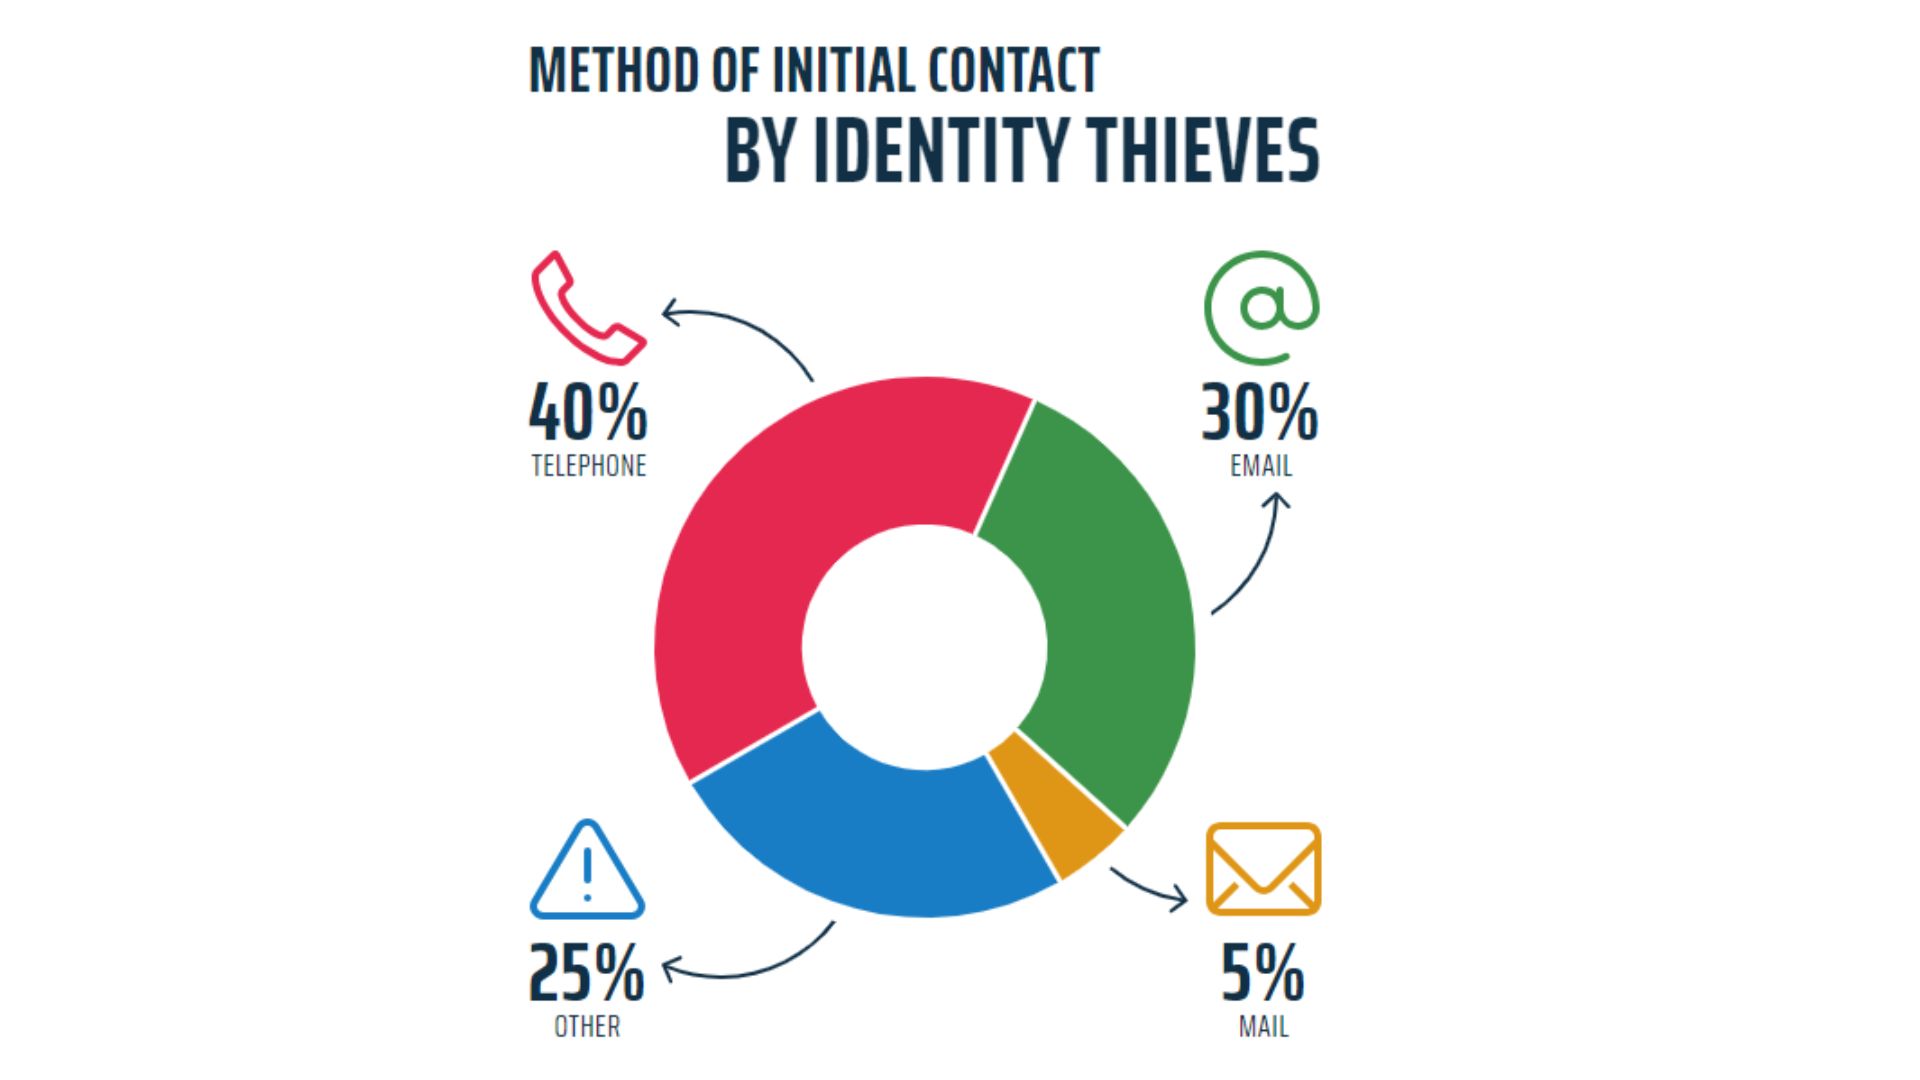
(Source: idstrong.com)
The most common method of identity theft by identity thieves is through telephone (40%). 30% of thefts are performed through emails, while 5% belong to mail. 25% of events took place through n number methods.
Identity Theft Statistics by Industry
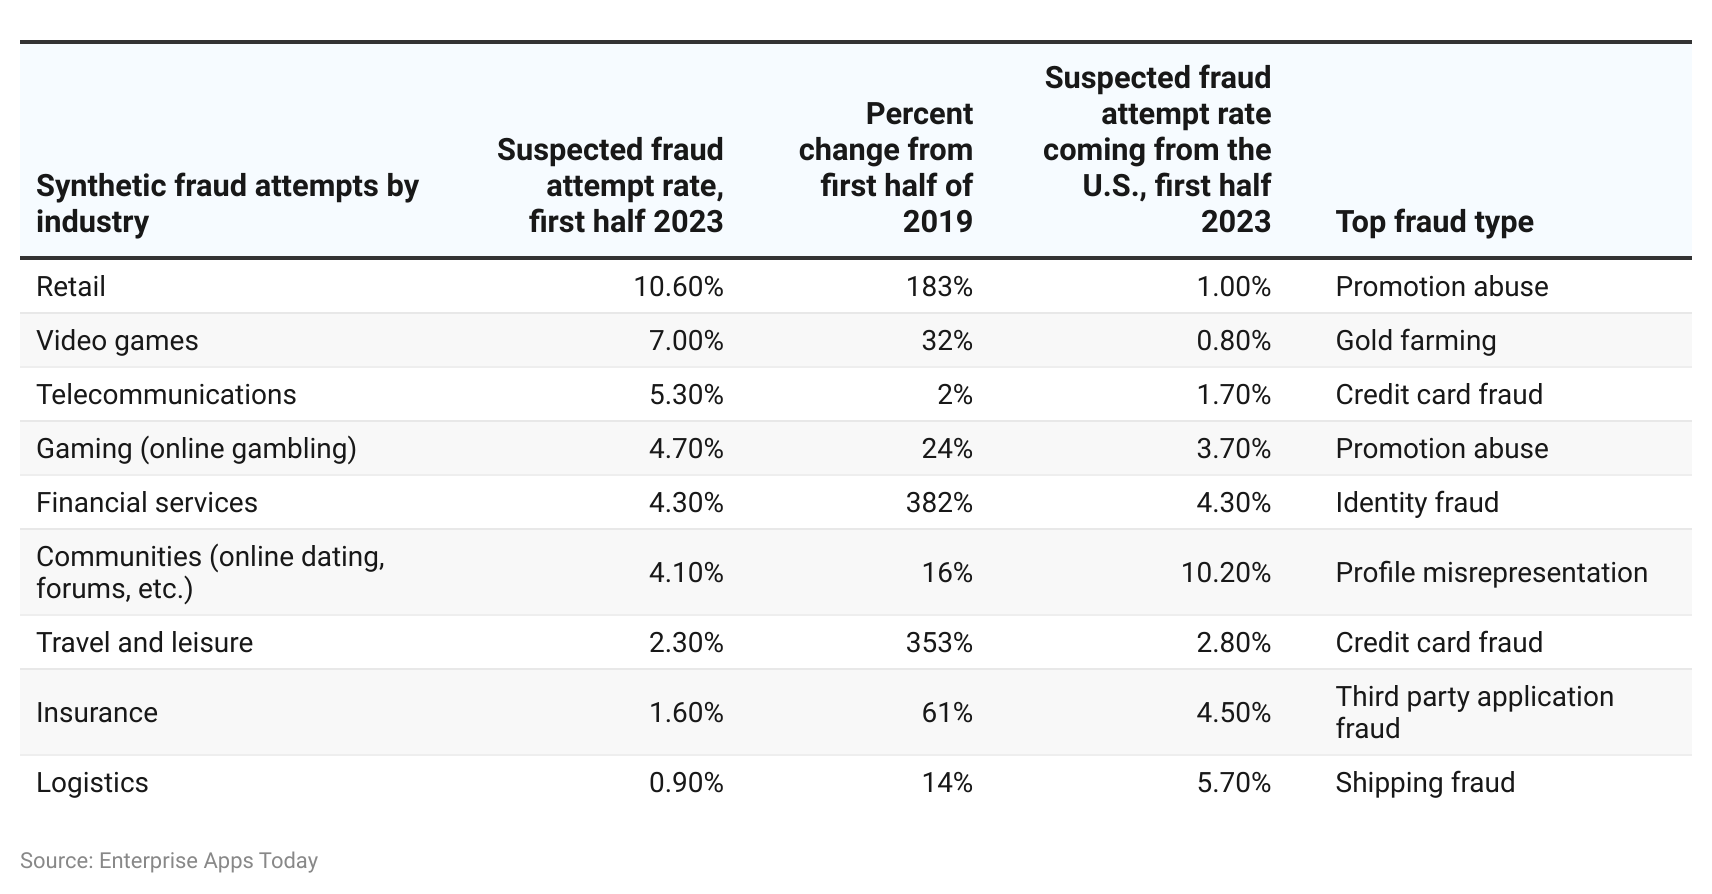 (Source: fool.com)
According to Identity Theft Statistics 2023, the retail industry has the highest rate of suspected fraud attempts contributing 10.60%. The target is promotion abuse. Looking at the above chart, the majority of the frauds are conducted online. Other types of industries involved in such unfortunate events are Video games (7%), Telecommunications (5.30%), Gaming (Online Gambling – 4.70%), Financial services (4.30%), Communities (4.10%), travel and leisure (2.30%), insurance (1.60%) and logistics (0.90%).
Identity Theft Statistics by Number of Consumer Complaints by Type
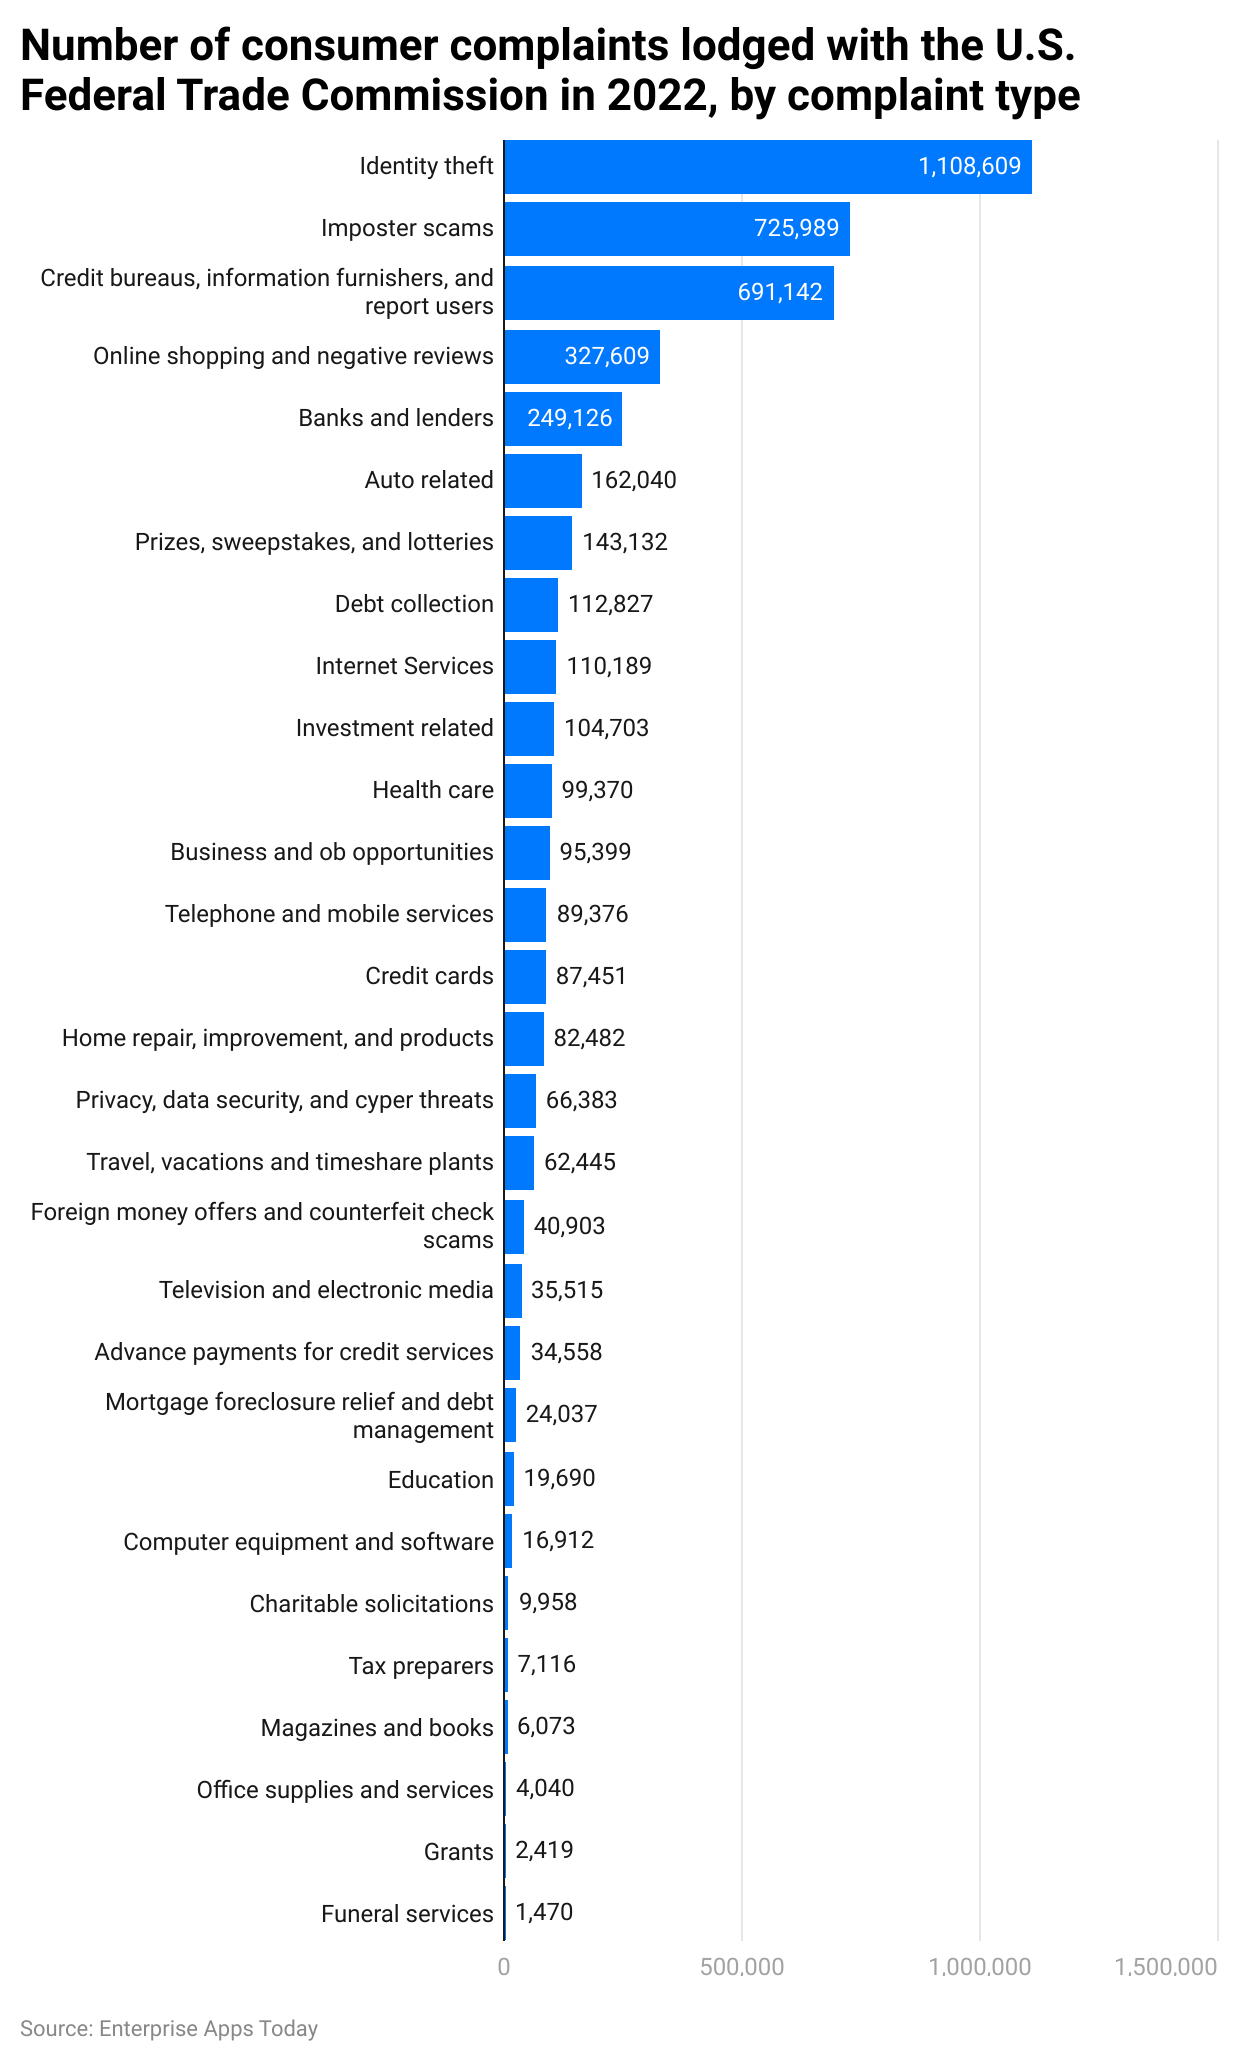
(Reference: statista.com)
In 2022, the US Federal Trade Commission recorded the most complaint types in Identity theft cases resulting in 1,108,609. Imposter scams were other types of trending complaint types with 725,989 in total.
Conclusion
With the rise in digitalization, Identity Theft Statistics proved the rise in online fraud as well. Unfortunately, not everyone understands the authenticity of the source on which they are submitting their personal information and this is when the time starts ticking. Credit card and loan fraud have tremendously increased in the past few years.
Not only this, but AI technologies such as Deppfakes pose a great risk to any individual’s personal information and identity. To safeguard our digital identity, we have to make sure that we do not share our passwords, and don’t fall prey to any convincing email sent from unknown sources.
FAQ.
Stealing antransactions, or posing as another person to get a loan, etc is called identity theft. other person’s personal information to commit fraud for example completing unauthorized purchases or
Date of birth, social security number, and a credit card are some examples of identity theft.
To avoid identity theft, it is important to understand the authenticity of the sender when an email is received. The majority of such cases take place on calls, thus it is always better to avoid unknown callers asking for personal information, or callers posing as banks or any insurance companies. And most importantly keep personal and private information to yourself such as passwords, social security numbers, etc.
The following are the types of identity theft:
- Synthetic Identity theft (creation of new identity from stolen information)
- Child Identity theft (using a child’s identity to perform frauds such as gaining residence, avoiding arrest warrant, and obtaining loans)
- Criminal Identity theft (posing as another person to prevent arrest)
- Tax Identity Theft (filing bogus tax returns in the name of the third person to obtain monetary benefit)
- Financial Identity Theft (To get goods or services, credit or any other benefits obtained from another person’s details)
- Medical Identity Theft (To get free medical care posing as another person)
- Social Security Identity Theft (stealing personal details to get credit cards, loans and create outstanding amounts, etc )

Barry is a lover of everything technology. Figuring out how the software works and creating content to shed more light on the value it offers users is his favorite pastime. When not evaluating apps or programs, he's busy trying out new healthy recipes, doing yoga, meditating, or taking nature walks with his little one.