
Part-time Vs Full-time Employment Statistics 2024 – By Demographic and Ethnicity
Page Contents
- Introduction
- Editor’s Choice
- Facts About Part-time Vs Full-time Employment Statistics
- What Is Part-Time Employment?
- What Is Full-Time Employment?
- Benefits Of Part-Time Employment
- Cons of Part-Time Employment
- Benefits of Full-Time Employment
- Cons of Full-Time Employment
- General Part-time Vs Full-time Employment Statistics
- By Geographic
- By Demographic
- By Ethnicity
- Part-time Vs Full-time Employment Trends
- Part-time Vs Full-time Employment Recent Development
- Conclusion
Introduction
Part-time Vs Full-time employment statistics: In recent years, the prevalence of part-time employment has been notable. According to data from the Bureau of Labor Statistics (BLS), approximately 27% of employed individuals in the United States worked part-time in 2021. This figure accounts for those who work fewer than 35 hours per week.
On the other hand, full-time employment remains a cornerstone of the workforce. BLS data reveals that around 73% of employed individuals in the U.S. held full-time positions in 2021, typically working 35 hours or more per week.
While full-time employment often offers more stable income and benefits, part-time workers may experience income disparities. The median weekly earnings for full-time workers in 2021 were approximately USD 957, while part-time workers earned about USD 288 per week, according to BLS statistics.
Employment patterns also vary across industries. For instance, sectors such as retail, hospitality, and healthcare often rely heavily on part-time workers to meet fluctuating demand, while industries like finance and technology may predominantly offer full-time positions.
Editor’s Choice
- Women constitute 63% of part-time workers, indicating a significant gender disparity in part-time employment.
- Globally, 80% of individuals aged 16 to 17 years engage in part-time employment, showcasing a prevalent trend among younger age groups.
- In the U.S., over 26 million people work part-time, with 14 million being women over the age of 20.
- Part-time retail employees make up 29% of the overall retail workforce, while the food industry employs 32.8% part-time workers.
- The education and health services industry employs 5.9 million part-time workers.
- Part-time developers earn an average of USD109,905 annually.
- As of January 2023, there are approximately 27.52 million part-time workers in the U.S.
- Part-time workers constitute 17% of the employed U.S. workforce as of 2020.
- The primary reason people choose to work part-time is to attend school or training programs, reflecting educational pursuits as a significant factor.
- 77% of employed individuals globally are full-time workers, amounting to 23,090,600, while 23% are part-time workers, totaling 6,894,900.
- The hospitality and leisure industry sees 46% of its workforce employed part-time.
- The lowest weekly working hours for full-time employment are 28 hours, while the highest are almost 50 hours.
- In 2021, 41.4% of women and 81.8% of men were employed full-time.
- There are 14 million women over the age of 20 who hold part-time jobs, contributing significantly to the part-time workforce.
You May Also Like To Read
- Part-time Vs Full-time Employment Statistics
- Women In Technology Statistics
- Bureau of Labor Statistics
- Remote Work Statistics
- Vacation Rental Statistics
- Career Change Statistics
- Job Growth Statistics
- Job Interview Statistics
- Women Entrepreneurship Statistics
Facts About Part-time Vs Full-time Employment Statistics
- Part-time employment is prevalent among women, constituting 63% of part-time workers.
- Globally, 80% of individuals aged 16 to 17 years engage in part-time employment.
- In the U.S., over 26 million people work part-time, with 14 million being women over 20.
- Part-time retail employees make up 29% of the overall retail workforce.
- The food industry employs 32.8% part-time workers.
- The education and health services industry has 5.9 million part-time workers.
- Part-time developers earn an average of USD 109,905 annually.
- As of January 2023, there are approximately 27.52 million part-time workers in the U.S.
- Part-time workers constitute 17% of the employed U.S. workforce as of 2020.
- The hospitality and leisure industry sees 46% of its workforce employed part-time.
- The lowest weekly working hours for full-time employment are 28 hours, while the highest are almost 50 hours.
- In 2021, 41.4% of women and 81.8% of men were employed full-time.
- There are 14 million women over the age of 20 who hold part-time jobs.
What Is Part-Time Employment?
Part-time employment can be considered working for at least 30 hours or 35 hours per week. This is a traditional form of nonstandard employment. Mostly, part-time employees are either students or women.
What Is Full-Time Employment?
In full-time employment, employees are working double hours as part-time workers. Full-time employment working hours are different according to the country and as well as the companies in one country. It is possible that a single country could have various hours of full-time employment hours. For example, 7:30 hours a day or simply 9 hours a day.
Benefits Of Part-Time Employment
- Depending on the resident country’s policies, people with part-time employment can do more than 1 job, which allows multiple income sources.
- It provides work-life balance.
- Since the pandemic, the majority of part-time employees are either working from home or from remote locations, which saves fuel costs
- Part-time employment provides mental peace, increases career opportunities, and provides the chance to do extra activities.
- Part-time employment is a major income source for students and housewives to some extent.
- This type of employment is a good source of income to run daily expenses for students.
Cons of Part-Time Employment
- Part-time employment is not always counted as work experience.
- The salary received from these kinds of jobs can be too low for four hours of work.
- This type of employment is only suitable for students since women who have a family can earn less than desired.
- Part-time employment provides no job security.
- There are no employment perks such as parties, insurance, leaves, etc.
Benefits of Full-Time Employment
- Full-time employment provides a stable income.
- It gives access to various types of covered insurance.
- International opportunities in full-time employment are provided.
- Work recognition with certificates
- Higher income than part-time employment
- Fixed working schedule
- People gain a countable work experience in their resumes
Cons of Full-Time Employment
- Full-time employment has unstable work and life balance.
- Full-time employment may compel you to do repetitive tasks which could lead to problems in employee retention.
- These kinds of employment have a high number of notice periods which causes problems in finding new jobs.
- Not all full-time employees have satisfied salary brackets.
General Part-time Vs Full-time Employment Statistics
Part-Time Employment Statistics
- Around the world, 80% of people from the age of 16 years to 17 years work part-time jobs.
- 52% of the people are from the age group of 18 years to 19 years.
- Moreover, 35% are from the Baby Boomers Club and are above the age of 65 years working in part-time jobs.
- 63% of the women are part-time employees.
- According to Part-time vs. full-time employment statistics, married women are more likely to work part-time.
- Around the globe, 79% of insurance companies offer health insurance to part-time employees.
- 46% of the employees in the hospitality and leisure industry are part-time workers.
- More than 25 million worked part-time in the year 2022.
- 28% of the female part-time employees gave the reason for the employment type as a family or personal obligations.
Full-Time Employment Statistics
- 4% of employees around the world are full-time employees.
- There are 38 member regions in OECD (Organization for Economic Co-Operation and Development) countries, following charts show the total working hours in OECD countries as per the Part-time vs. full-time employment statistics.
- As of the year 2021, 41.4% of the women & and 81.8% of the men full-time were full-time employed.
- In the European Union, there were 158.9 million full-time workers.
By Geographic
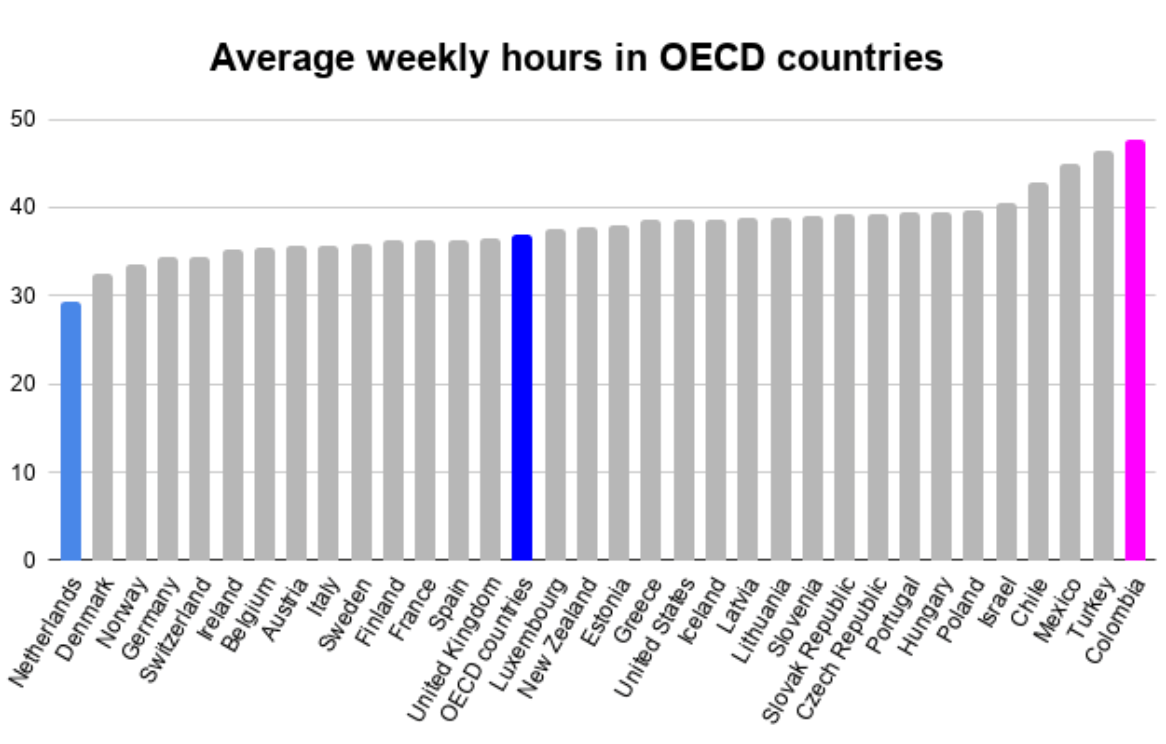
(Source: Clockify)
- Weekly average hours for full-time employment is lowest of all in the Netherlands whereas, Colombia has the highest number of weekly working hours as per the studies by Part-time vs. full-time employment statistics.
- The lowest working hours are around 28 hours and the highest working hours for full-time employment are almost 50 hours.
- On the other hand, the majority of the average weekly working hours are below 40 hours.
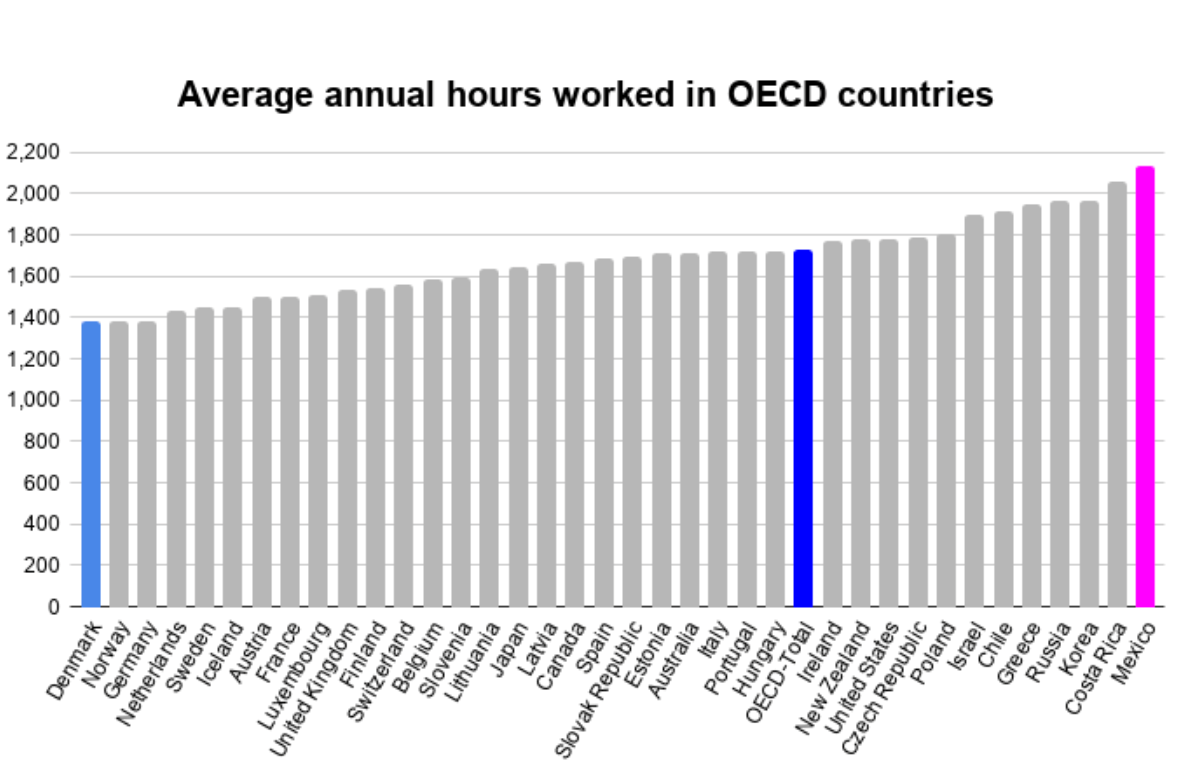
(Source: Clockify)
- On the other hand, the full-time working hours in Denmark are the lowest than any other with almost reaching 1400 hours every year.
- Whereas, Mexico has the highest annual full-time working hours with more than 2,000 hours a year.
- Part-time vs. full-time employment statistics show that the majority of the countries are offering average annual hours are around 1800.
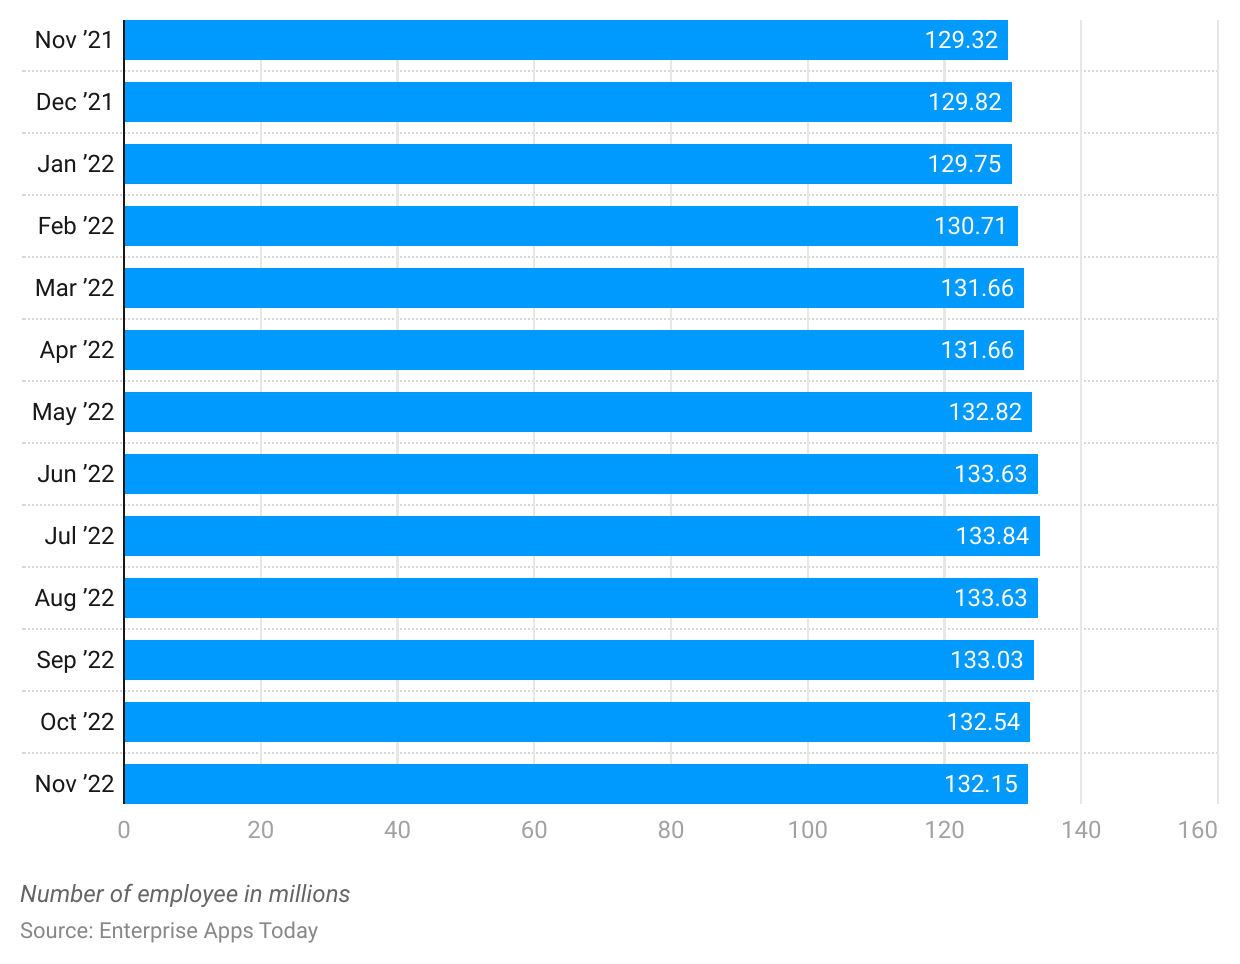
(Source: Statista)
- According to the Part-time vs. full-time employment statistics in November 2021, there were 129.32 million full-time employees in the United States of America.
- The number of 129 million full-time employees stayed persistent till January 2022, and in February 2022, it rose to 130.71 million.
- Two months after February 2022, the United States of America had 131 million full-time employees with an increasing rate in number to 133 by September 2022.
- Again, in October 2022, the total number of employees reduced to 132 million staying almost similar in November 2022.
By Demographic
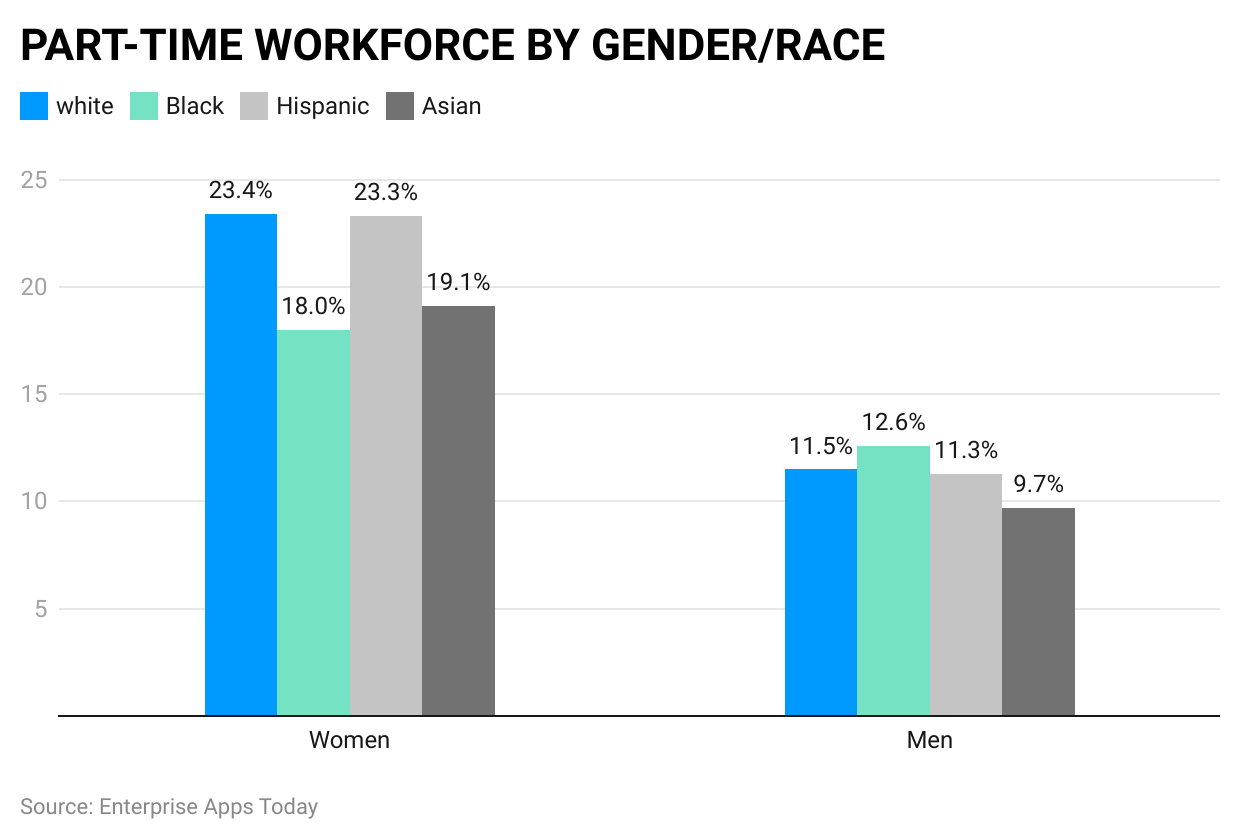
(Reference: Zippia)
- Women have the highest percentage of part-time employment than men. There are 23.4% of white, 18% black, 23.3% Hispanic, and Asian are 19.1%.
- Whereas men are around 11.5% white, 12.6% black, 11.3% Hispanic, and 9.7% Asian people.
- As seen in the above chart, irrespective of gender and ethnic group women tend to work more in part-time employment than men in the overall world.
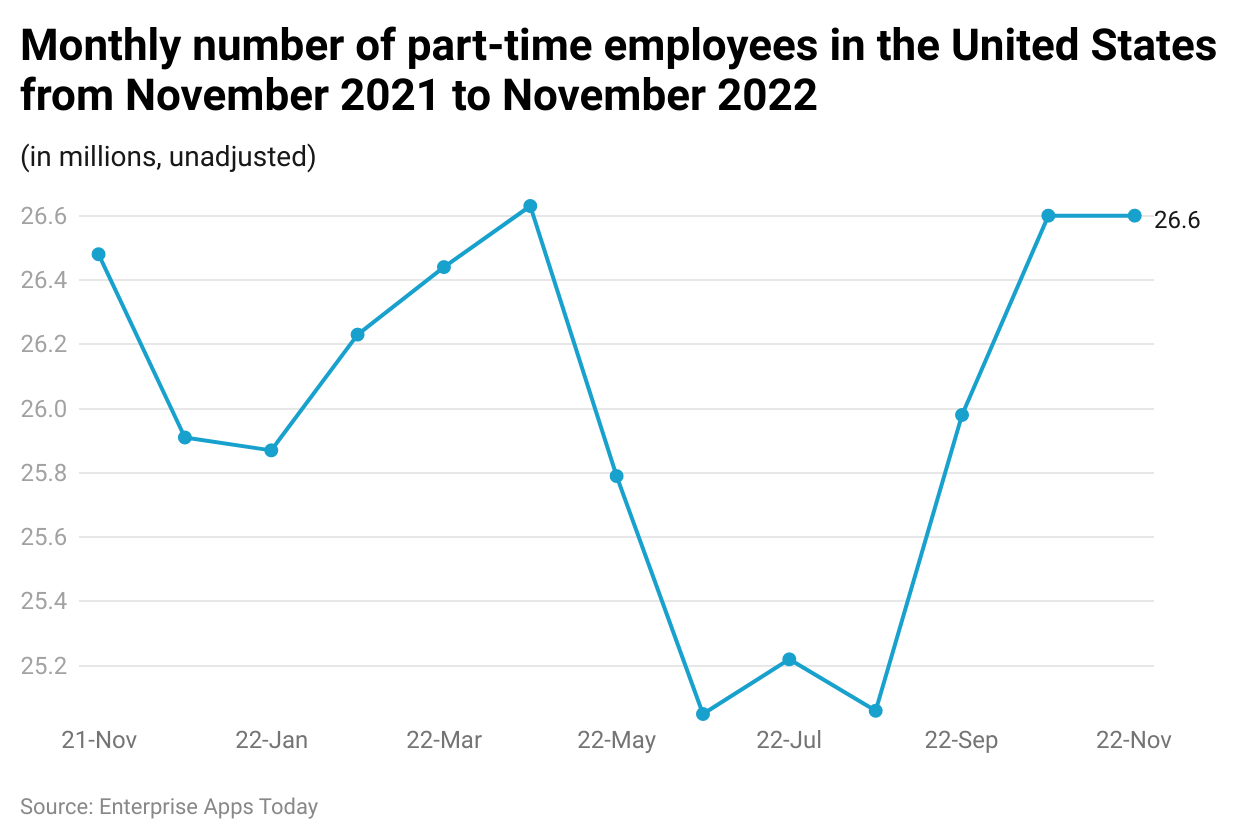 (Reference: Statista)
- In the United States of America, the number of part-time employees is stable from 25% to almost 27% from November 2021 to November 2022.
- The rate of part-time employees can be seen fluctuating from 26.46% with a drastic decrease in the percentage to 25.05 in June 2022.
- The percentage increased to 26.6 which stood stable from September 2022 to November 2022, as stated by the Part-time vs. full-time employment statistics.
- Moreover, the Part-time vs. full-time employment statistics show that the number of part-time employees was the lowest from June 2022 to September August, with numbers fluctuating from 25.05 to 25.06.
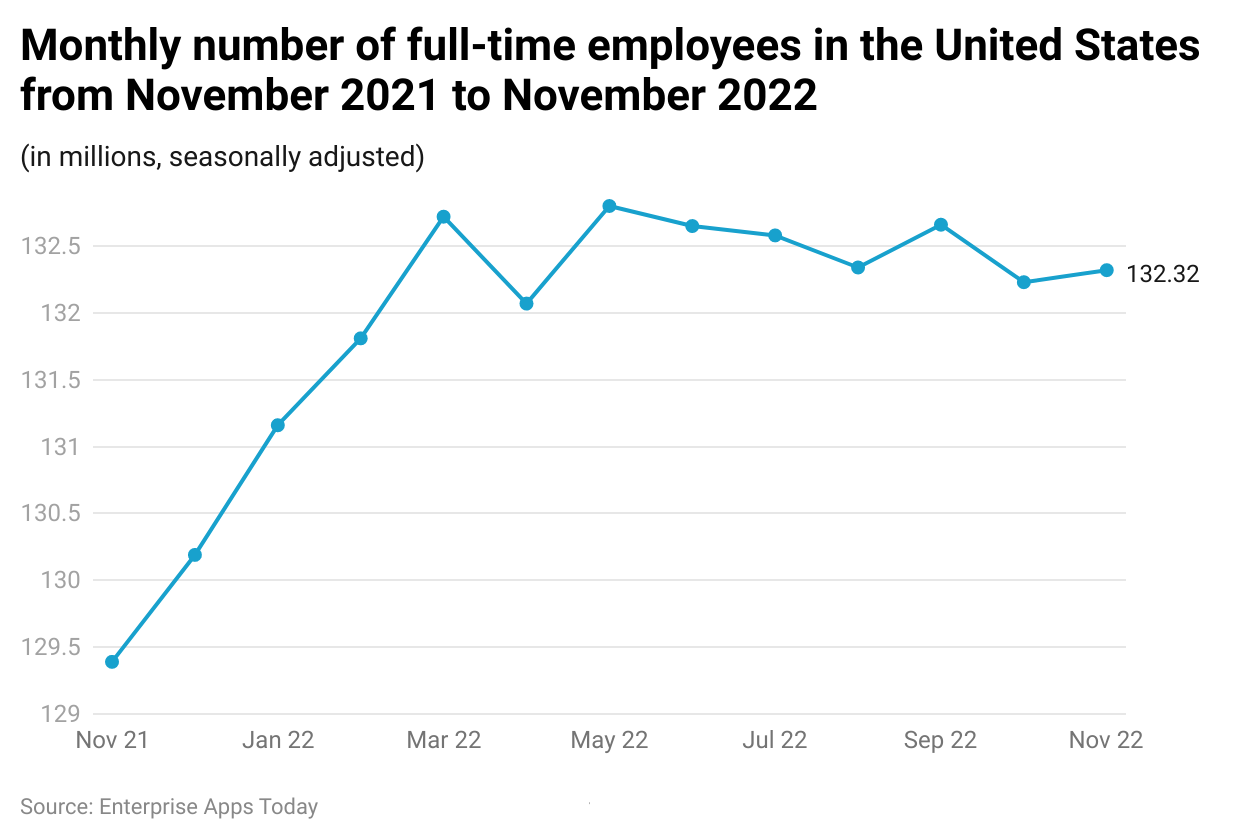 (Reference: Statista)
- As per the Part-time vs. full-time employment statistics in the United States of America, the rate of part-time employees has been increasing since mid-November 2021.
- However, from the month of 2022 to November 2022 it can be observed that the total number of part-time employees has been changing with minor changes from 132.72 million to 132.23 million.
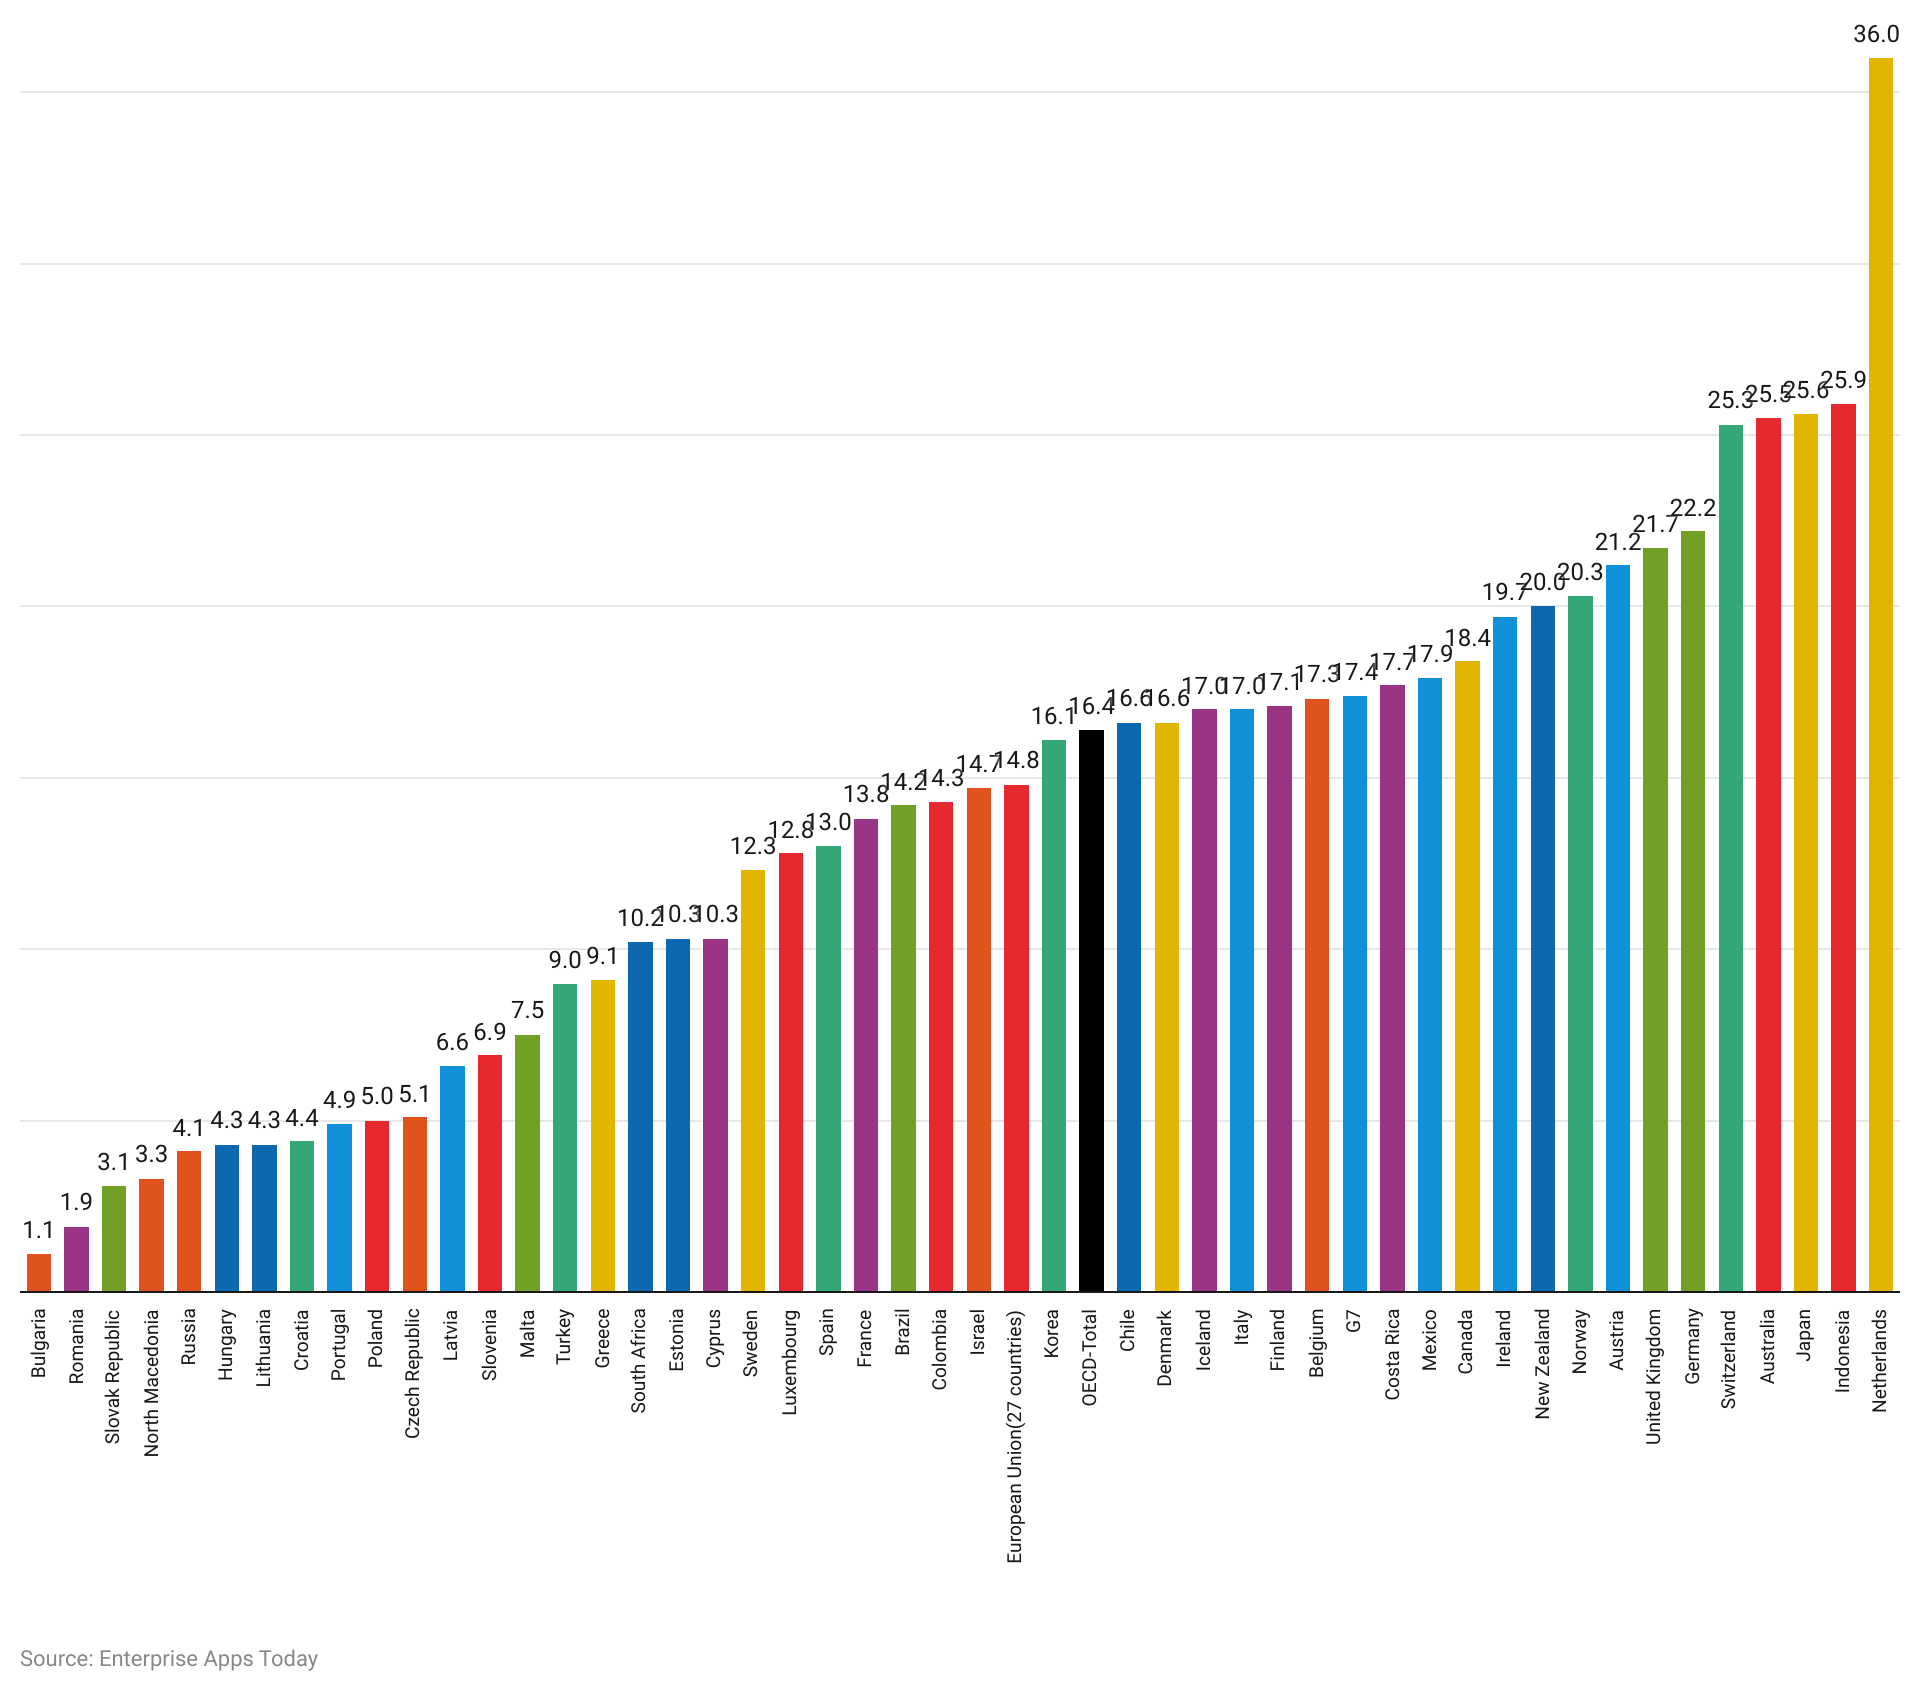 (Source: OCED Data)
- The recorded part-time employment rates as per the Part-time vs. full-time employment statistics are null for Bulgaria. Whereas the Netherlands has the highest number with 35%.
- Other countries such as Russia, Lithuania, Malta, Estonia, Brazil, France, Canada, and Ireland are below 20%.
- Countries such as New Zealand, Norway, the United Kingdom, Germany, and Switzerland have crossed the 20% mark reaching almost 25% in part-time employment rates.
| Rank | Country | % of part-time workers Among all Employed Persons |
|---|---|---|
| 1 | Netherland | 51% |
| 2 | Switzerland | 27% |
| 3 | Israel | 26% |
| 4 | Australia | 25% |
| 5 | United Kingdom | 23% |
| 6 | Ireland | 23% |
| 7 | Germany | 22% |
| 8 | Japan | 22% |
| 9 | Austria | 21% |
| 10 | New Zealand | 21% |
| 11 | Denmark | 20% |
| 12 | Canada | 19% |
(Source: Worldatlas)
- As per the above chart, the list of the top 12 countries with the highest rates of part-time employment is ranked with the overall percentages, where the top place is taken by the Netherlands with 51% of the part-time employees.
- The Netherlands is followed by Switzerland, Israel, Australia, and the United Kingdom with a percentage of 27%, 26%, 25%, and 23% respectively.
- Ireland has 23% of the part-time employment rate whereas Germany has 22%.
- Japan, Austria, New Zealand, Denmark, and Canada have 22%, 21%,20%, and 19% each.
By Ethnicity
Chart 1:
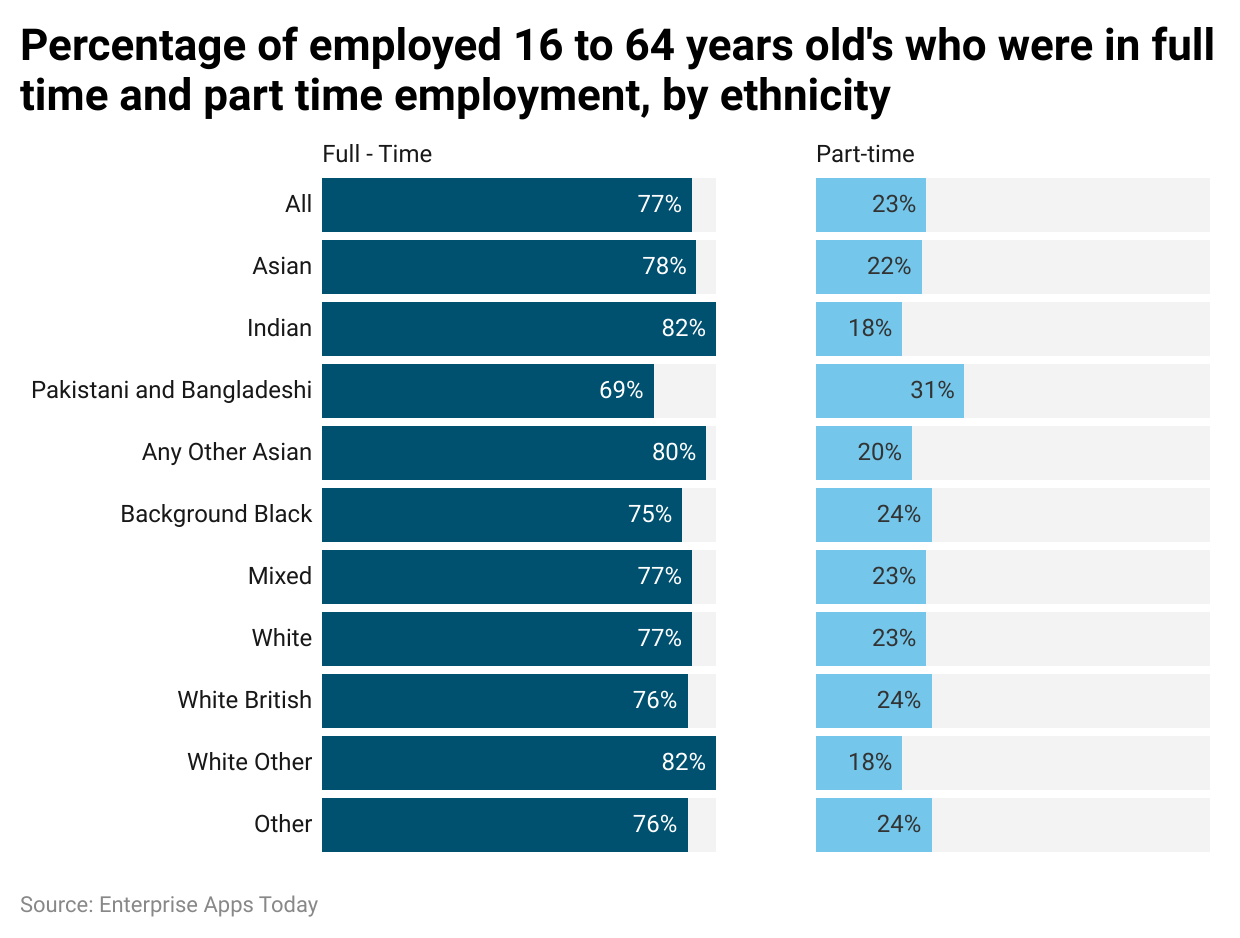
(Source: ethnicity-facts-figures.service.gov.uk)
- As per the above chart, part-time employees are fewer than full-time employees in every ethnic group.
- In full-time employment, Indians and other white people have the highest share with 82% followed by Asians with 78%.
- In part-time employment, Pakistani and Bangladeshi have the highest share with a rate of 31%.
- After Pakistani and Bangladeshi, it is followed by black background people.
Chart 2:
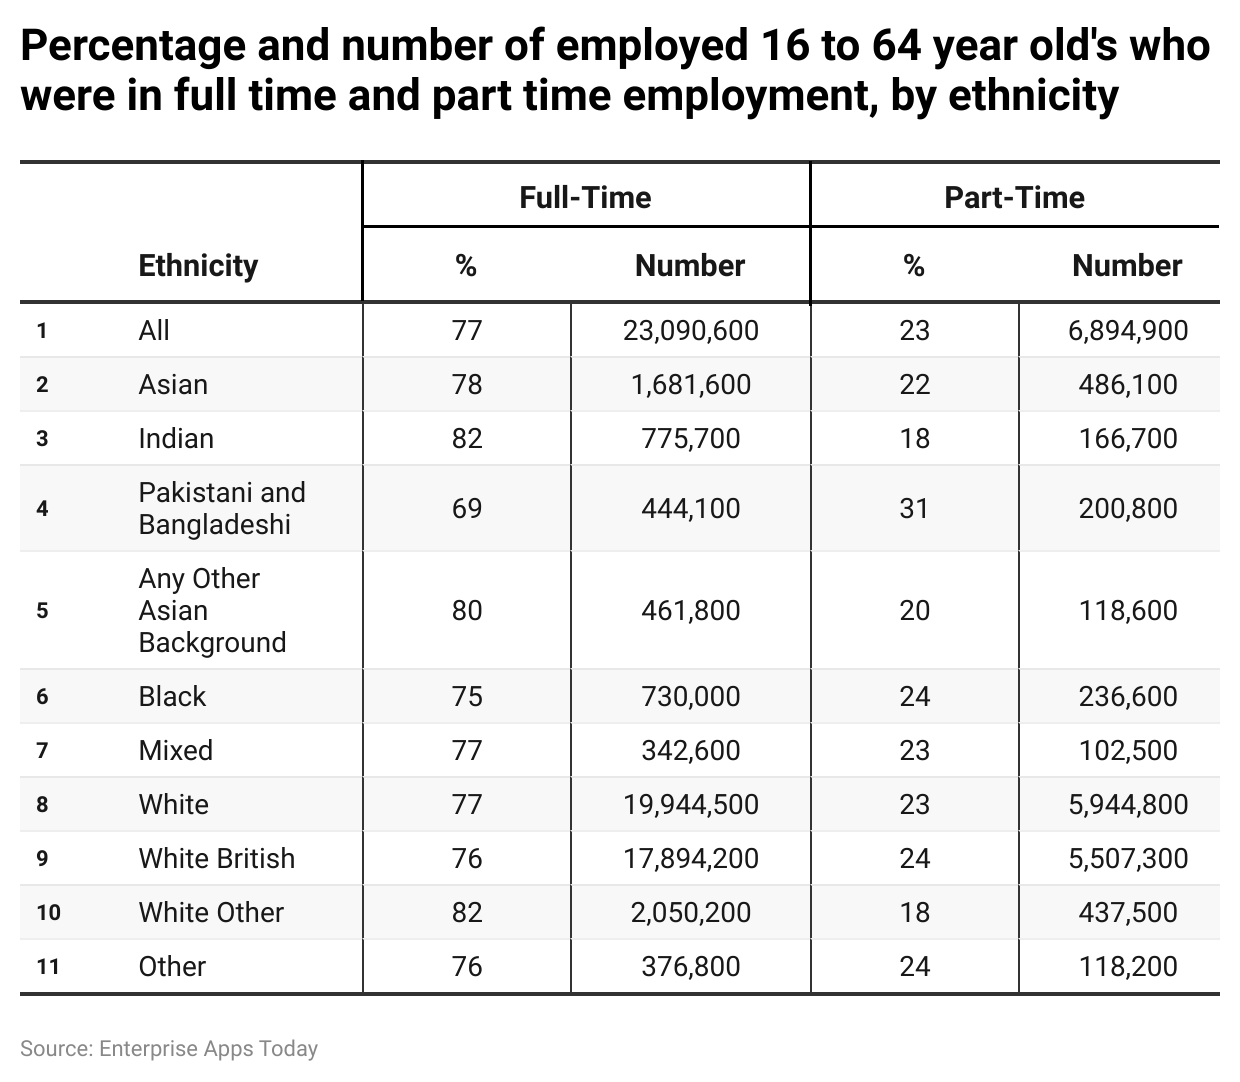
(Source: ethnicity-facts-figures.service.gov.uk)
- As per the above chart, Part-time vs. full-time employment statistics show that there are various types of people working under both employment types. This research was conducted in England, Wales, and Scotland for the year 2021. Therefore, it has been assumed that the number shown in the above chart is related to these locations only.
- The total full-time employees are around 77% resulting in 23,090,600 and part-time employees are around 23% which resulted in 6,894,900.
- In the year 2021, there were 78% of full-time Asian employees and 22% of part-time employees, resulting in 1,681,600 and 486,100 respectively.
- Whereas the Indian population is around 82% and 18% with respective employment types. Each type has around 775,700 and 166,700.
- Whereas Pakistani and Bangladeshi are around 69% and 31% in each employment type with many 444,100 and 200,800.
- Other types of ethnic people resulted in almost 80% in overall full-time employment and around 25% in part-time employment.
- In the ethnic groups, in the year 2021, it was observed that more men were working full-time employment than women.
- There were, Asian full-time workers at 86%, black at 87%, and white men at 90% in the overall ethnic group as stated by Part-time vs. full-time employment statistics.
Part-time Vs Full-time Employment Trends
- Part-time employment is on the rise, especially among younger age groups, with 80% of individuals aged 16 to 17 engaging in part-time work globally.
- Women continue to constitute a significant portion of the part-time workforce, comprising 63% of part-time employees.
- The retail and food industries heavily rely on part-time workers, with part-time retail employees making up 29% of the overall retail workforce and the food industry employing 32.8% part-time workers.
- Despite the prevalence of part-time employment, full-time positions remain dominant, with 77% of employed individuals globally being full-time workers.
- There is a growing trend of individuals choosing part-time employment to balance work and other commitments, such as education or training programs.
- In certain industries like hospitality and leisure, part-time employment rates are notably higher, with 46% of the workforce being employed part-time.
- The education and health services industry also sees a significant number of part-time workers, with 5.9 million individuals employed part-time in this sector.
- The flexibility offered by part-time employment is attractive to many, contributing to its increasing popularity in the workforce.
- Part-time developers earn a substantial average annual income of USD 109,905, reflecting the potential financial viability of part-time work in certain professions.
- As of January 2023, there are approximately 27.52 million part-time workers in the U.S., indicating a substantial portion of the workforce engaging in part-time employment.
Part-time Vs Full-time Employment Recent Development
- As of January 2023, there are approximately 27.52 million part-time workers in the U.S., highlighting the substantial contribution of part-time employment to the overall workforce.
- Full-time employment remains the dominant form of work, with 77% of employed individuals globally holding full-time positions.
- Certain industries continue to rely heavily on full-time workers, such as healthcare and finance, reflecting stability and consistent demand in these sectors.
- Despite the prevalence of part-time positions, full-time employment offers benefits such as consistent income and access to employer-sponsored benefits like healthcare and retirement plans.
- As of January 2023, the number of full-time employees globally stands at 23,090,600, indicating a steady presence in the workforce.
Conclusion
Recent data reveals a significant presence of part-time workers, with 27.52 million individuals engaged in part-time employment in the U.S. alone as of January 2023.
Women continue to constitute a substantial portion of the part-time workforce, accounting for 63% of part-time employees globally.
Certain industries heavily rely on part-time workers, such as retail and food, where part-time employees make up 29% and 32.8% of the workforce, respectively.
Despite the flexibility offered by part-time employment, full-time positions remain dominant, with 77% of employed individuals globally being full-time workers.
However, part-time employment can still offer financial stability, as evidenced by part-time developers earning an average annual income of 109,905 USD
Sources
FAQ.
Yes, you can do multiple jobs in part-time employment, but before doing so just check the policies of the concerned country.
To be honest, it depends on the policies of the company. If the company doesn’t allow you to moonlight then you must not go for any other job, if full-time employment is not fulfilling the salary requirement just ask for a raise.
If you are a student, then you should do part-time employment and if you are a graduate then you are free to apply for full-time employment. But in case even if you have a degree, you are still eligible for part-time jobs.
Yes, if you are a competitive performer during specific years company provides career growth.

Barry is a lover of everything technology. Figuring out how the software works and creating content to shed more light on the value it offers users is his favorite pastime. When not evaluating apps or programs, he's busy trying out new healthy recipes, doing yoga, meditating, or taking nature walks with his little one.