
Bureau of Labor Statistics 2024 – By Demographics, Highest Paying Jobs, The Unemployment Rate, Job Flexibilities and Retirement Benefits
Page Contents
- Introduction
- Editor’s Choice
- Facts About Bureau of Labor Statistics
- What is the Bureau of Labor Statistics?
- On What Basis The Statistics are Created?
- Types of Reports Prepared by the Bureau of Labor Statistics
- Bureau of Labor Statistics By Demographic
- By Age And Gender
- Projected Number of The Women Labor Force by The Year 2029
- Projected Number of Men in Labor Force by The Year 2029
- By Education
- By Highest Paying Jobs
- By Fastest Growing Occupations 2021-2031
- By The Unemployment Rate
- By Job Flexibilities
- By Reasons For Working From Home
- By Knowledge Of Advanced Knowledge Of Work Schedules
- By Retirement Benefits
- Trends About Bureau of Labour Statistics
- Recent Development in the Bureau of Labour Statistics
- Conclusion
Introduction
Bureau of Labor Statistics: understanding the employment landscape is crucial, and one of the key sources of information for this is the Bureau of Labor Statistics (BLS). The BLS is a federal agency responsible for collecting, analyzing, and disseminating essential data about labor market activity in the United States. With a vast array of statistics covering various aspects of employment, wages, and working conditions, the BLS provides valuable insights into the state of the labor market.
Each month, the BLS releases the Employment Situation Summary, which includes key indicators such as the unemployment rate, total nonfarm payroll employment, and average hourly earnings. For example, in the latest report, the unemployment rate stood at 4.0%, with total nonfarm payroll employment increasing by 678,000. Additionally, the average hourly earnings for all employees on private nonfarm payrolls were USD 31.24.
The BLS also produces the Consumer Price Index (CPI), a measure of the average change over time in the prices paid by urban consumers for a basket of goods and services. This information is vital for assessing inflationary trends and their impact on consumer purchasing power. In the most recent CPI report, the index for all items rose 7.5% over the last 12 months, the largest increase since 1982.
Overall, the Bureau of Labor Statistics plays a crucial role in providing accurate and timely data that informs decision-making by policymakers, businesses, researchers, and the public. By understanding the insights gleaned from BLS reports, analysts can better grasp the dynamics of the labor market and make informed recommendations for various stakeholders.
Editor’s Choice
- The Bureau of Labor Statistics (BLS) is a vital segment of the United States Department of Labor.
- It collects and shares essential economic and employment information.
- The BLS tracks the labor force participation of women, with the highest participation expected from those aged 35 to 44 by 2029.
- Unemployment rates saw a steady decline, dropping to 3.4% in January 2023 from 3.6% in November 2022.
- Studies conducted by the BLS revealed that 82.2% of full-time workers aged above 25 experienced a wage gap of 17.8%.
- In 2022, workers with bachelor's degrees faced a 23.5% wage gap, while those with advanced degrees faced a 22.6% gap.
- The BLS also tracks inflation through indicators like the Consumer Price Index (CPI) and Producer Price Index (PPI).
- Additionally, it provides comprehensive data on employment, labor force participation, productivity, and wages at both national and regional levels.
You May Also Like To Read
- Workplace Stress Statistics
- Employee Recognition Statistics
- Wasting Time At Workplace Statistics
- Cell Phones At Workplace Statistics
- Work-Life Balance Statistics
- Drinking At Work Statistics
- Time Management Statistics
- Internship Statistics
- Teacher Statistics
- Digital Nomad Statistics
Facts About Bureau of Labor Statistics
- The Bureau of Labor Statistics (BLS) is a federal agency in the United States.
- It collects, analyzes, and publishes data on labor market activity.
- The BLS provides information on employment, wages, prices, productivity, and safety.
- It releases monthly reports on the Employment Situation, including the unemployment rate and job growth numbers.
- The BLS also publishes the Consumer Price Index (CPI) to track changes in prices over time.
- Its data is used by policymakers, businesses, researchers, and the public to make informed decisions.
- The BLS ensures the accuracy and reliability of labor market information.
- It conducts surveys, studies, and research to understand trends in the economy and labor force.
- The agency's website offers access to a wide range of statistical resources and tools for analysis.
- BLS reports provide insights into economic conditions, labor market trends, and wage growth.
What is the Bureau of Labor Statistics?
The BLS (Bureau of Labor Statistics) is a segment in the United States Department of Labor. The department further collects information on insights into the labor market and the economy of the United States of America. The reports created by them include crucial measures of inflation such as the Producer Price Index (PPI) and Consumer Price Index (CPI). This American government agency performs research, gathers information, and publishes various kinds of statistical data on the prices, productivity as well as labor market. Their reports are often referred to by academic people, policymakers, and businesses. Moreover, the reports include predictions of the future made by economists. The BLS is located in Washington, D.C.
On What Basis The Statistics are Created?
The data collected by the authorized person is retrieved from surveys providing information on the US economy, productivity, price changes, market activities, and Economic support for private or public decision-making. Furthermore, the reports are created based on regional data.
West
- Mountain segment: Utah, New Mexico, Nevada, Idaho, Arizona, Colorado, Montana, and Wyoming.
- Pacific segment: Washington, California, Alaska, Oregon, and Hawaii.
South
- South Atlantic segment: West Virginia, Georgia, Florida, District of Columbia, South Carolina, Virginia, Maryland, and Delaware.
- West South-Central Division: Texas, Arkansas, Louisiana, and Oklahoma
- East south-central segment: Tennessee, Alabama, Kentucky, and Mississippi.
Midwest
- West North Central segment: South Dakota, Nebraska, Missouri, Iowa, Minnesota, and Iowa.
- Eat North Central Division: Wisconsin, Illinois, Michigan, Indiana, Wisconsin, and Ohio.
North
- New England segment: Vermont, Rhode Island, Maine, Connecticut, and Massachusetts.
- Middle Atlantic Segment: Pennsylvania, New York, and New Jersey.
Types of Reports Prepared by the Bureau of Labor Statistics
- Employment Situation Report / Job Report: includes information on hours worked, unemployment, employment, and wages-related information segmented into regional or demographic.
- Consumer Price Index (CPI): This report is built upon the average aggregate of prices of usual consumer services and goods offered in the United States of America. For example, education, transportation, housing, food and beverages, apparel, etc.…
- Producer Price Index (PPI): The report includes the average value of every initially offered service and domestic product for the determined time.
- Other reports prepared by the Bureau of Labor Statistics are Workplace Injury and Fatality Statistics, National Compensation Survey, U.S. Import and Export Price Indices, Labor Productivity Statistics, and Employment Cost Index.
Bureau of Labor Statistics By Demographic
By Ethnic Background
 (Reference: dol.gov)
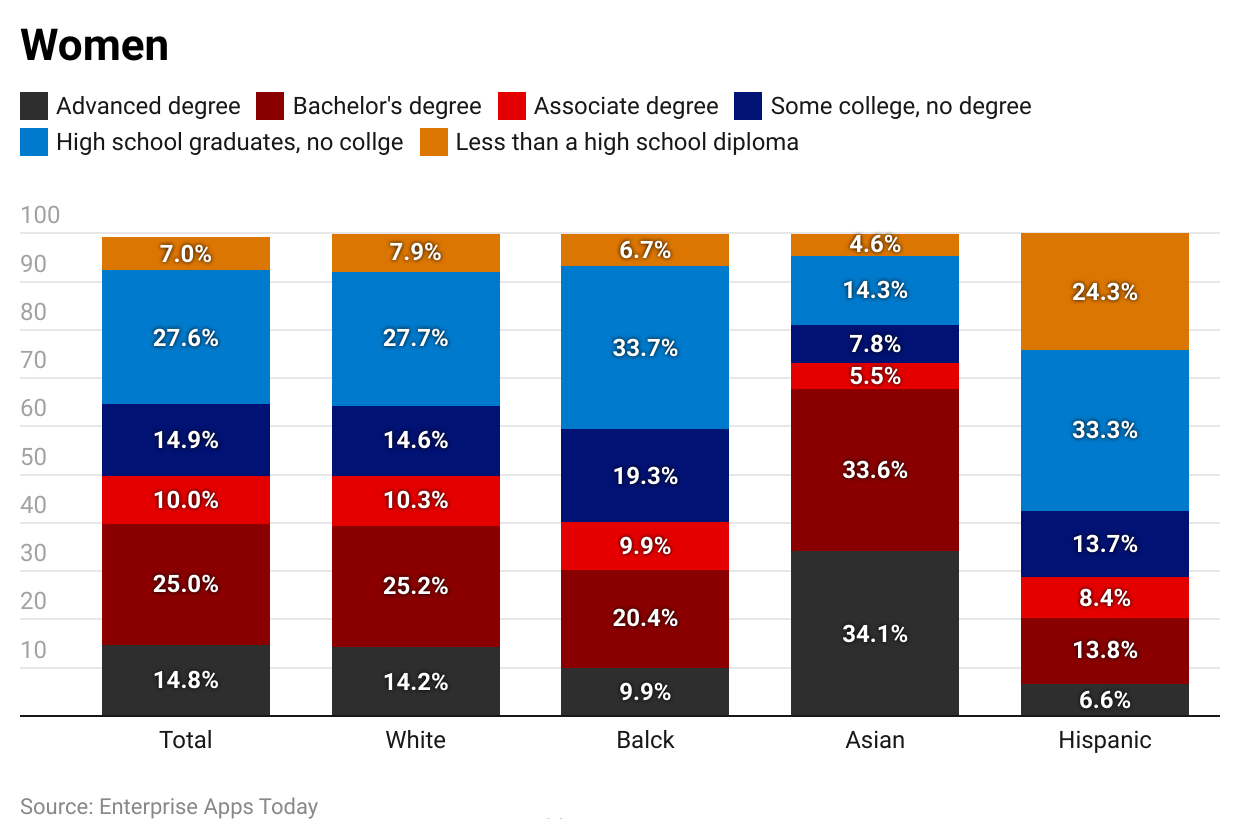
Women
- The Bureau of Labor Statistics of a demographic states that the total number of women with less education than a high school diploma was 4.9% in total. Out of which, 4.7%, 5.4%, 5.4%, 4.9%, and 16.7% belong respectively to women from white, black, Asian, and Hispanic ethnic backgrounds.
- The total number of women with high school graduates but no degree resulted in 21.4% belonging to various ethnicities such as 4% (white), 25.5% (black), 14.9% (Asian), and 27.5% (Hispanic).
- Similarly, the reported number of the women labor force for further education level subcategories by ethnicity are:
Attended college but no degree total: 14.6%
- White: 14.4%
- Black:18.5%
- Asian: 6.5%
- Hispanic: 16%
Associate degree total: 12.5%
- White: 12.8%
- Black:13.1%
- Asian: 6.7%
- Hispanic: 11%
Bachelor’s degree total: 28.3%
- White: 28.8%
- Black:22.1%
- Asian: 37.4.%
- Hispanic: 19.5%
Advanced degree total: 18.3%
- White: 18.1%
- Black:15.4%
- Asian: 29.6%
- Hispanic: 9.4%
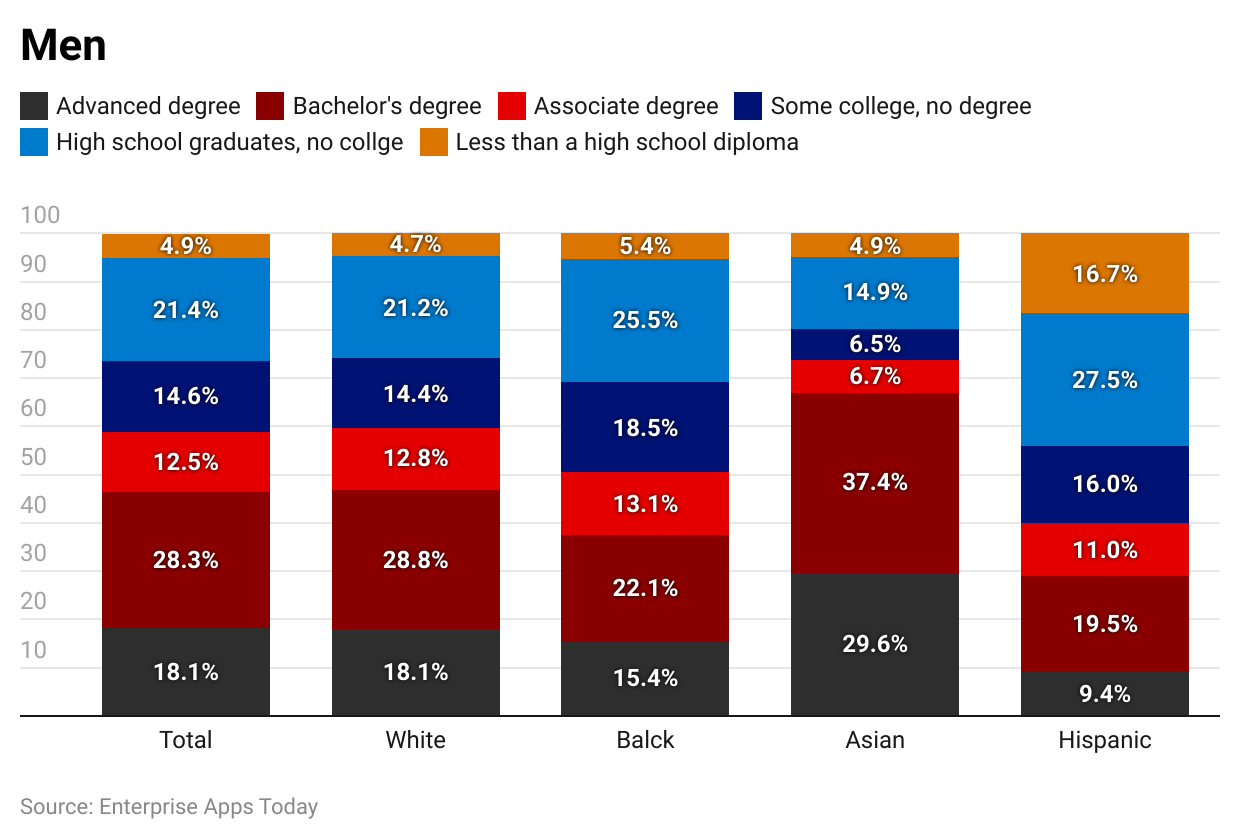
Men
- Similar to the Bureau of Labor Statistics of women, male labor workforce subcategories by ethnic background have been shown below.
Less than a high school diploma: 7.7%
- White: 7.9%
- Black:6.7%
- Asian: 4.6%
- Hispanic: 24.3%
High school graduate total: 27.6%
- White: 27.7%
- Black:33.7%
- Asian: 14.3%
- Hispanic: 33.3%
Attended college but no degree total: 14.9%
- White: 14.6%
- Black:19.3%
- Asian: 7.8%
- Hispanic: 13.7%
Associate degree total: 10%
- White: 10.3%
- Black:9.9%
- Asian: 5.5%
- Hispanic: 8.4%
Bachelor’s degree total: 25%
- White: 25.2%
- Black:20.4%
- Asian: 33.6%
- Hispanic: 13.8%
Advanced degree total: 14.8%
- White: 14.2%
- Black:9.9%
- Asian: 34.1%
- Hispanic: 6.6%
By Age And Gender

 (Reference: dol.gov)
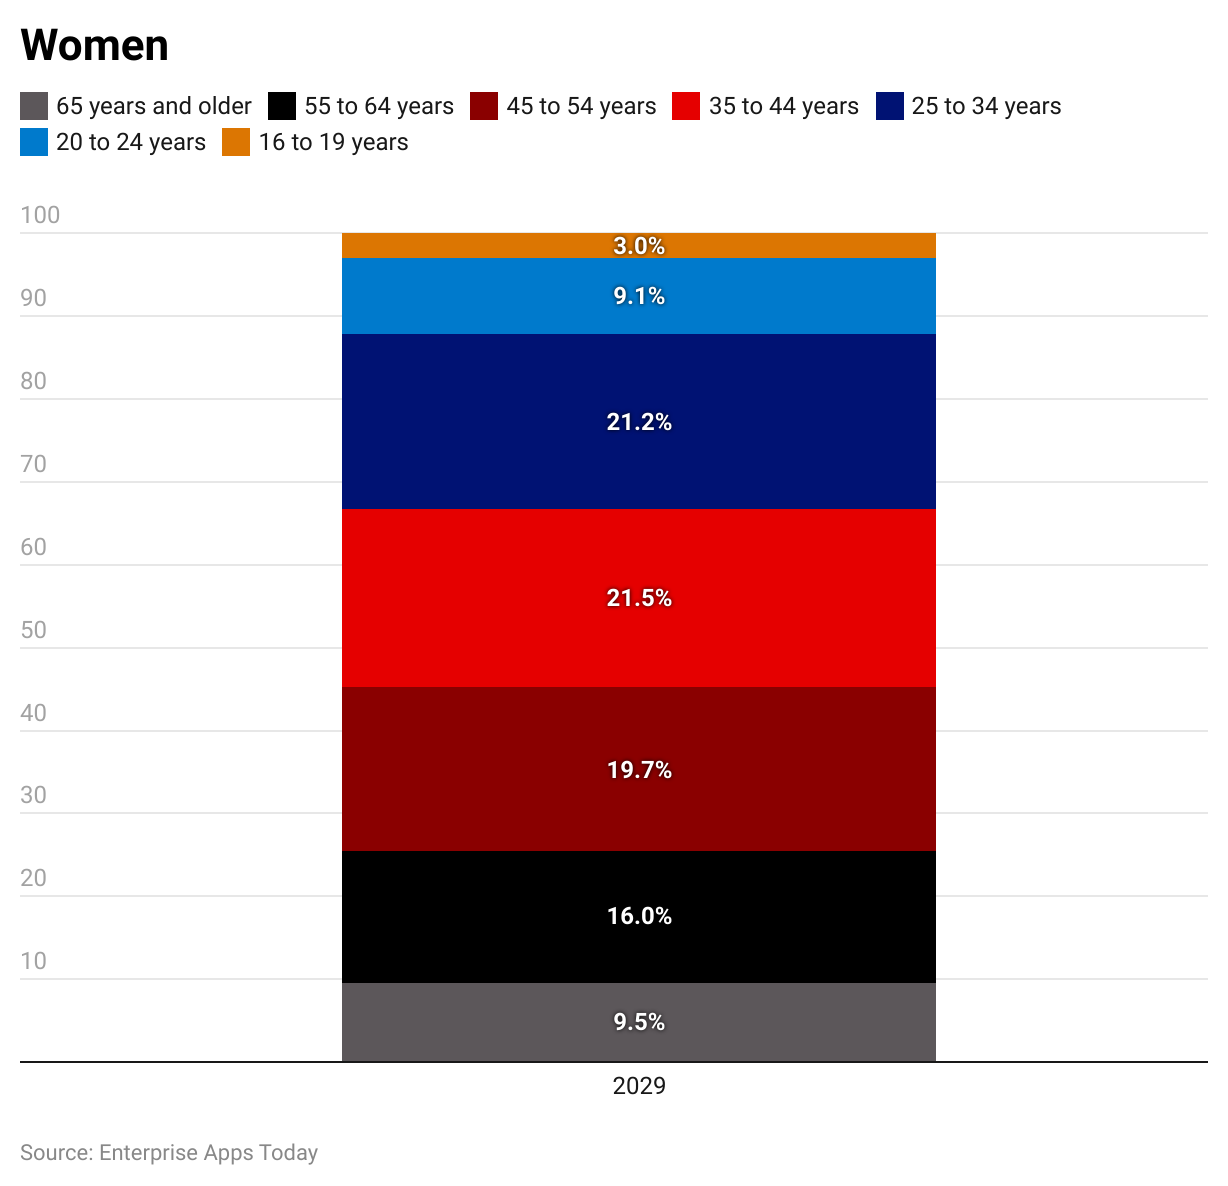
Projected Number of The Women Labor Force by The Year 2029
- By the year 2029, the Bureau of Labor Statistics says that there will be 3% of workers aged between 16 years to 19 years.
- Moreover, by the year 2029, the percentage of the women labor force will be 9.1% for women aged between 20 to 24 years and 21.2% for women from 25 years to 34 years of age group.
- The highest participation in the women’s labor force is expected from women aged between 35 years to 44 years.
- Furthermore, the Bureau of Labor Statistics says that the expected number of women labor force in the United States of America by the year 2022 will be 19.7% (45 to 54 years), 16% (55 years to 64 years), and 9.5% (65 years and above).
Projected Number of Men in Labor Force by The Year 2029
- Similarly, the Bureau of Labor Statistics of the men’s labor force states that there will be 2.6% and 8.2% from the age group of 16 years to 19 years and 20 years to 24 years respectively.
- Furthermore, it is forecasted that in the year 2029, the male workforce will be 21.7% (25 years to 34 years), 23.3% (35 years to 44 years), and 19.3% (45 years to 54 years).
- Additionally, the forecasted number of the male labor force in the United States of America will be 15.2% for 55 years to 64 years and 9.8% for 65 years and above.
By Education
 (Reference: dol.gov)
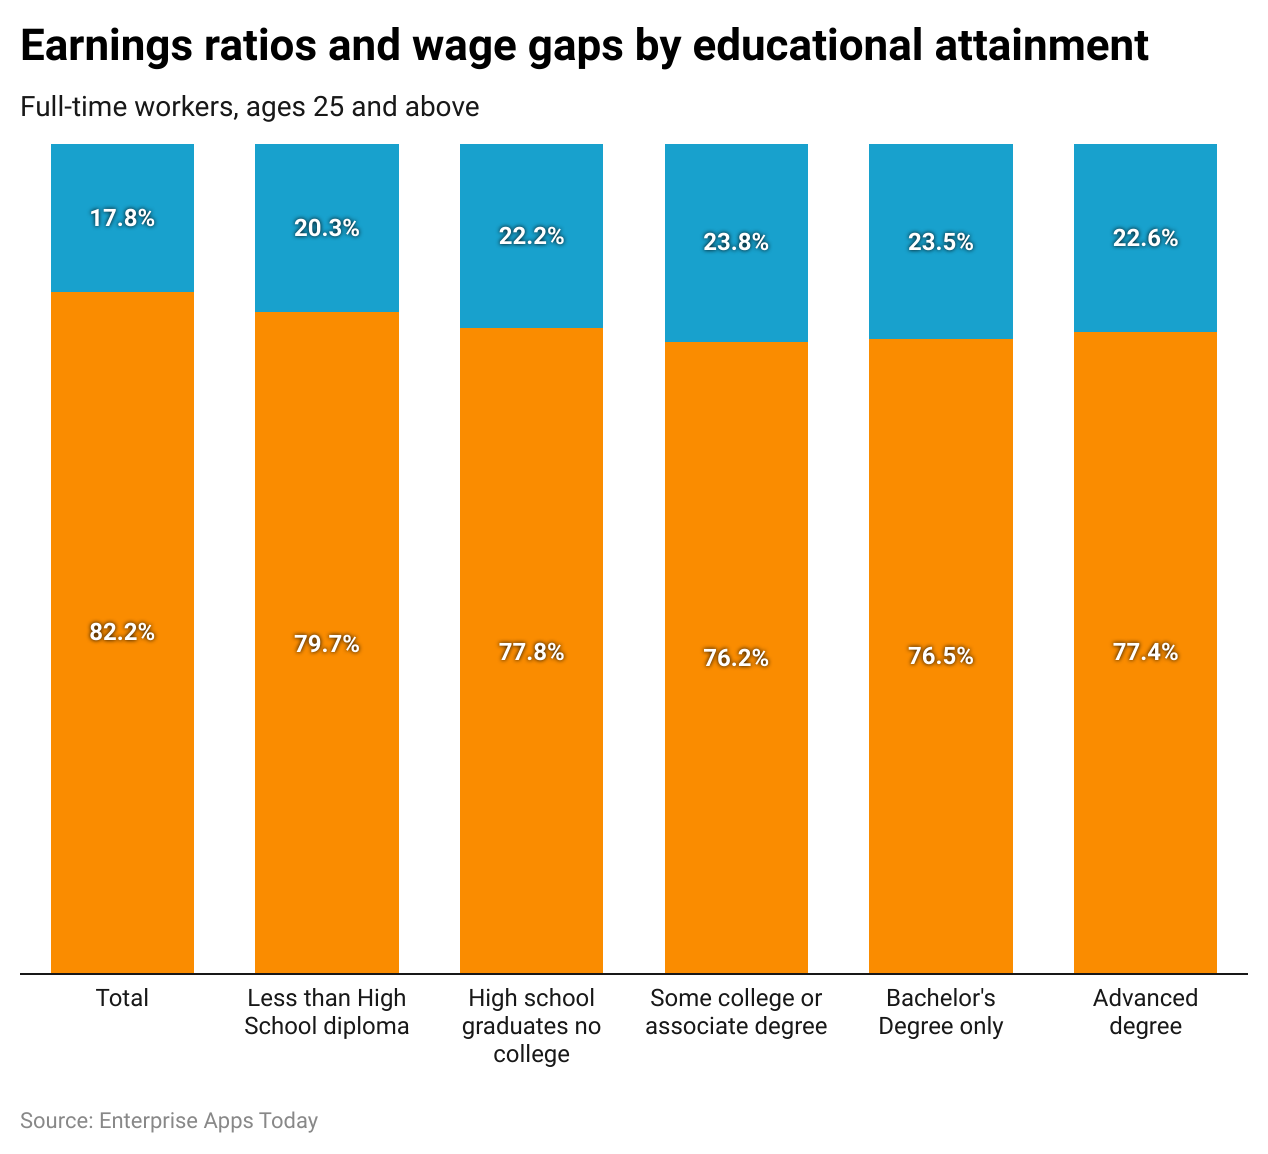
- The studies performed by the Bureau of Labor Statistics state there were a total of 82.2% of full-time workers including all genders aged above 25 years who experienced a wage gap of 17.8%.
- 7% of workers with less than a high school diploma experienced a 20.3% of wage gap while 77.8% of employees with high school graduates but attended no college faced a 22.2% wage gap.
- Workers in the United States of America, as of 2022 resulting in 76.2% who had some associate or college degree faced a 23.8% wage gap.
- Similarly, there were 76.5% and 77.4% of workers with only a bachelor’s degree and advanced degrees faced 23.5% and 22.6% wage gaps respectively.
By Highest Paying Jobs
According to the Bureau of Labor Statistics following are the highest-paying jobs that have a wage equal to or more than $2,08,000 per year.
- Physicians, Pathologists
- Radiologists
- Surgeons, all other
- Psychiatrists
- Physicians, all other
- Orthodontists
- Orthopedic surgeons, except for pediatric
- Pediatric surgeons
- Obstetricians and gynecologists
- Oral and Maxillofacial surgeons
- Family and emergency medicine physicians
- Neurologists
- Nurse anesthetists
- Cardiologist
- Dermatologists
- Anesthesiologists
- Airline pilots, copilots, and flight engineers ($202,180 per year)
- Nurse anesthetists ($195,610)
By Fastest Growing Occupations 2021-2031
 (Source: Bureau of Labor Statistics)
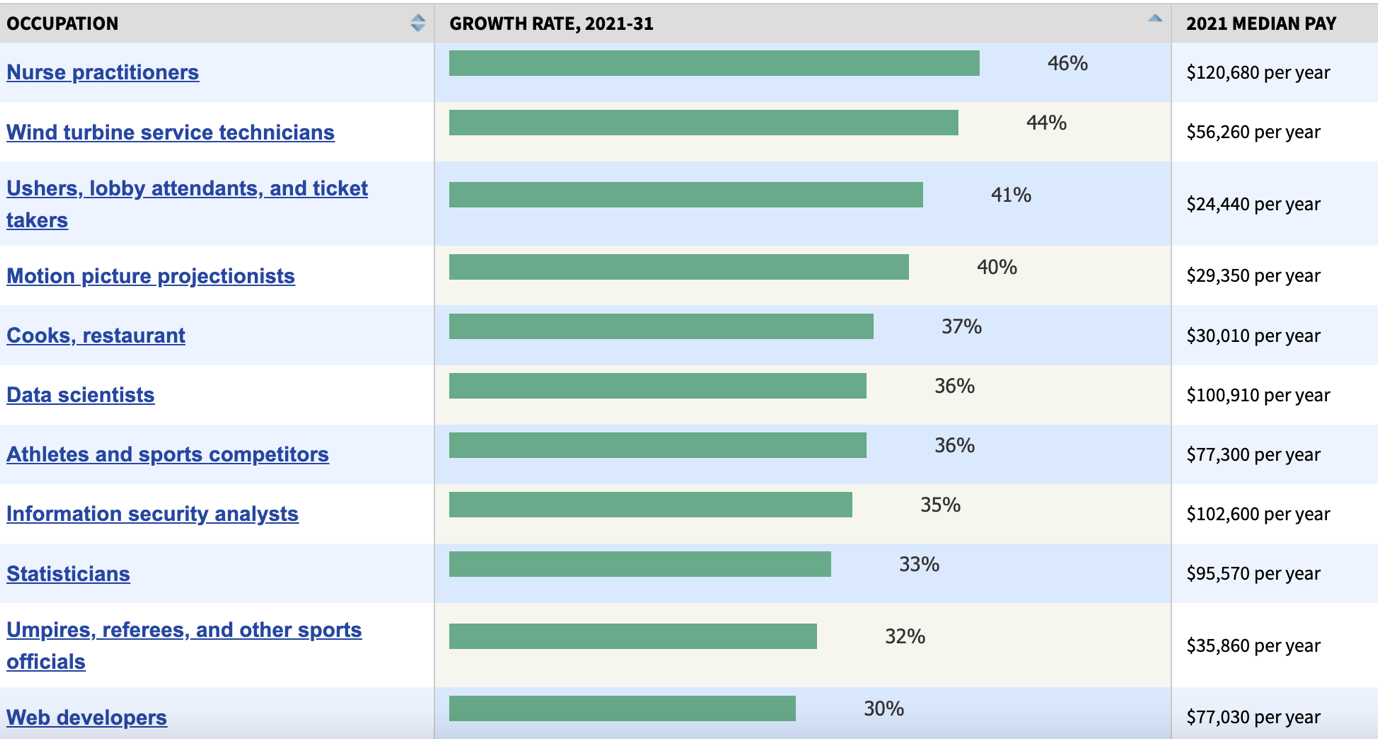
- The top 3 fastest-growing occupations in the United States of America stated by the Bureau of Labor Statistics are Nurse Practitioners with a growth rate of 46%, Wind turbine service technicians (44%) and Ushers, Lobby attendants and ticket takers (41%) at median pa declared at $120.680, $56.260, and $24,440 every year.
- Other fastest-growing occupations in the United States of America are Motion Picture Projectionists (40%) $29,350 p.a., Cooks, restaurants (37%) $30,010 p.a, Data scientists (36%) $100,910 p.a., Athletes and Sports Competitors (36%) $77,300 p.a., Information Security Analysts (35%) $102,600 p.a., Statisticians (33%) $95,570 p.a., Umpires, referees and other sports officials (32%) $35,860 p.a. and Web developers (30%) $77,030 p.a.
By The Unemployment Rate
 (Reference: TRADING ECONOMICS.com)
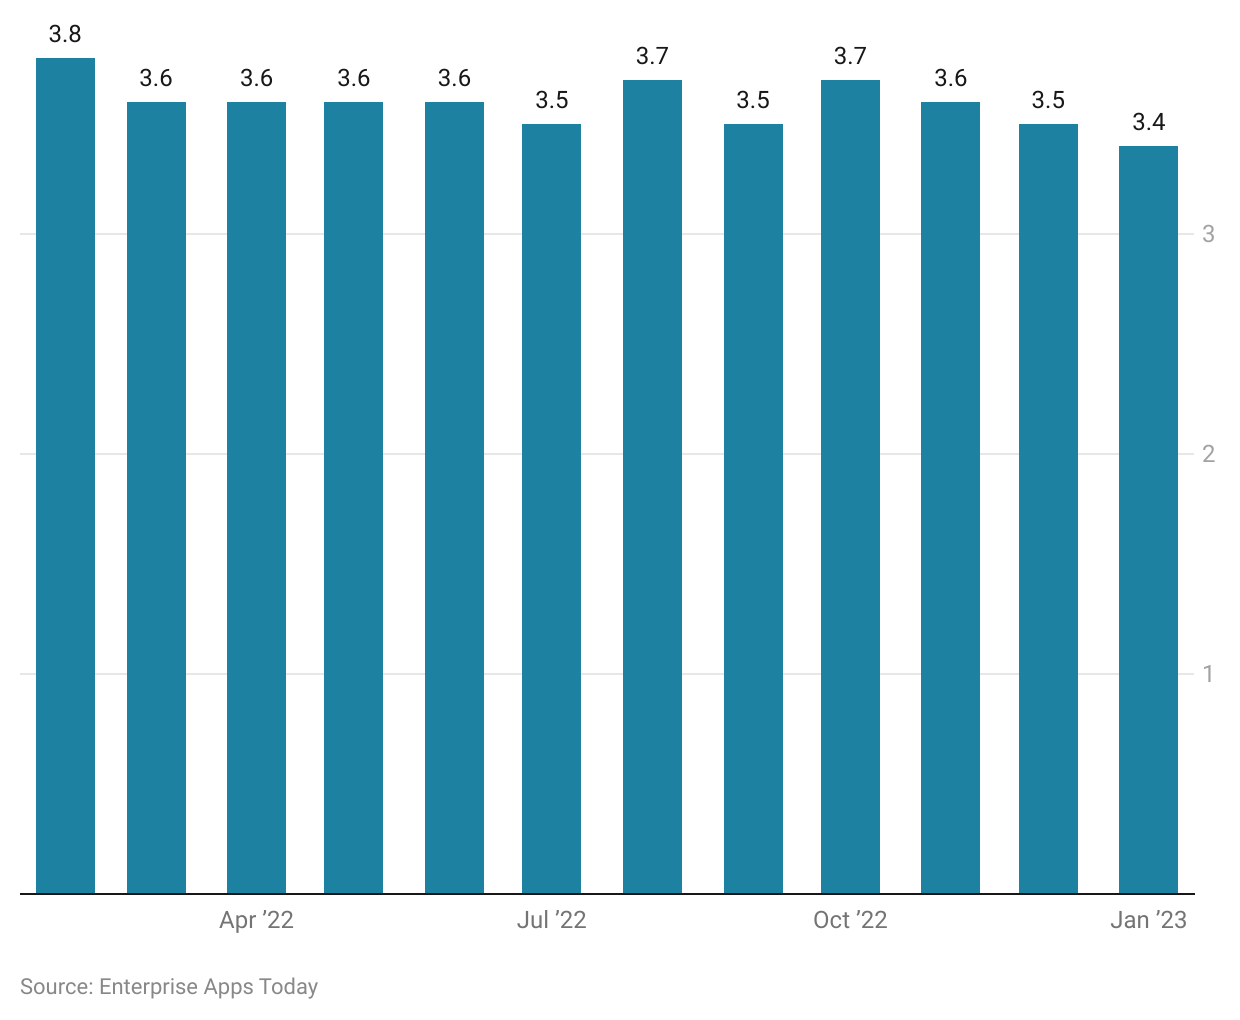
- The 1-year analysis by the Bureau of Labor Statistics says that in March 2022, the unemployment rate in the United States of America was 3.6% which stood stable in the following months up to June 2022.
- In July 2022, the unemployment rate decreased to 3.5% and experienced some drastic changes by 3.7% in August 2022, 3.5% in September 2022, and 3.7% in October 2022.
- In the following months, the rate was seen continuously declining by 3.6% in November 2022, 3.5% in December 2022, and as of January 2023, the unemployment rate was 3.4%.
By Job Flexibilities
By characteristics
 (Source: dol.gov)
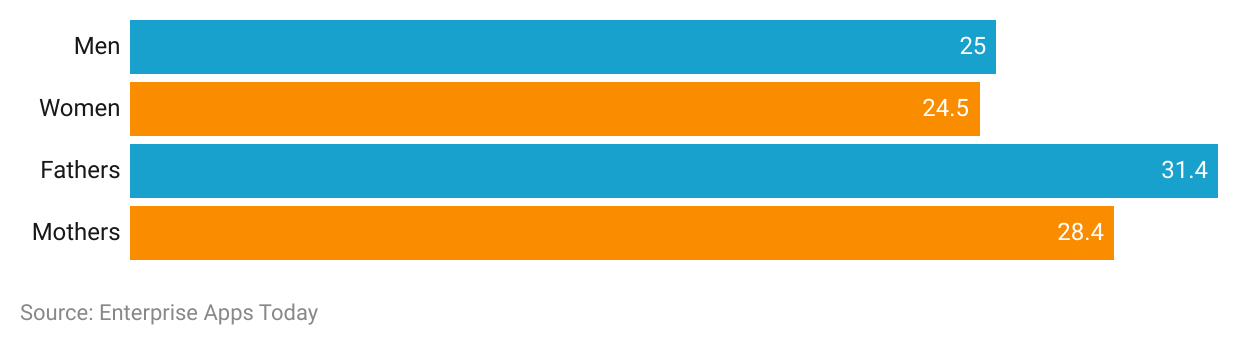
- According to the Bureau of Labor Statistics 2022, there were 25% of men said they have worked from home, while 24.5% of women reported the same.
- On the other hand, fathers, and mothers ever worked from home resulted in 31.4% and 28.4% respectively.
By Reasons For Working From Home
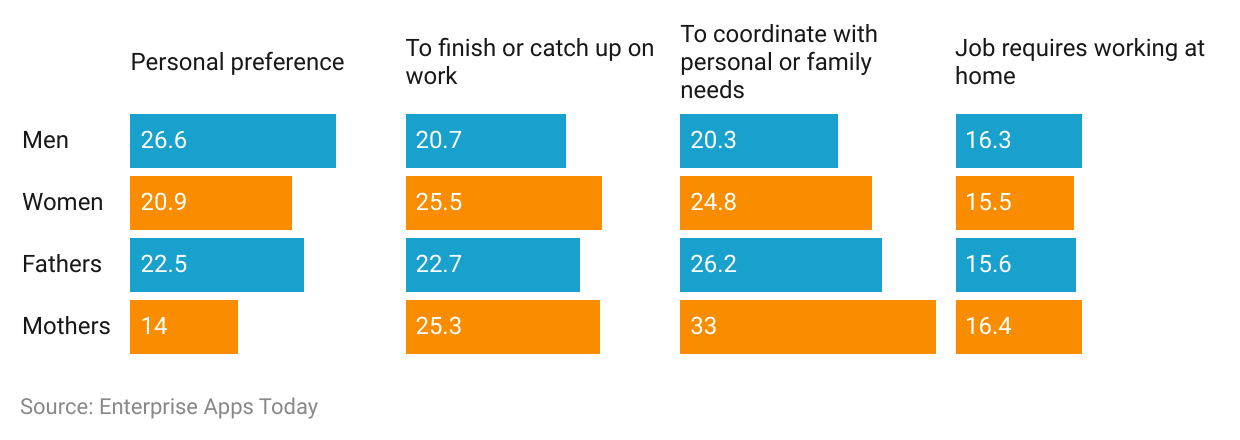
- 6% of men and 20.9% of women in the United States of America gave reason to work from home as a personal preference and 22.5% of fathers and 14% of women supported a similar reason.
- On the other hand, 20.7% of men and 25.5% of women said they could finish or catch up on other work, further supported by 22.7% of fathers and 25.3% of mothers.
- Adding further reasons for working from home to coordinate with personal or family needs following supports were observed: men (20.3%), women (24.8%), Fathers (26.2%), and Mothers (33%).
- And 16.3% of men and 15.5% of women said the job requires working from home. This was also said by 15.6% of fathers and 16.4% of mothers.
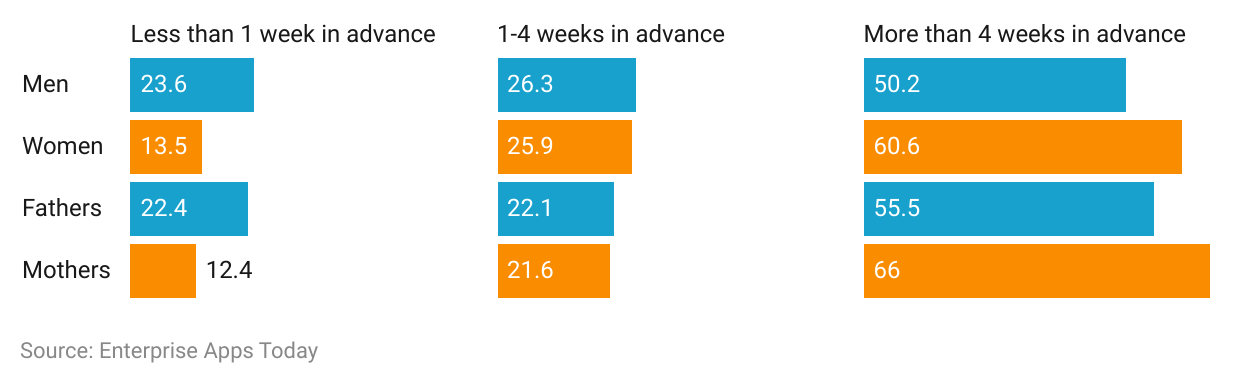
By Knowledge Of Advanced Knowledge Of Work Schedules
 (Source: dol.gov)
- According to the Bureau of Labor Statistics, in the United States of America, there were 23.6% of men and 13.5% of women reported acknowledging the work schedules less than 1 week in advance respectively.
- Similarly, 12.4% of mothers and 22.4% said they also received their work schedules one week in advance.
- Workers who received information about their work schedules 1 to 4 weeks in advance resulted in men (23.6%), women (13.5%), fathers (22.4%), and mothers (12.4%).
- There 66% of mothers and 55.5% of fathers received their working schedules more than 4 weeks in advance.
- Similarly, 60.6% of women and 50.2% of men acknowledged their advance receipt of work schedules before or more than 4 weeks.
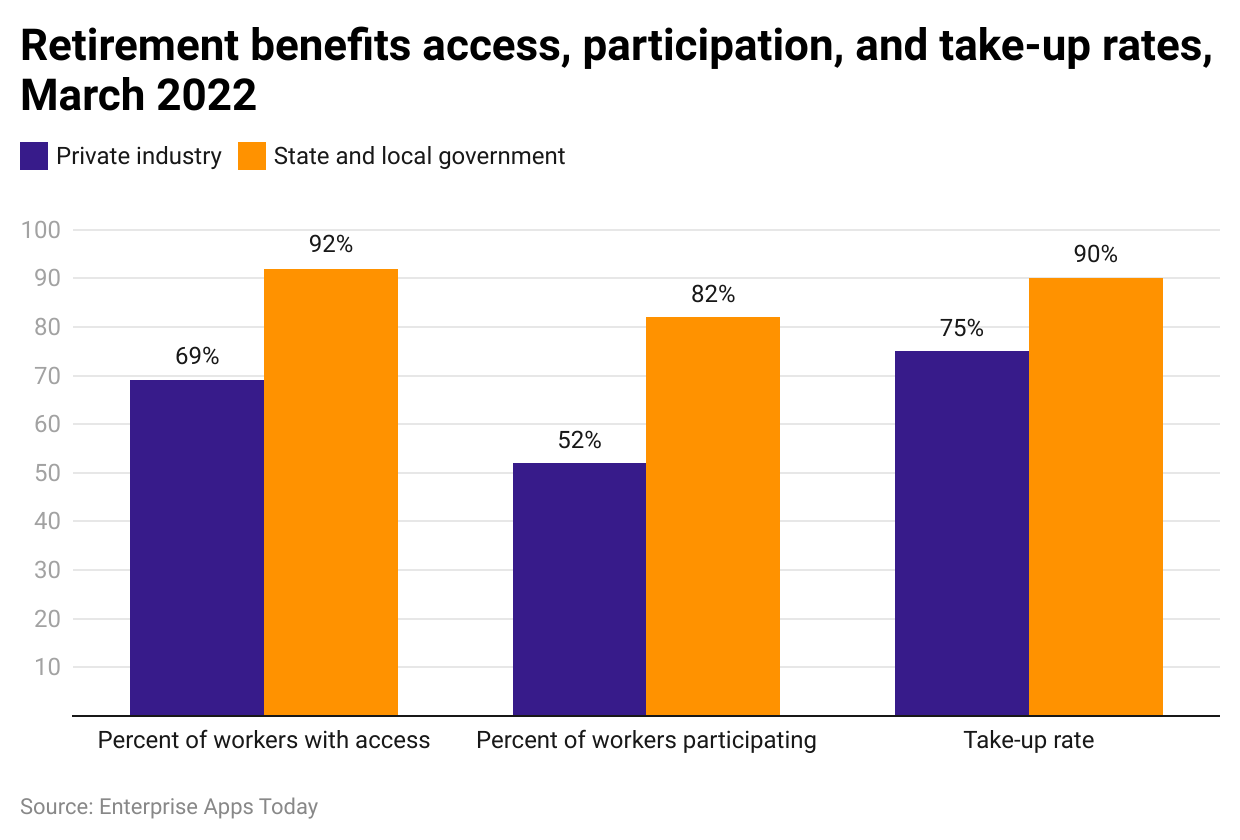
By Retirement Benefits
 (Reference: twitter.com)
- In March 2022, there were 69% of private industry workers had access to retirement benefits while 91% reported they had access belonged to state and local government.
- The reported percentage of participants from private industry and state and local government corporations reported respectively 51% and 81%.
- The highest take-up rate was recorded for individuals in state or local government corporations resulting in 90% while private sector workers recorded 73%.
Trends About Bureau of Labour Statistics
- The Bureau of Labor Statistics (BLS) projects an increase in remote work opportunities, reflecting changing work dynamics post-pandemic.
- There's a growing trend towards gig economy jobs, with more workers opting for flexible employment arrangements.
- Technological advancements are shaping labor trends, leading to an increased demand for workers skilled in fields like data analytics and digital marketing.
- The BLS anticipates a continued shift towards automation and artificial intelligence, affecting job availability in certain sectors.
- There's a rising focus on diversity, equity, and inclusion in the labor force, with companies implementing initiatives to promote equality and representation.
- The BLS observes a growing emphasis on workplace wellness programs and mental health support, reflecting evolving priorities among employers and employees.
Recent Development in the Bureau of Labour Statistics
- The Bureau of Labor Statistics (BLS) released data showing a decrease in the unemployment rate to 3.4% as of January 2023, indicating a strengthening job market.
- BLS reports revealed a steady increase in average hourly earnings for workers, suggesting improvements in wage growth and economic stability.
- Recent BLS studies highlighted disparities in wage gaps among different demographic groups, prompting discussions on strategies for achieving pay equity.
- The BLS introduced new methodologies for collecting and analyzing labor data, enhancing the accuracy and reliability of economic indicators.
- BLS reports indicated fluctuations in employment figures across various industries, signaling shifts in labor market dynamics and demand for specific skill sets.
Conclusion
In conclusion, the Bureau of Labor Statistics (BLS) serves as a vital source of economic and employment data, offering valuable insights into various facets of the labor market. With an unemployment rate of 3.4% as of January 2023, representing a decline from previous months, the BLS reports indicate a positive trend in job market conditions.
Furthermore, studies conducted by the BLS revealed wage gaps of 17.8% among full-time workers aged above 25 years, prompting discussions on strategies for achieving pay equity. The BLS's responsibility in monitoring inflation through indicators like the Consumer Price Index (CPI) and Producer Price Index (PPI) underscores its role in assessing economic stability.
As the BLS continues to refine its methodologies for data collection and analysis, it remains a cornerstone for policymakers, businesses, and researchers in understanding labor market trends and making informed decisions.
Sources
FAQ.
The first publication of the Bureau of Labor Statistics was published in the year 1886 in the form of an annual report which consisted of 496 pages of study on industrial depressions.
Any individual can access the data published on the website of the Bureau of Labor Statistics, but the department has requested to cite the content respectively.
The Bureau of Labor Statistics hires mathematical statisticians, economists, and technology specialists. These job-related posts can be found at USA jobs.
The US Bureau of Labor Statistics publishes the data. This is an agency of the government working in the US Department of Labor.

Barry is a lover of everything technology. Figuring out how the software works and creating content to shed more light on the value it offers users is his favorite pastime. When not evaluating apps or programs, he's busy trying out new healthy recipes, doing yoga, meditating, or taking nature walks with his little one.