
Teacher Statistics By Education Level, Demographics, Country Wise Time Spend, Salary, Workload, Grade Level, Social Media, Shortage, Vacancy, Reason of Leaving Job and Technology Trends
Page Contents
- Introduction
- Editor’s Choice
- Facts About Teacher
- General Teacher Statistics
- by Education Level
- by Impacts on Students
- by Demographics
- by Needs
- by Country-Wise Time Spend
- by Salary
- by Workload
- by Grade Level
- by Technology Trends
- by Social Media
- by Burnout Rate
- by Reason for Leaving a Job
- by Shortage
- by Vacancy
- Conclusion
Introduction
Teacher Statistics: As all we know “Teachers” are known to be an indispensable part of our society and this occupation also includes lots of challenges in recent days across the world. A crucial role is been played by a teacher in every country as they help educate millions of children every year starting from elementary education to higher degrees.
As of now, in 2023 it has been observed that many people are worried due to shortage demand of the teacher carrier. To find out more about the teaching profession, many effective statistics are elaborately described below that will shed light on why the transformation of education always begins with teachers.
 (Source: educationforwardarizona.org)
Editor’s Choice
- The World’s Teacher’s Day is going to be observed on Thursday, 5th October 2023.
- As of 2023, in the United States public school teachers are around 3.152 million.
- Whereas, both in public and private U.S. schools there are approximately 3.8 million teachers.
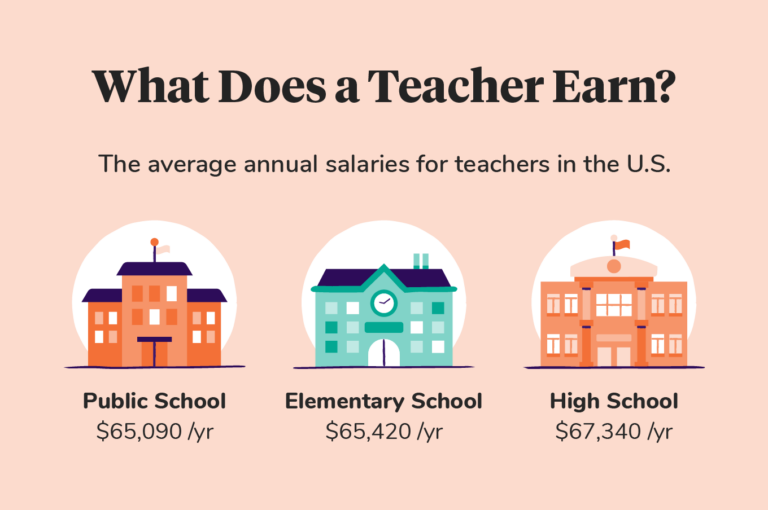
- The annual salary of a public school teacher in the U.S. is around $65,090 and high school teacher is $67,340.
- The average ratio of student/teacher resulted out 15:1 in 2023.
- Across the world, the share of female teachers is higher resulting in 74.3% is higher than male teachers with 25.7%.
- In the U.S. 2022, the largest share of teachers was 56.9% of those aged between 30 years to 49 years.
- Teachers received the highest and lowest salaries in the United States are New York and Mississippi respectively.
- Throughout the course of a teacher’s career, the average teacher have impacted more than 3,000 students by the end of 2022.
- By the end of 2025, the demand for teachers in the U.S. is expected to outpace its supply by more than 100,000.
Facts About Teacher
- By the end of 2030, the job outlook for kindergarten and elementary school teachers is expected to increase by 7% since the last decade, which will result in 124,300 jobs.
- On the other hand, the high school teacher rate will grow by 8% resulting in 77,400 jobs.
- Some important facts about teacher life have been observed teachers' average spending turned around $750 annually on school supplies for their classroom.
- In 2022, the average weekly time spent by teachers was 53.3 hours for teaching and doing school-related work.
- By the end of 2022, the average experience of a teacher was 15 years.
- More than half the percentages of K-12 teachers have master’s degrees resulting in 51%.
- Across the world, teaching was a difficult job agreed to 89% of people.
- During the school year 2022, around 18% of teachers were holding second jobs.
- According to the Career Explorer report, it was observed that 60% of teachers have claimed that they were happy with their careers and 36% of teachers remained in the bottom line of happiness level.
- The burnout rates were high because 3/4th of teachers had to take up additional charges of educational departments because of staff shortage.
- Due to staff shortage, 74% of teachers had to do extra duties and 805 teachers have also accepted that they have done extra work as of their expected responsibilities.
- It has also been observed that 75% of teachers faced stress-related health issues.
You May Also Like To Read
General Teacher Statistics
- In December 2022, a bill was introduced by the U.S. govt. “The American Teacher Act” for raising the minimum teacher’s salary up to $60,000.
- By the end of 2031, personal teacher’s employment rate is expected to increase by 15%. Whereas, the employment rate of elementary school teachers and Kindergarten school teachers has increased by 4%.
- On the other hand, high school teacher’s employment rate has enhanced by 5% by the end of 2031.
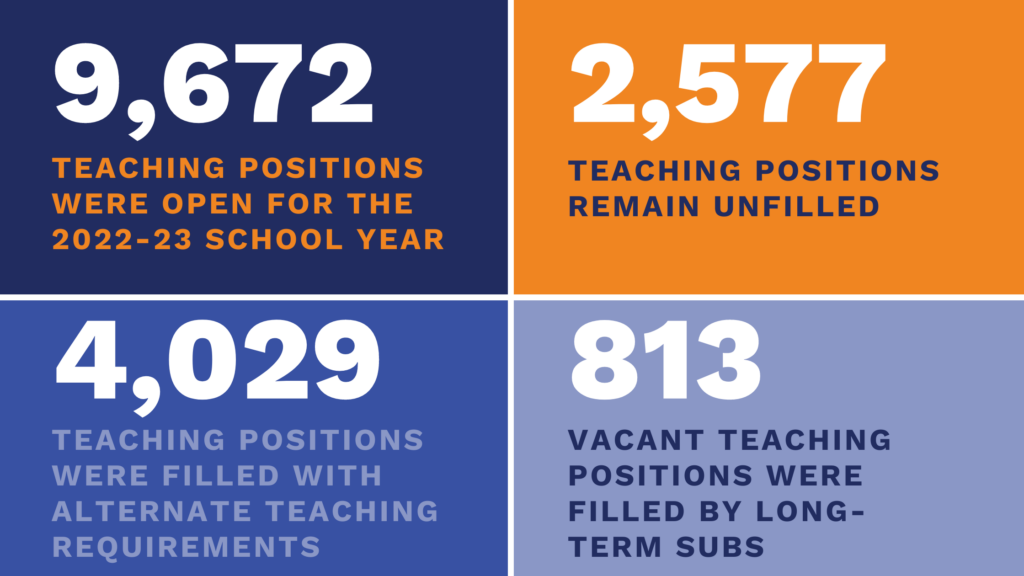
- In the United States, 75%of states have faced teacher shortages.
- At least one teacher vacancy was available in 45% of public schools in the U.S.
- It is expected that the game-based learning process is going to increase by 9 billion by the end of 2025.
- As of 2023, in the United States, the most burnt-out profession is K-12 teachers.
- In 2022, teaching job-related stress was approximately faced by 60% of teachers.
- The main reason why the teaching profession remained intact for longer periods for 58% of teachers due to meaningful work, 39% of teachers continued because of good coworkers, 34% due to compensation, 28% because of geography, and 27% due to community.
- In 2023, as teachers' burnout rate increased classroom disruption rates were also enhanced followed by 56% student misconduct, 49% rowdiness outside the class, and 48% student disrespect towards teachers.
- The unemployment rates of teachers have increased by 2.6% in 2023.
by Education Level
 (Source: zippia.com)
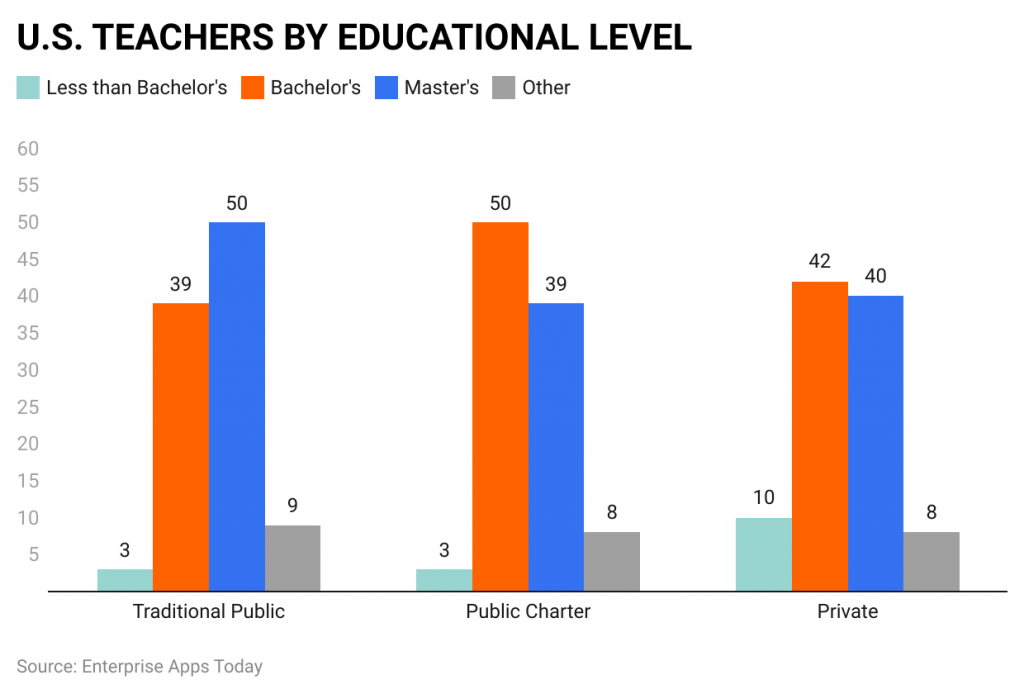
- As of 2022, in the United States teacher's education level is segmented as traditional public teachers share having 3% less than bachelor’s degree, 39% bachelor’s degree, 50% master’s degree, and 9% others.
- Furthermore, public charter teachers' education share was 3% less than bachelor’s degrees, 50% bachelor’s degrees, 39% master’s degrees, and 8% others.
- Private teacher's education share was 10% less than bachelor’s degrees, 42% bachelor’s degrees, 40% master’s degrees, and 8% others.
by Impacts on Students
- Throughout the course of a teacher’s career, the average teacher have impacted more than 3,000 students by the end of 2022.
- Teachers across the world have helped in enhancing self-esteem and confidence which was claimed by 83% of students.
- Teachers promoted appreciation among students which was agreed by 87% of global people.
- Teachers are also termed as positive role players in student’s life, accepted by 88% of people.
- Whereas, 79% of students in 2022 claimed that teachers have encouraged them to follow their dreams and 54% of students claimed that they received fruitful help from their teachers.
- As of 2022, it was also observed that 75% of students see their teachers as role models and mentors for life.
- Teachers by 51% have helped their students in creating a classroom more culturally responsive.
- Curriculum activities have been increased in schools and colleges which was accepted by 53% of teachers and students.
by Demographics
- In the U.S. 2022, the largest share of teachers was 56.9% of those aged between 30 years to 49 years.
- Teachers share aged 55 years and above was 16.5%, which is followed by under 30 years teachers (15%), and 50 years to 54 years teachers (11.6%).
- In 2023, in the U.S., the share of female teachers is higher resulting in 74.3% is higher than male teachers at 25.7%.
- Whereas, in elementary school teachers share was 89% female and 11% male.
- On the other hand, secondary school teachers share was 64% female and 36% male.
- As for ethnicity, the majority of teachers were ‘White American’ with a share of 79.3%, which is followed by Hispanic (9.3%), Black or African American (6.7%), Asian (2.1%), Non-Hispanic (1.8%), Native American (0.5%), and Native Hawaiian (0.2%).
- According to the reports of the National Education Association, 62% of Black and 59% of Hispanic teachers have left their jobs before planning in the U.S., in 2023.
by Needs
 (Reference: zippia.com)
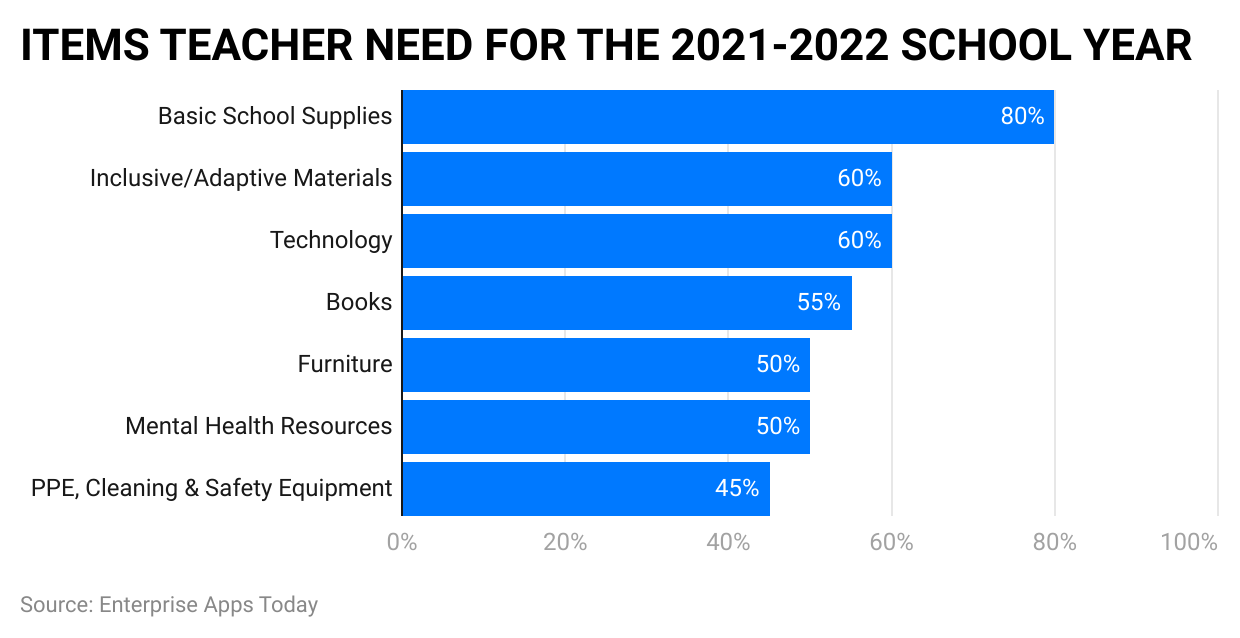
- As of 2022, in the U.S. the most used items required a share by teachers are 80% Basic school supplies.
- The other needs shares are followed by 60% (inclusive or adaptive material), 60% (technology), 55% (books), 50% (furniture), 50% (mental health resources), and 45% (PPE, Cleaning, and Safety equipment).
- Money was spent on incentives for students such as prices, candy, giveaways, etc. by 90% of teachers, and spent money on school supplies such as paper, pens, pencils, and stationary items by 82% of teachers in 2022.
- Whereas, 73% of teachers have spent their money on snacks and food and 66% of teachers on classroom furniture and different types of types of equipment.
by Country-Wise Time Spend
- In the United States, teachers in 2022 have spent classroom teaching, an average of 998 hours.
- Yearly hours spent in the classroom by teachers in the top country was Costa Rica with 1134 hours.
- Furthermore, time spent by teachers in Australia (1008 hours), Italy (941 hours), Canada (923 hours), France (911 hours), Japan (834 hours), Germany (813 hours), South Korea (749 hours), and Russia (701 hours).
by Salary
 (Source: 240tutoring.com)
- As of 2023 in the United States, the salary of a public school teacher is around $65,090 per year, which is followed by elementary teachers (465,420 / year, and high school teachers ($67,340 / year).
- As of reports, it has been observed that the salary earned by public school teachers is 30% more than private school teachers.
- Currently, as of 2023, the salary scale varies in different states of the U.S. resulting teacher’s annual salary being lowest in Mississippi ($47,162), highest in New York ($92,222), and nor lowest neither highest in Utah ($58,619).
by Workload
- As of 2022, the workloads of teachers have increased by 81% across the world.
- Teachers have spent more than 80% of their time taking care of student’s mental health.
- Teachers also spent 71% of their money on buying materials that are required in classrooms.
- Teachers have to face interruptions by students and almost 58% of interruption has increased in classrooms.
- A smaller budget was received for school supplies which were agreed by 35% of teachers.
- Random changes of assignments and classrooms were done by 25% of teachers.
by Grade Level
 (Source: wordsrated.com)
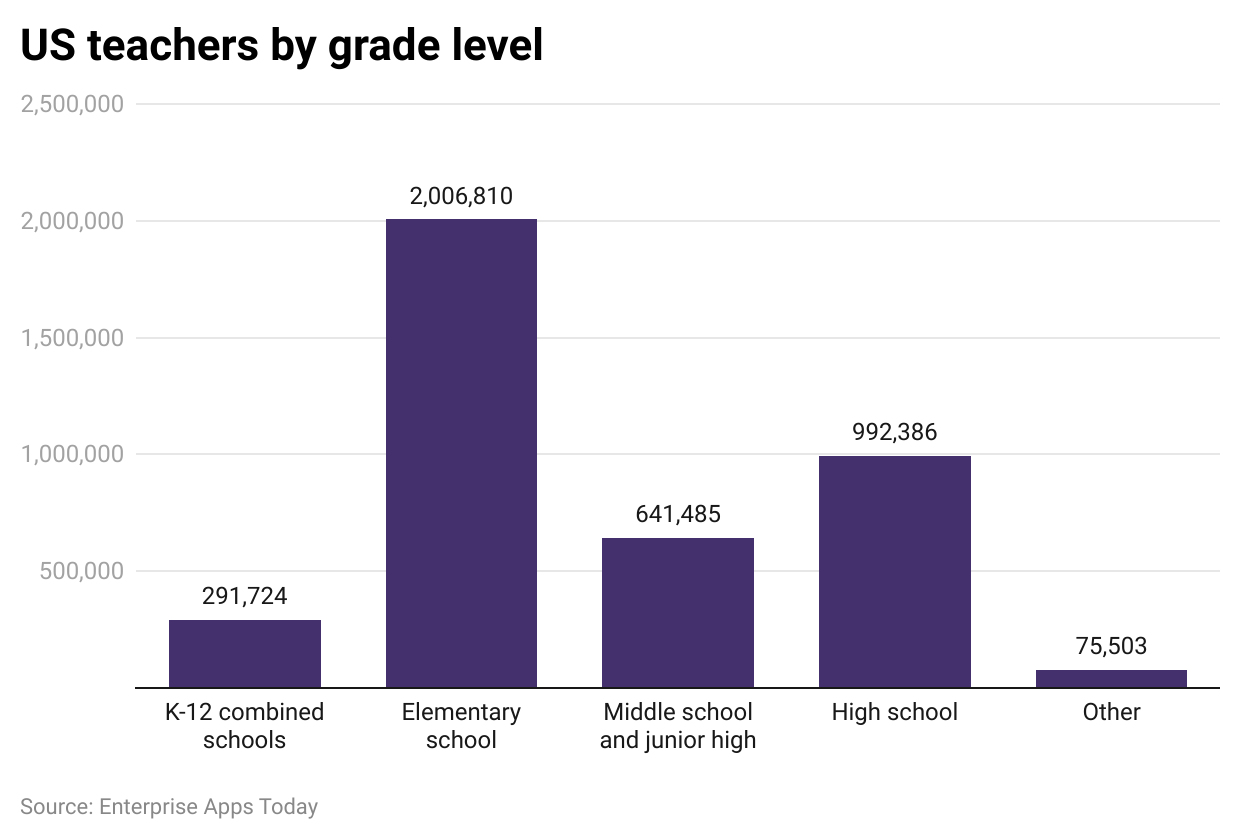
- As of 2023, in the U.S. there are almost 4,007,908 teachers available.
- Number of teachers available in K-12 combined schools is 291,724 resulting 7.3%.
- Furthermore, other grades are followed by Elementary schools is have 2,006,810 teachers (50.1%), Middle and junior high schools with 641,485 teachers (16%), High schools with 992,386 teachers (24.8%), and other teachers with 75,503 (1.9%).
by Technology Trends
- Mostly education sectors have experienced different trends in teaching along with the use of different technologies by teachers.
- Technology helped 73% of teachers by making the learning and teaching process easier.
- 56% of teachers also claimed that after implementing technology within the teaching process the engagement level of students has also increased.
- At the start of 2022, the outlook of classrooms has enhanced in American schools which was accepted by 58% of teachers.
- Teachers using digital learning platform has improved students' grades which was accepted by 81% of college students.
by Social Media
 (Source: mdreducation.com)
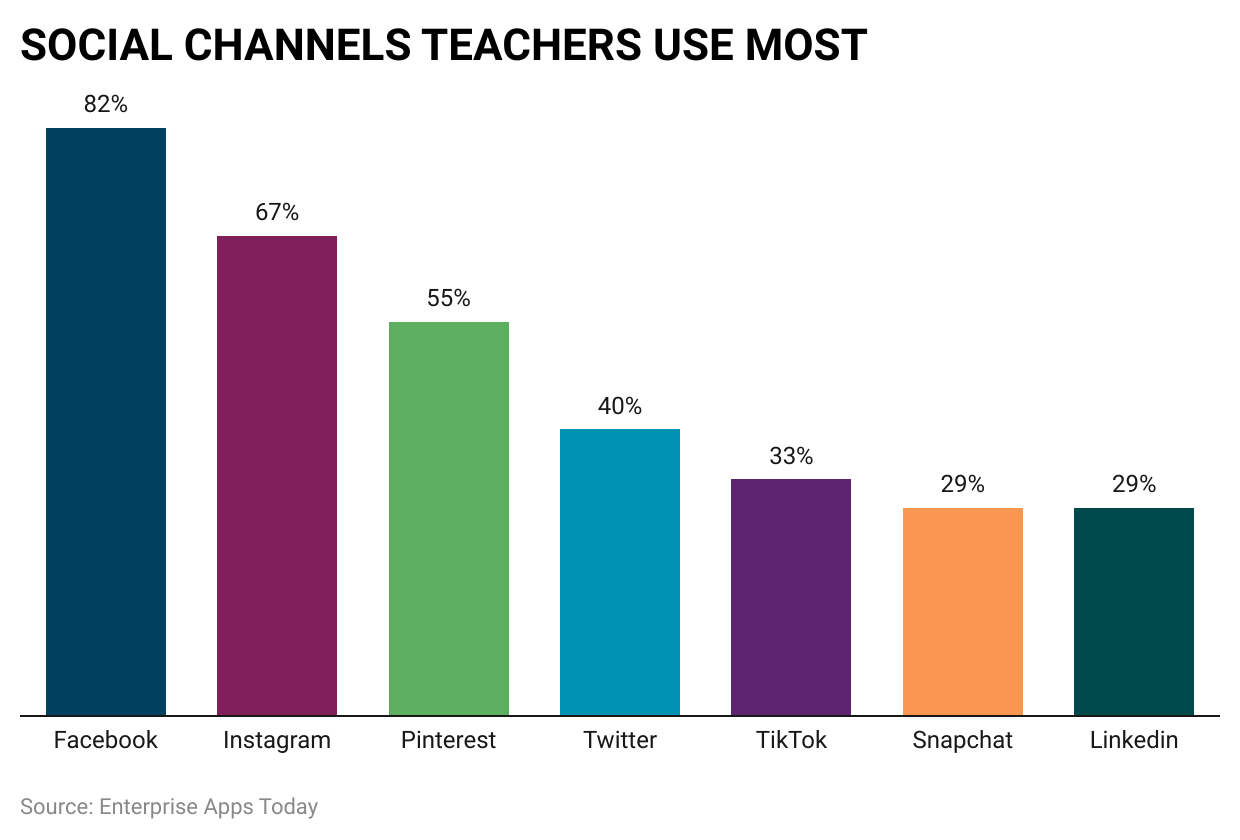
- In 2023, teachers mostly used social media channels to get new ideas for classrooms 80% of teachers got inspired by new teaching ideas, 57% of teachers got connected with other educators, and 35% of teachers followed education companies and organizations.
- The most used social media channel by teachers are Facebook by 82%, which is followed by Instagram (67%), Pinterest (55%), Twitter (40%), TikTok (33%), Snapchat
- (29%), LinkedIn (29%).
- 97% of Gen Z teachers were using social channels on a regular basis.
by Burnout Rate
- In the U.S. around 67% of teachers have considered burnout as a very serious issue in 2022.
- K-12 schools felt the most burnout cases, reported by 44% of teachers.
- Burnouts are a serious issue in this teaching profession accepted by 90% of teachers and thus in 2022 half of the teachers have left the teaching profession sooner than planned.
- In early 2022, teaching vacancies were posted by 44% of public schools.
- In the teaching profession, 43% of teachers said that their job postings remained unfulfilled.
- By the end of 2022, it was observed that 30% of teachers remained chronically absent.
- According to the Teacher Wellbeing Index 2022, more than 1/5 of schools and teaching support staff have also experienced burnout.
by Reason for Leaving a Job
- As McKinsey reports, the main reason for leaving the sector of education teachers is ‘compensation’, in which 42% of teachers have already quit their jobs in 2022 and 48% of teachers are planning to leave.
- The second reason is ‘expectation’ in which teachers by 31% have left and 33% are planning.
- ‘Well-being’ is the third reason where 23% of teachers have left their jobs and 31% have planned.
- Other reasons are followed by Leadership and workplace flexibility with teachers (31% already left and 30% planned to quit) and (21% left and 21% planned to leave) respectively.
by Shortage
- In the United States, due to shortages of teachers, 55% less planning time was allotted to teachers across the world.
- Because of teacher shortage, many curriculums have changed for 45% of students.
- The U.S. teaching industry has experienced a 49% teacher shortage.
- Due to the shortage of teachers, around 78% of teachers have experienced low-paying jobs.
- In 2022, it has also observed that 76% of teachers didn’t receive respect from student’s parents and others.
- Almost, 94% of teachers claimed that they need staff for maintaining students' physical and mental health conditions.
- Only 30% of teachers were satisfied with their profession in different American educational institutions.
by Vacancy
 (Source: wordsrated.com)
- In the United States, teacher vacancy has increased by 36,504.
- Teachers have created 90% of open teaching positions due to a shortage of staff in educational institutions.
- 44% of teacher vacancy has been increased by public schools and 31% in eliminatory schools.
- The teacher’s vacancy has increased due to 51% of resignations and 21% of retirement.
- The most teachers’ vacancies were observed in Mississippi with 68.59%, which is followed by Alabama (40.84%), West Virginia (39.46%), Maine (8.23%), and New Mexico (33.08%).
- The least teachers’ vacancies were observed in Minnesota (1.13%), New Jersey (1.08%), Texas (1.06%), Utah (0.54%), and Missouri (0.43%).
Conclusion
As of now after completing the article on Teacher Statistics it can be easily stated that teachers are the guiding stars in every student’s life. After analyzing the above statistics it has been observed that teachers are facing lots of issues in recent days and besides this factor the teaching profession is enhancing across the world by rooting a variety of features such as academic, social, cultural, financial as well as professional.
Thus, it can be concluded that by the end of 2030, the teachers’ job market is expected to grow by 7%. This article will help you understand the importance of teachers and all its trending.
FAQ.
Teacher’s statistics allow in predicting teachers condition across the world so that educational institutions across the world which will allow students to achieve effective education.
There are 10 important challenges faced by teachers are understanding different style, lack of effective communication, staying up to date with learning technology, communicating with parents, pressure from school administration, creating engaging lesson plans that fit the curriculum, behavior and classroom management, time-consuming administrative work, lack of funding, and burnout.
Effective skills are patience, adaptability, imagination, constant learning, teamwork, risk-taking, communication, mentoring, and leadership

Barry is a lover of everything technology. Figuring out how the software works and creating content to shed more light on the value it offers users is his favorite pastime. When not evaluating apps or programs, he's busy trying out new healthy recipes, doing yoga, meditating, or taking nature walks with his little one.