
NFT Statistics 2024 By Top Marketplaces, Collectors, Country, Gender, Art Segment, Traffic Source AND Website Traffic
Page Contents
- Introduction
- Editor’s Choice
- Facts About NFT
- General NFT Statistics
- NFT Statistics by Top Marketplaces
- Statistics by NFT Users
- Statistics by NFT Collectors
- NFT Statistics by Country Search Interest
- NFTs Adoption Rate Statistics by Country
- NFTs Investment Statistics by Gender
- Statistics by Most Expensive NFT
- Statistics by NFT meme
- Statistics by NFT Art Segment
- NFTs Statistics by Website Traffic
- NFT Statistics by Traffic Source
- NFTs Statistics by Environmental Impact
- NFT Block Chains Statistics by Trading Volume
- Conclusion
Introduction
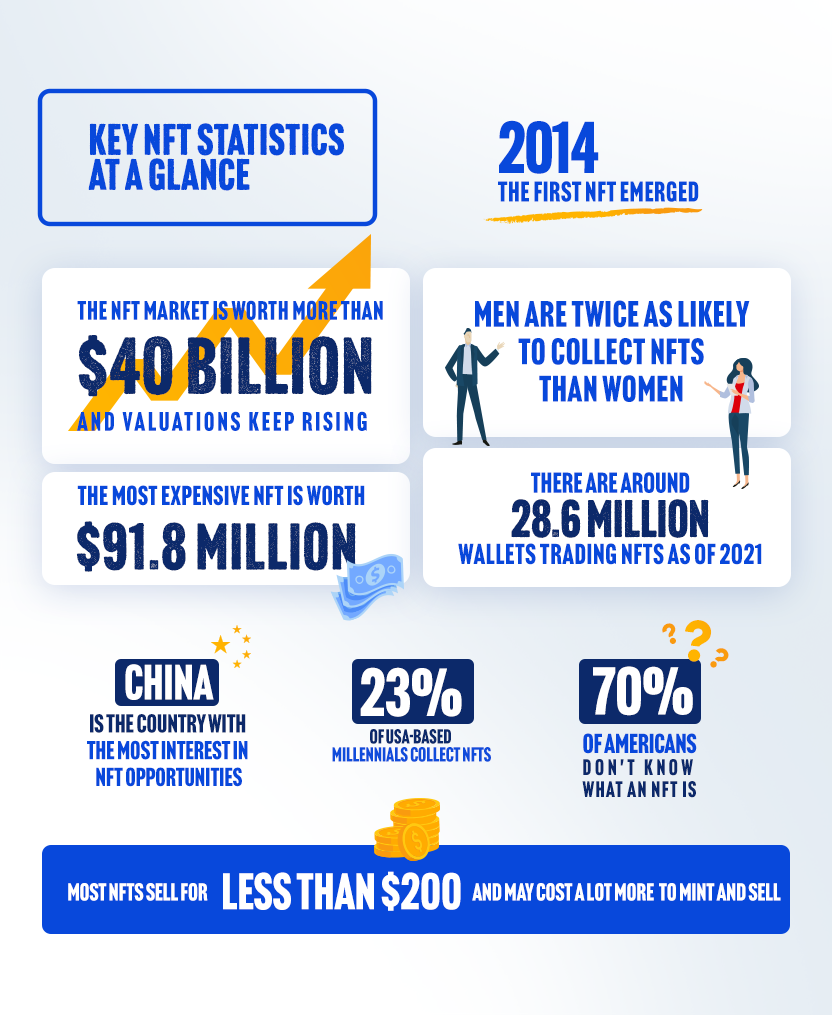
NFT Statistics: The reports say that the revenue in the NFT market is expected to reach $3,162 million by the year 2027 and the growth rate is expected to be 18.55% of CAGR starting from 2023 to 2027. NFTs are termed Non-fungible tokens Basically these are forms of assets that have been tokenized via a blockchain and which can’t be replicated.
In 2014 NFT first appeared in the global market. Depending on the market value NFTs can easily be traded or exchanged with other NFTs, cryptocurrencies, and money. These NFT Statistics include insights from various aspects that provide light on why NFT is one of the best trends today. You may also like to read top 10 most expensive NFTs in the world.
Editor’s Choice
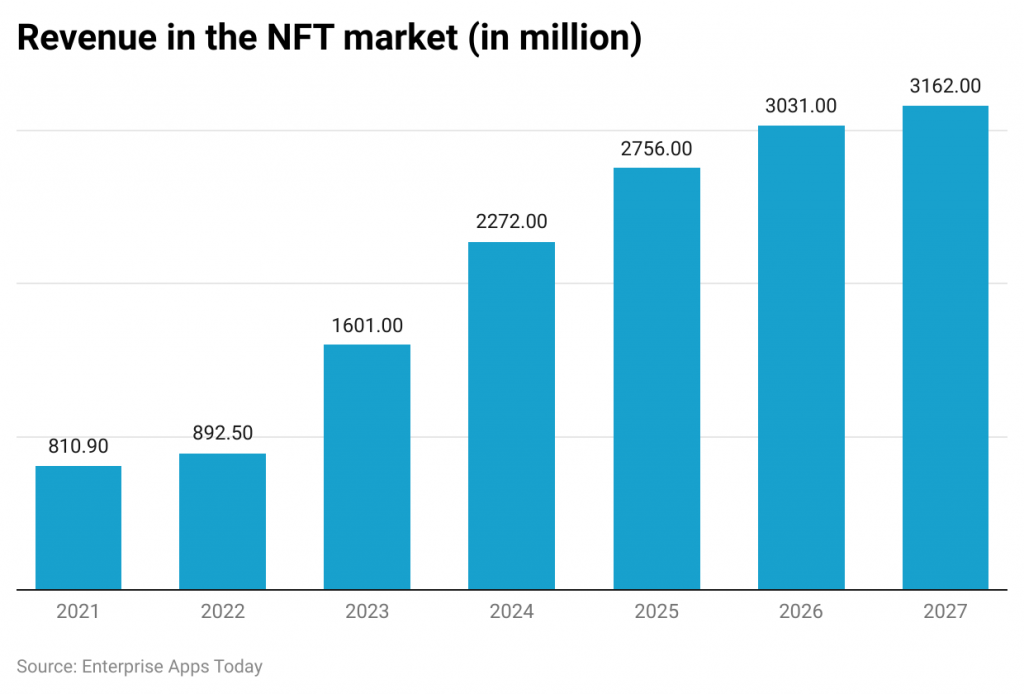
- As of 2023, the NFT market is expecting to earn revenue of almost $1,601 million, and in 2022 it resulted in $892.50 million.
- Whereas, in 2023 around the NFT market per user average revenue share is approximately $114.80, and in 2022 it remained at $86.62.
- If compared globally then in the United States, the highest revenue is supposed to be $781,900K by 2023.
- The user penetration rate of NFT is expected to hit 0.2% both by the end of 2023 and 2027.
- On the other hand, the number of NFT users in 2022 was 10.30 million, and in 2023 it is expected to be 13.95 million.
- By 2027, around 19.31 million users are expected to be in the NFT market.
- As of reports, ‘The MEG’ is the most valued NFT market whose gross worth is above $91 million in 2023.
- The global NFT market share was experienced by the Asia-Pacific region occupying 43%.
- To date, American people above 70% still do not have any idea about NFT.
- In January 2022, the highest trading volume of NFT was achieved by OpenSea resulting in $14.68 billion.
 (Source: strapi.supplain.io)
Facts About NFT
 (Reference: demandsage.com)
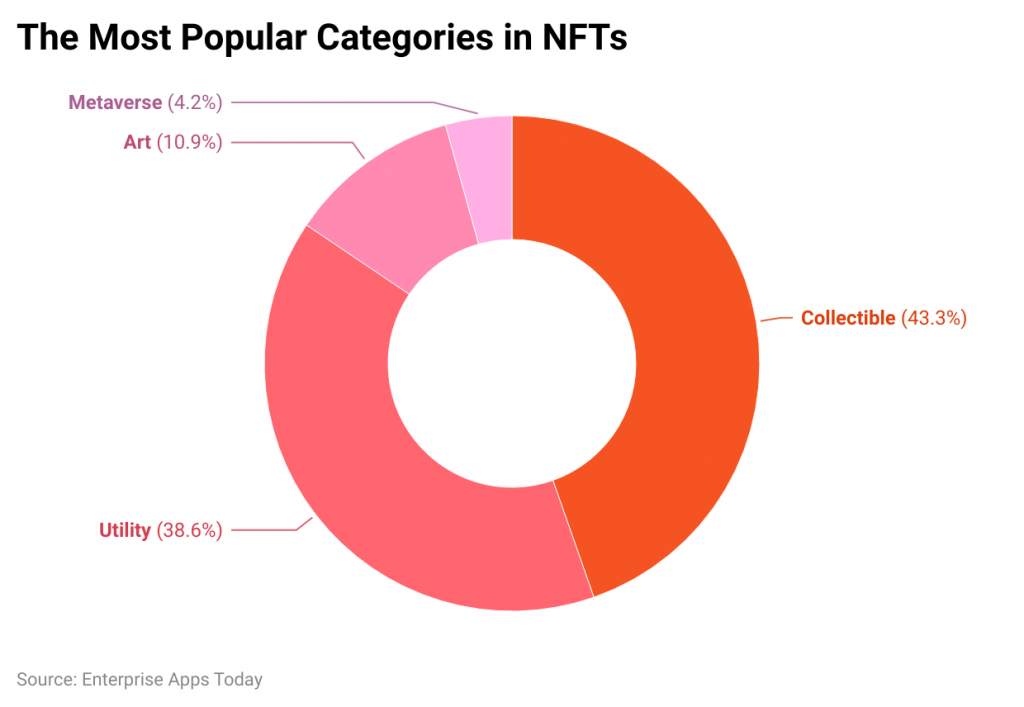
- As of 2023, the most popular category in NFTs is Collectibles with 43.3% of market share whereas; other categories' shares are followed by Utility (38.6%), Art (10.9%), and Metaverse (4.2%).
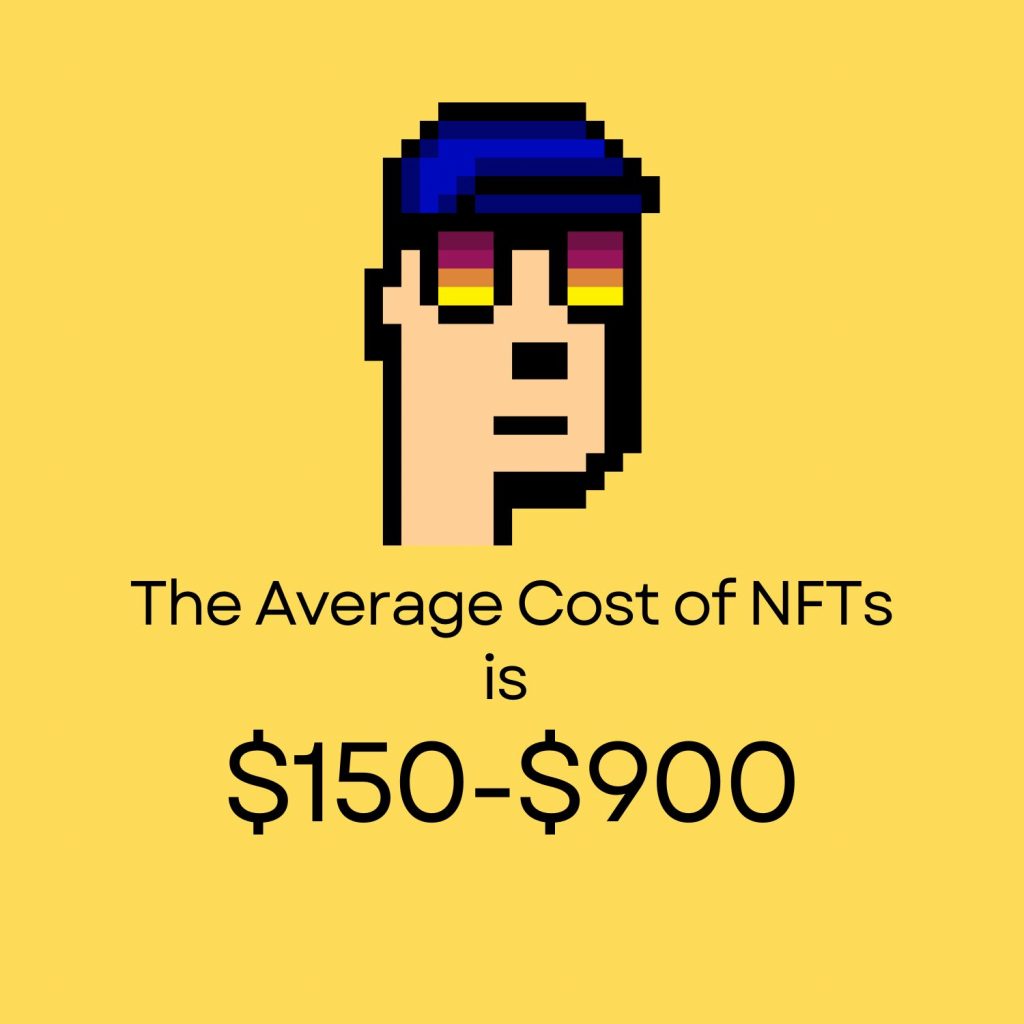
- Across the world, more than 50% of NFT sales have resulted below $200 by the end of 2022.
- In the United States in 2023, NFTs were collected by 23% of Gen Y.
- On the other hand, if segmented into gender distribution then male NFT collectors are 3 times more likely than male.
- OpenSea platform currently has more than 250,000 users who trade on NFT per month in 2023.
- According to Bankless Times reports, in 2023 almost 10,000 wallets interacted with NFT results every day sales more than 12,000 NFT sales.
- In which, regular 10,000 active wallets were engaging with NFT with a unique purchase of 6,000 approximately.
- As of Decrypt in 2022, across the world, the sales of the NFT industry have generated around $24.7 billion.
- Whereas, the NFT traditional art sales have reached $67.8 billion by the end of 2022.
- According to Technavio, in 2022, the global market share of NFT has grown by 30.72%
General NFT Statistics
 (Reference: statista.com)
- In 2023, the NFT market is expecting to earn revenue of almost $1,601 million and in 2022 it resulted in $892.50 million across the world.
- Whereas, revenue rates are expected in coming years followed by 2024 ($2,272 million), 2025 ($2,756 million), 2026 ($3,031 million), and 2027 ($3,162 million).
- The average revenue per user over the NFT market is going to reach higher by $134.90 in 2024, which is followed by $150.10 (2025), $158.50 (2026), and $163.80 (2027).
- According to Statista 2022, the global key players share percentage of NFT are followed by Open Sea (87%), LooksRare (6%), X2Y2 (3%), Blur (2%), and others (2%).
- On the other hand, the number of NFT users in the next 3 years is expected to be 16.84 million by 2024, followed by 2025 (18.35 million), 2026 (19.13 million), and 2027 (19.31 million).
- By the end of 2025, the market size of NFT is going to reach $80 billion worth.
- The top 5 NFT sales of 2022 are followed by $11.8 million sales of CryptoPunk #7523, and $7.7 million sales (#3100 CryptoPunk).
- Whereas, other top brands volume aided are Axie Infinity ($3.94 billion), CryprtoPunk ($2.40 billion), and NBA Top Shot ($0.78 billion).
- Most interested NFT users were available in Asia and Oceania in which the highest rank was secured by China with an interest of 100.
- In the 1st quarter of 2022, almost 9.5 million unique addresses of NFTs were sold.
- It has also been observed that the highest NFT adoption rates were found in Asia including 5 top nations.
NFT Statistics by Top Marketplaces
 (Reference: academyofanimatedart.com)
- In January 2022, the time highest trading volume of NFT was achieved by OpenSea resulting in $14.68 billion with an average price of $938.99 and 1.3 million traders.
- The next top brands are Axie Infinity with a volume of $3.94 billion with a $216.15 average price and 1.6 million traders.
- Furthermore, other market brands of NFT’s volume are followed by CryptoPunks ($2.40 billion), NBA Top Shot ($0.78 billion), Magic Eden ($0.62 billion), Solanart ($0.59 million), Mobox ($0.53 billion), AtomicMarket ($0.32 billion), Rarible ($0.28 billion), and SuperRare.co ($0.21 billion).
- On the other hand, the top NFT market’s average price and number of traders are followed by OpenSea ($938.99 and 1.3 million), Axie Infinity ($216.15 and 1.6 million), CryptoPunks ($123K and 5.6K), NBA Top Shot ($63.63 and 492K), Magic Eden ($308.74 and 304K), Solanart ($1100 and 170K), Mobox ($790.81 and 59K), AtomicMarket ($24.98 and 895K), Rarible ($990.79 and 92K), and SuperRare.co ($7,940 and 5.4K).
Statistics by NFT Users
 (Reference: statcdn.com)
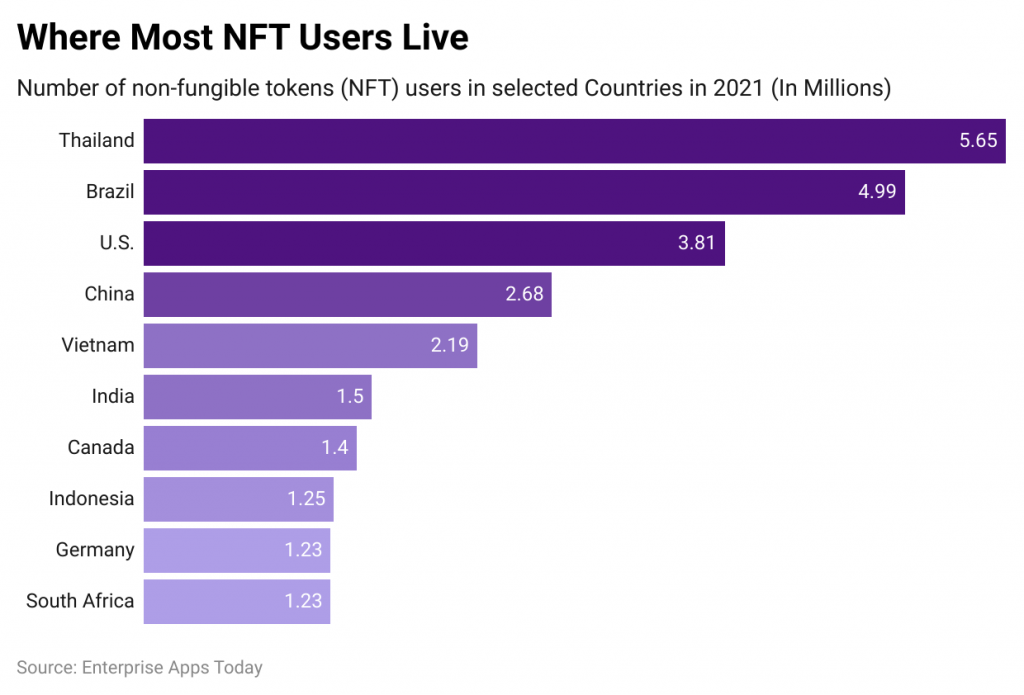
- According to Statista, by the end of 2022, across the world, Thailand will have the most NFT users which resulted in 5.65 million.
- The next most users of NFTs are Brazil and the United States with 4.99 million and 3.81 million.
- Furthermore, other countries most NFT users are followed by China (2.68 million), Vietnam (2.19 million), India (1.50 million), Canada (1.40 million), Indonesia (1.25 million), Germany (1.23 million), and South Africa (1.23 million).
Statistics by NFT Collectors
 (Reference: academyofanimatedart.com)
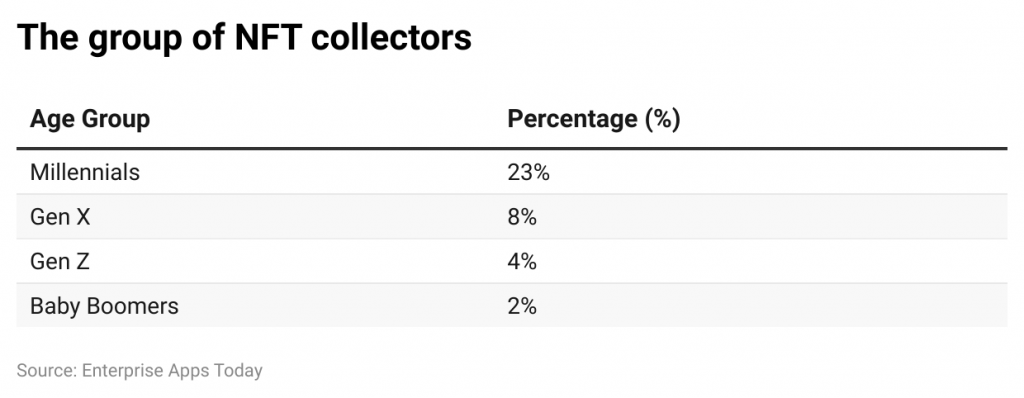
- According to Morning Consult 2022, nearly 1/3 of Millennials have collected NFTs which is almost 23% of Millennials. They are also termed the largest group of NFT collectors.
- Other current generation shares are followed by Gen X (8%), Gen Z (4%), and Baby Boomers (2%).
- According to the survey of the United States, it has been observed that physical collection was made by 45% of male respondents which is 2 times more than females.
- Whereas, in the case of digital NFT collectibles were 15% male and 4% female.
NFT Statistics by Country Search Interest
- In the list of top 5, there are three Southeast Asian countries that included the highest search interest in NFT China with 100 search interest in NFT which is followed by Singapore (74), and Venezuela (67).
- Furthermore, the world’s top crypto-owning nations those were having search interest in NFT are Hong Kong SAR (56), the Philippines (49), South Korea (46), Malta (43), Cyprus (40), Australia (39), and Canada (39).
NFTs Adoption Rate Statistics by Country
- In 2022, the highest share of individuals who owned NFT was observed in the Philippines, Thailand, and Malaysia. On the other side least likely countries to own are the United States, the UK, and Canada.
- According to Statista 2022, adults have purchased or owned NFTs in the Philippines with 32% share.
- Whereas, other top countries with adults share a percentage of NFT are followed by Thailand (26.6%), Malaysia (23.9%), UAE (23.4%), Vietnam (17.4%), Nigeria (13.7%), and Brazil (12.1%),
- Least country share of people owned or purchased NFTs are Hong Kong SAR (10.7%), Venezuela (10.6%), Peru (9.9%), Columbia (8.4%), South Africa (8.%), Argentina (7.4%), Singapore (6.8%), Canada (5.6%), Australia (4.6%), United States (4%), United Kingdom (2.5%), and Japan (2.2%).
NFTs Investment Statistics by Gender
- In the United States in 2023, the main reason for buying NFT is the great return on investment in which investment of females remained at 40% which is higher than males by 39%.
- Art fans invested in NFT resulting in 39% male and 28% female, invested in NFT as family and friends are buying them resulting in 34% male and 22% female.
- Other reasons and their gender statistics are followed by Early adoption (33% male and 18% female), Because of its popularity and trends (30% male and 36% female), as it includes bragging rights (21% male and 7% female).
Statistics by Most Expensive NFT
- As of reports, the most expensive NFT is ‘The Merge’ is the most valued market whose gross worth is above $91.8 million in 2023.
- The 2nd and 3rd most expensive NFTs ever sold are ‘The First 5000 days’ and ‘Human One’ worth $69 million and $29.98 million respectively.
- Furthermore, other expensive NFTs ever sold are followed by CryptoPunk #7523 ($11.75 million), CryptoPunk #3100 ($7.58 million), Xcopy: Right-Click and Save As Guy ($7.09 million), Art Blocks, Ringers #109 ($6.93 million), Crossroad ($6.6 million), This Changed Everything ($5.4 million), and Save Thousands of Lives ($4.5 million).
Statistics by NFT meme
- The most expensive NFT meme of all time was named ’Doge’ fetched a value of around $4 million in 2022, which depicts a Japanese breed Shiba Inn.
- The other expensive Meme NFTs statistics by their selling price are followed by Nyan Cat ($6 million), Disaster Girl ($5 million), and Overly Attached Girlfriend ($4.1 million).
- Whereas, are Grumpy Cat, Leave Britney Alone, Bad Luck Brain, and Success Kid with the least expensive Meme NFTs selling prices are $83K, $ 44 K, $36K, and $35K respectively.
Statistics by NFT Art Segment
 (Reference: vpnalert.com)
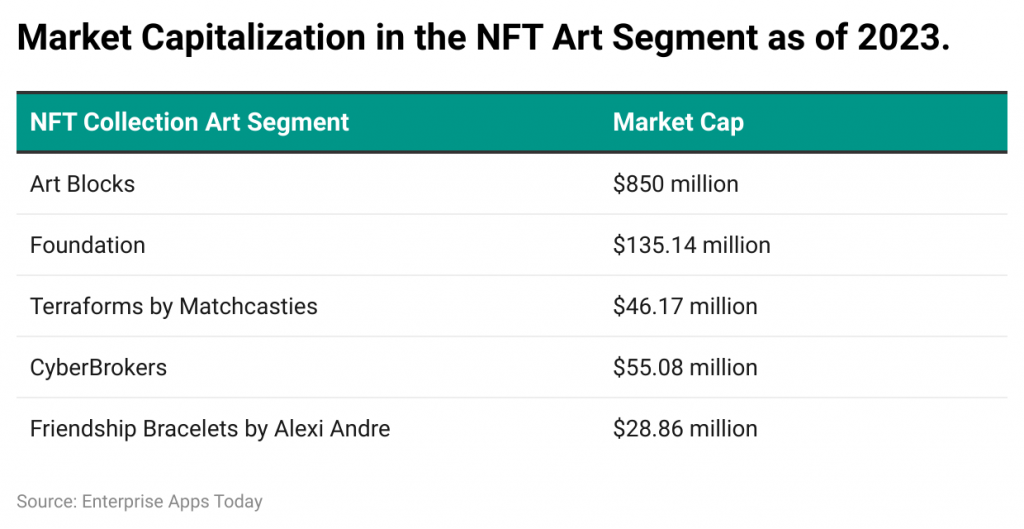
- As of 15 January 2023, the NFT art segment market capitalizations are Art Blocks ($850 million) while, other collections are Foundation ($135.14 million), Terraforms by Mathcastles ($46.17 million), CyberBrokers ($55.08 million), and Friendship Bracelets by Alexi Andre ($28.86 million).
- In the month of April 2023, the NFT art segment has resulted in sales of $15.15 million of which $14,087 million sales came from secondary y sales and $1,071 million from primary sales.
- On the other hand, in January 2022 the sales revenue accounted for in the NFT art segment resulted in $1.54 million.
- In the month of April 2022, the art NFT segment sales turned out to be $70.9K, which is followed by August ($22.3K), and December ($34.1K).
- Whereas, in January 2023 the art segment NFT sales increased $17.2 million.
NFTs Statistics by Website Traffic
 (Reference: similarweb.com)
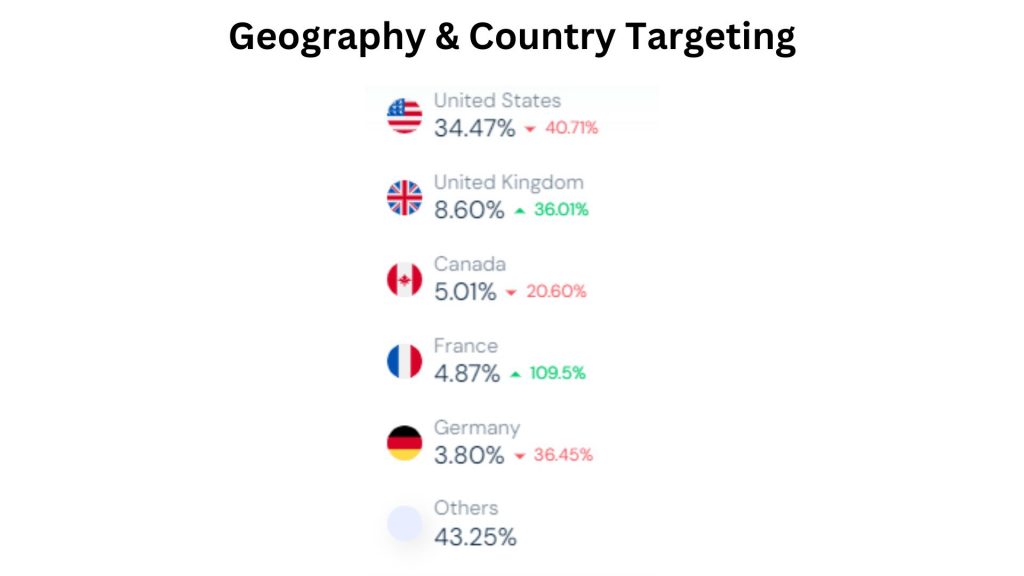
- In the last month, the United States had 34.47% of total traffic on nft-stats.com, but it recorded a decrease in total website visitors by 40.71%.
- Other countries recorded the following contribution in total traffic are followed by United Kingdom (8.60%) increased by 36.01%, Canada (5.01%) decreased by 20.60%, France (4.87%) increased by 109.5%, Germany (3.80%) decreased by 36.455 and other countries collectively made around 43.25%.
NFT Statistics by Traffic Source
 (Reference: similarweb.com)
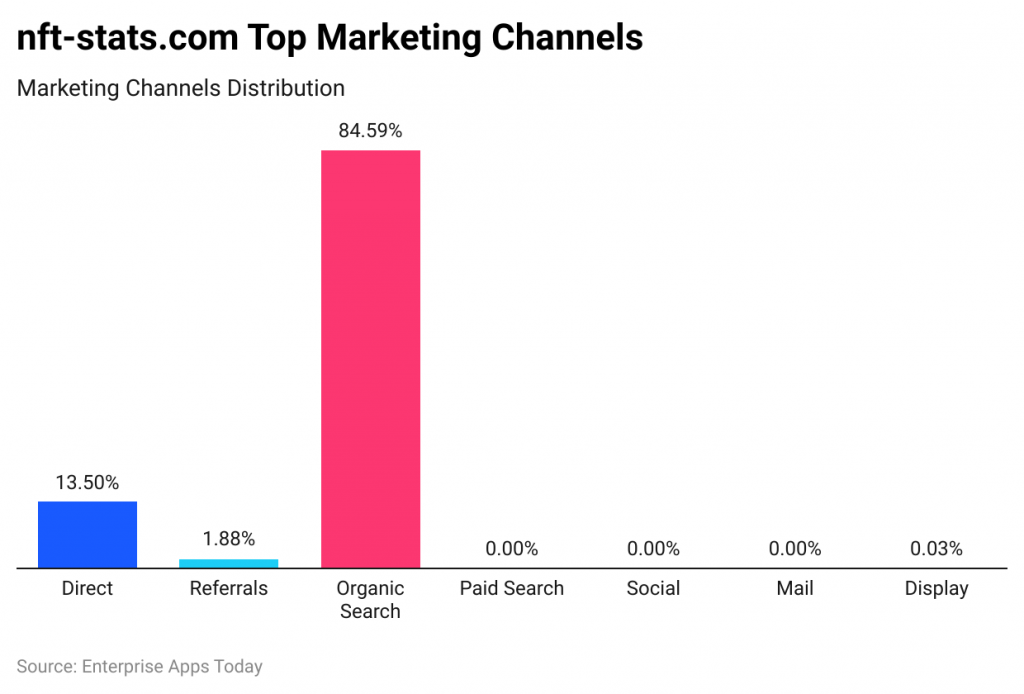
- As per the NFT statistics, the highest rate of traffic towards nft-stats.com is by organic search resulting in 84.59%.
- 50% is direct traffic while 3.10% is from referrals of social media networks.
NFTs Statistics by Environmental Impact
- As of now, the electrical energy consumption of Ethereum is 44.94 terawatt-hours and in each, it releases approximately 21.35 metric tons of Carbon dioxide.
- In an average U.S. household, one Ethereum transaction expends around 120KWh of energy.
- In 2022, energy usage has been reduced by using more than 99% Ethereum 2.0 technology.
- On average the NFT transaction produces CO2 around 42kg.
- NFTs' carbon footprint allows for bringing down CO2 by 2.11 kg.
- Whereas, Polygon, Tezos, and Symbol allow in emitting carbon by less than 1%.
NFT Block Chains Statistics by Trading Volume
 (Reference: techcrunch.com)
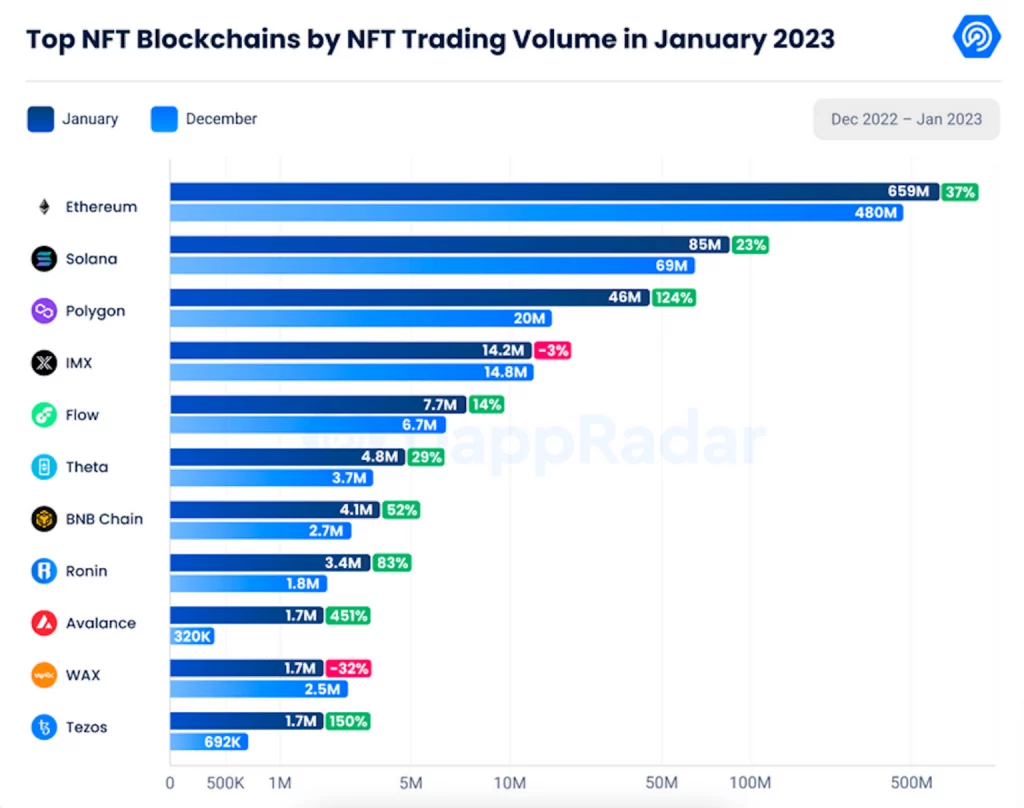
- As of January 2023, the highest NFT’s trading volume of Ethereum is $659 million which has increased by 37%
- Whereas, other NFT blockchains by NFT trading volumes are followed by Solana: $85 million (+23%), Polygon: $46 million (+124%), IMX: $14.2 million (-3%), Flow: $7.7 million (+14%), Theta: $4.8 million (+29%), BNB Chain: $4.1 million (+52%), Ronin: $3.4 million (+83%), Avalance: $1.7 million (+451%), Wax: $1.7 million (-32%), and Tezos: $1.7 million (150%).
Conclusion
As of today after completing the statistics on the Non-Fungible Token it can be concluded that NFTs marketplaces have experienced huge growth rates with rapid trading. Across the world, currently, many users are enjoying the benefits and profits by investing in different schemes of NFTs.
This is a huge marketplace of smart contracts on blockchain networks that enable proof of ownership of both physical and digital assets. This article includes effective statistics and trends that will help you gain an idea about the NFT business.
Sources
FAQ.
There are some important challenges are copyright, intellectual property rights, ownership rights, privacy and data protection laws, money laundering, security issues, risk of fraud, taxation aspects, etc.
As after completing the article it is clear that NFTs enables many new investment opportunities basically for collectors such as digital assets can be increased and profit from the appreciation of the assets over long time.
It’s an easy way to earn profit is by buying at low cost and selling high, users must hold onto them until their value increases and another effective way is by creating valuable NFTs those are highly demanding.
There are three important elements that help in making NFTs successful are Scarcity, Meaning, and Community.

Barry is a lover of everything technology. Figuring out how the software works and creating content to shed more light on the value it offers users is his favorite pastime. When not evaluating apps or programs, he's busy trying out new healthy recipes, doing yoga, meditating, or taking nature walks with his little one.