
Women Entrepreneurship Statistics

Page Contents
- Introduction:
- Editor’s Choice
- Facts About Women Wntrepreneurship
- Reasons Behind Business Run by American Women
- Challenges Faced by Women Entrepreneurs
- General Statistics of Women Entrepreneurship
- Entrepreneur Wage Gap By Education
- Women Entrepreneur Statistics By Race
- Women Entrepreneur Generation Statistics
- Financial Indicators of Women-owned Business in the United States
- United States Having More Employer Firms
- A Total Business Owned by the U.S.
- Ethnicity Statistics of Women Entrepreneurs
- The Age of American Women Entrepreneur’s Business
- States with the Highest Female Entrepreneurs
- States with Lowest Female Entrepreneurs
- Groups that Supported and Promoted Startup for Women
- Few Important Statistics
- Conclusion
Introduction:
Women Entrepreneurship Statistics: Women entrepreneurs are defined as individuals or groups of women who start, plan, and run a business. This woman entrepreneur allows her to become a self-confident, innovative, and versatile woman seeking both her financial independence as well as the ability to hire others. According to a report in 2023, women in the United States opened more than 1,200 new enterprises each day, an average of 1,821 in 2022. By the end of 2022, approximately $1.8–1.9 trillion worth of revenue was produced by women-owned businesses, including 42% of small women-owned businesses. These women's entrepreneurship statistics include ideas from many perspectives that provide better explanations.
Editor’s Choice
- By the end of 2022, the United States will have around 42% of women owning businesses, which is around 13 million of the total population.
- As of 2023, U.S. women entrepreneurs employed more than 9.4 million people.
- In November 2022, U.S. women held around 42% of small enterprises.
- In 2022, women will have launched an average of 1,821 new enterprises every day.
- An average of $1.8 trillion is generated annually by many different businesses run by women in the U.S. in 2022.
- In 2022, there will be an increase of 114% in women entrepreneurs as compared to the last 20 years.
- As of 2022, 47% of women-owned businesses are run by women of color.
- In the United States, micro-businesses are owned by almost 90.3% of women, which is less than men.
- According to 2022 statistics, women entrepreneurs can receive an average of $ 39,000 in loan amount.
Facts About Women Wntrepreneurship
- Businesses owned by women will be in the top 10 states of the United Nations by the end of 2022: Washington, D.C., Florida, Colorado, Vermont, Georgia, California, Wyoming, Louisiana, Maryland, and New York.
- According to the report of Women in Business Trends, there will be no such generation gap in women's entrepreneurship in the United States, in 2022. Gen X (43–58 years) = 69%, Millennials (27–42 years) = 19%, and Boomers (18–26 years) = 11%.
- As of 2022, American women are mostly linked with different kinds of businesses: retail industries (22%), health and beauty product industries (16%), business industries (13%), food and restaurant sectors (12%), and educational platforms (5%).
- According to 2022 reports, almost 59% of businesses run by women in the U.S. turned out to be profitable, and 35% remained unprofitable.
- The growth strategy of women's entrepreneurship includes 58% hiring, 37% digital marketing investments, and 31% business expansion.
- Women-owned businesses in the United States will have increased by 63% by 2022.
Reasons Behind Business Run by American Women
- According to the GEM report, 72% of women desired to increase their money.
- Around 71% of women wanted to make a difference by making their lives better.
- 46% started investing in businesses due to a shortage of jobs and job insecurity.
- According to the report by Guidant, 58% of women desired to become bosses.
- 38% of women were not satisfied with their working culture in the corporate sector.
- 30% of female entrepreneurs started their business careers by following their passion.
- 21% started investing because of financial insecurity, not being willing to retire, or getting bored in service.
Challenges Faced by Women Entrepreneurs
- Establishing a strong initial impression turns out to be the biggest challenge faced by most women.
- Maintaining a balance between personal and professional lives.
- Finding an effective support system that can guide you throughout.
- Receiving unnecessary advice from others even without asking.
- Struggling with unrealistic and irrational expectations.
- Women with smaller business ideas mostly faced challenges with government funding.
General Statistics of Women Entrepreneurship
- According to 2022, QuickBooks women entrepreneurs' statistics, the main objective of small businesses owned by women was to increase finance and financial assistance. 49% financial help, 15% hiring help, and 10% technological help
- In 2022, 47% of new businesses will have been started by women, which numbers around 2.35 million.
- According to BIZ2Credit 2022, businesses run by women received loans with an average amount of $497, which is almost 50% less than a business run by men. The credit score of a women-owned business requires 580 points, and the business age needs to be at least 48 months.
- In 2022, U.S. women business founders only received 2.4% of their funding from venture capital.
- In November 2022, U.S. women held around 42% of small enterprises.
- An average of $1.8 trillion is generated annually by many different businesses run by women in the U.S. in 2022.
- By the end of 2022, U.S. women will have launched an average of 1,821 new enterprises every day.
- By 2022, women of color will control 47% of businesses owned by women.
(Reference: zippia.com)
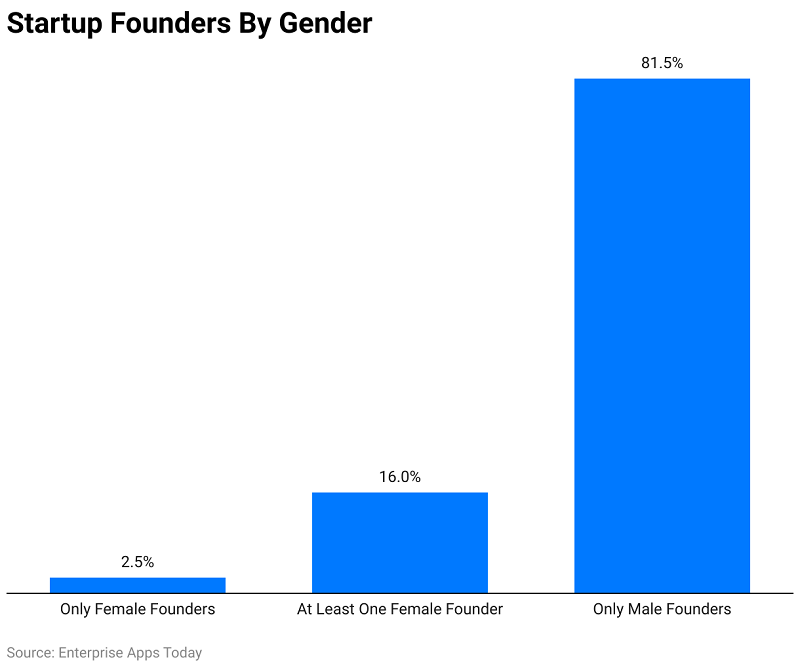
- The above graph describes the number of United States startup founders by gender in 2022.
- Only 2.5% of businesses are owned by female founders who received an average negotiated salary.
- 16% of businesses have at least one female founder.
(Reference: statista.com)
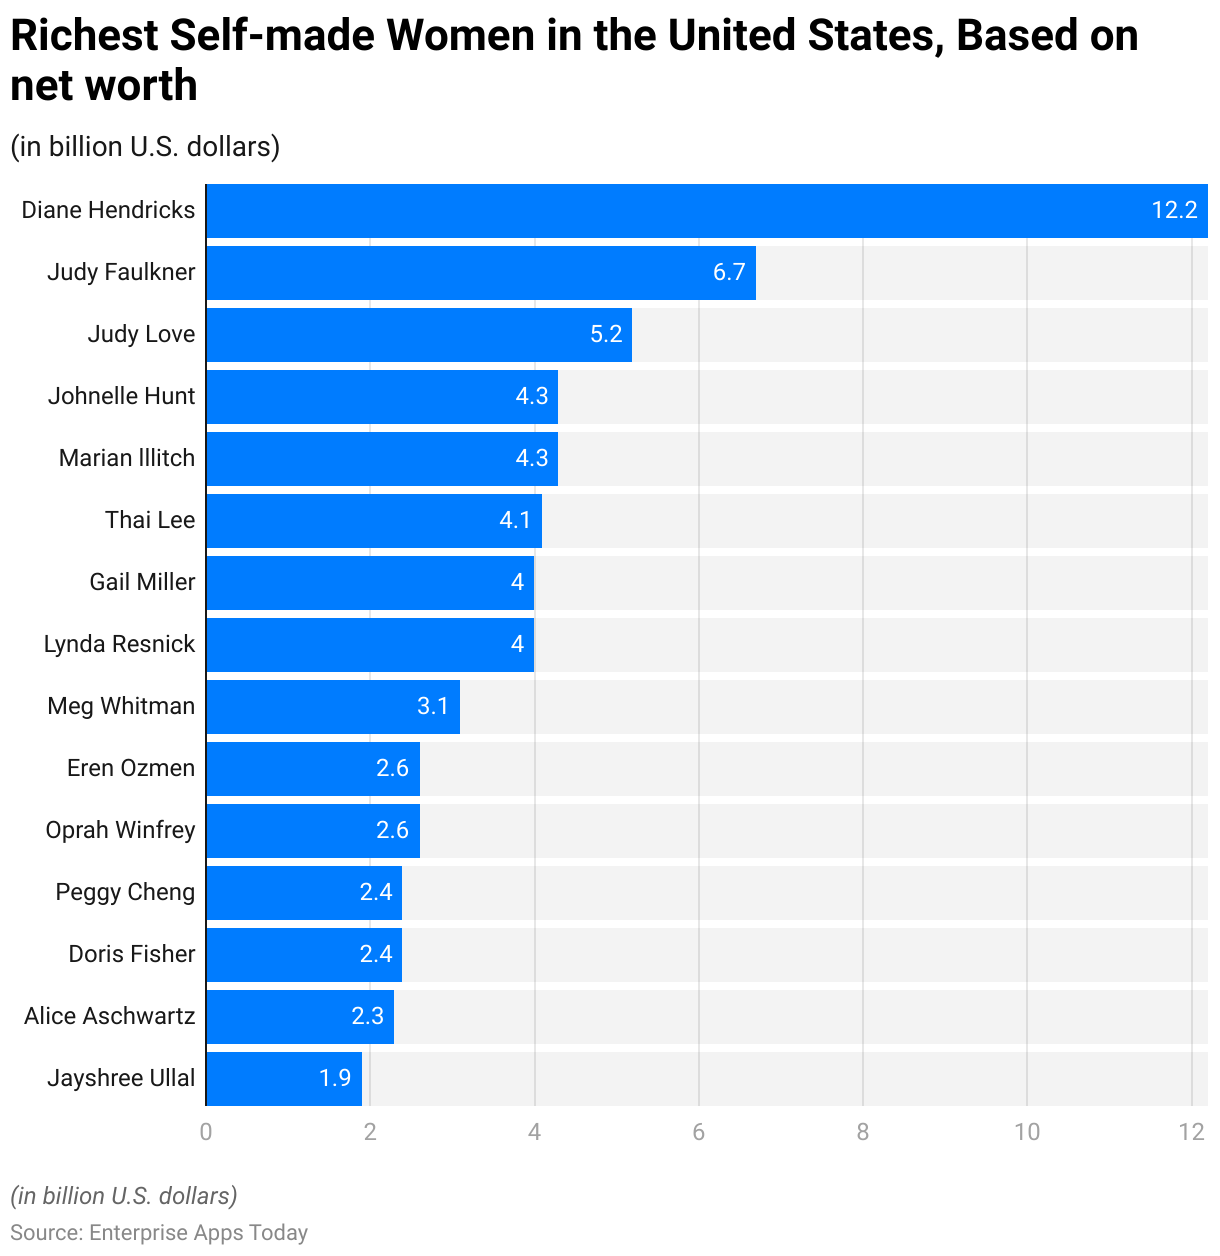
- The above graph represents some top-ranked names of the United States women entrepreneurs of 2022.
- Diane Hendricks with a $12.2 billion net worth.
- Judy Faulkner = $6.7 billion
- Judy Love = $5.2 billion
- Johnelle Hunt = $4.3 billion
- Marian Illitch = $4.3 billion
- Thai Lee = $4.1 billion
- Gail Miller = $4 billion
- Lynda Resnick = $4 billion
- Meg Whitman = $3.1 billion
- Eren Ozmen = $2.6 billion
- Oprah Winfrey = $2.6 billion
- Peggy Cheng = $2.4 billion
- Doris Fisher = $2.4 billion
- Alice Schwartz = $2.3 billion
- Jayshree Ullal = $1.9 billion
(Source: whattobecome.com)
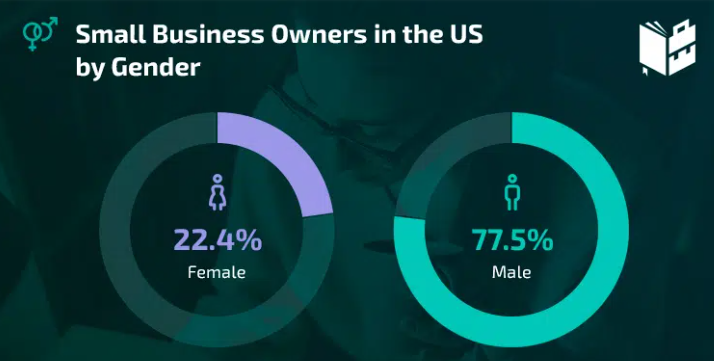
- The percentage of women who own small business enterprises in the U.S. is about 22.4%, according to statistics for 2022.
- In the case of small businesses 2022 survey says, in the last 10 years about 23.7% of businesses were owned by women and about 49.1% of women-owned businesses are on track for the last 5 years.
(Source: guidantfinancial.com)
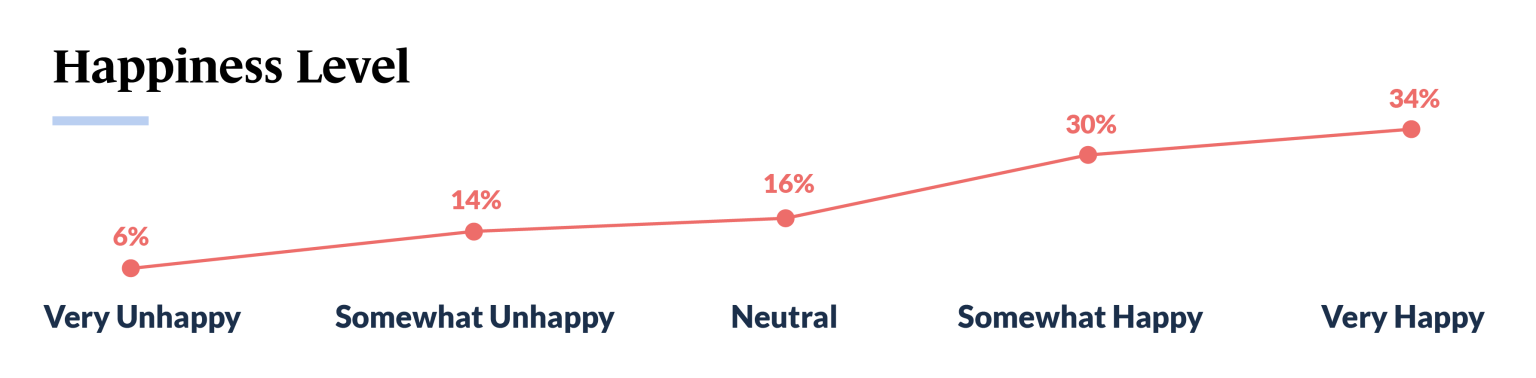
The above graph describes the American entrepreneur’s levels of happiness in 2022.
- More than 60% of respondents said that they were satisfied with owning their businesses.
- Very happy = 34%
- Somewhat happy = 30%
- Neutral = 16%
- Somewhat unhappy = 14%
- Very unhappy = 6%

(Source: zippia.com)
- The average annual income of a U.S. female entrepreneur in 2022 was $ 56,390.
(Reference: legalzoom.com)
Entrepreneur Wage Gap By Education
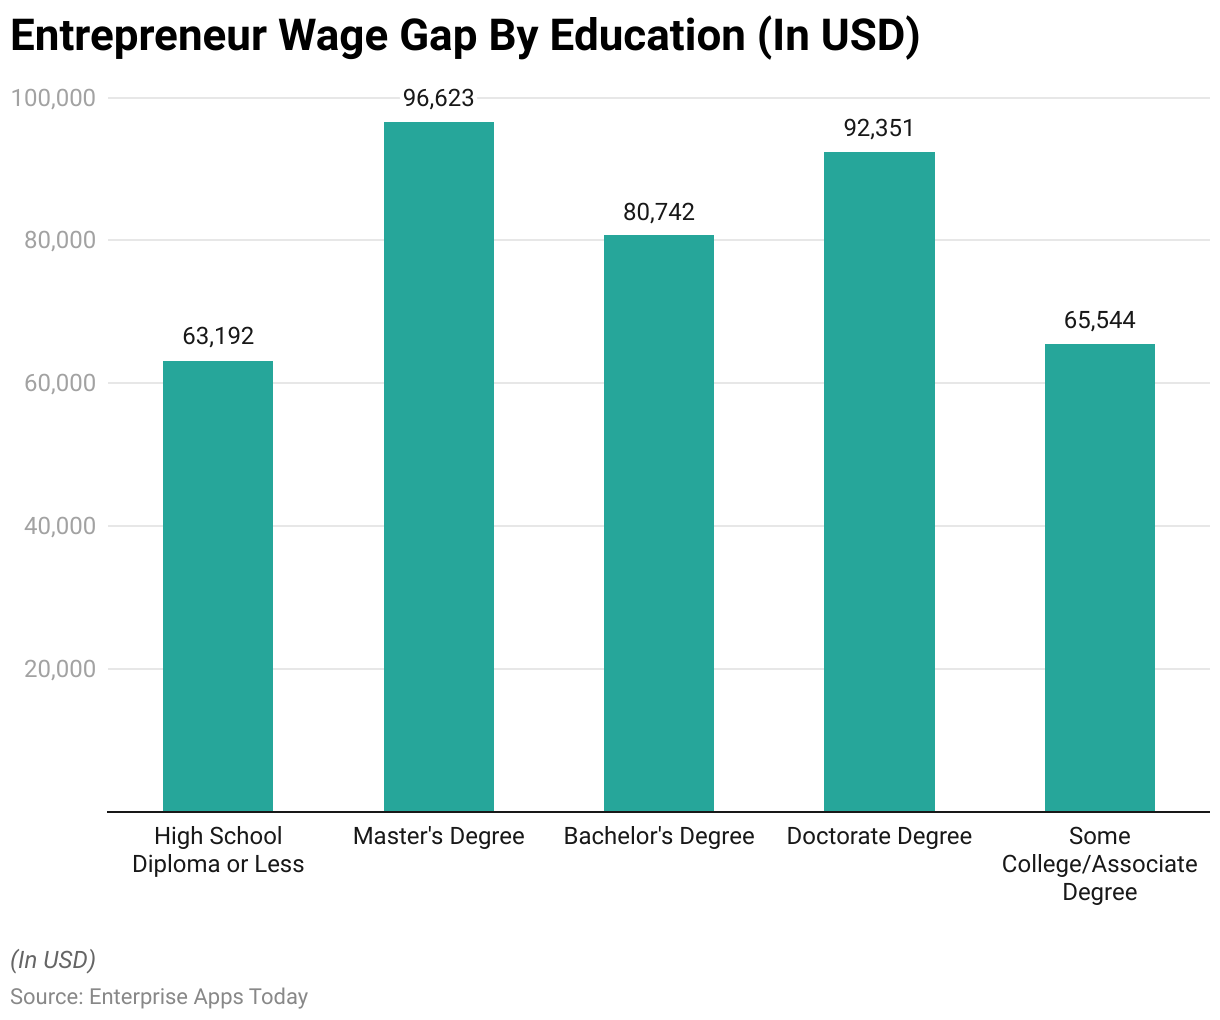
(Reference: zippia.com)
The above graph describes the educational qualification and annual earnings of U.S. women business owners in 2022.
- Master’s degree = $ 96,000
- Doctorate degree = $ 92,000
- Bachelor’s degree = $ 80,000
- College / Associate degree = $ 65,000
- High school / Less degree = $ 63,000
Women Entrepreneur Statistics By Race
While businesses owned by women continue to be predominantly “White or Caucasian” (78.4%), our research this year indicates a positive shift toward businesses owned by women of color. More specifically, businesses owned by Black or African-American businesswomen increased by 33% since 2022 while entrepreneurs who identify as either “Hispanic, Latino or Spanish Origin” or “Asian or Asian-American” both doubled since last year – all notable increases that indicate progress toward equal opportunity among women from diverse backgrounds within small business ownership.
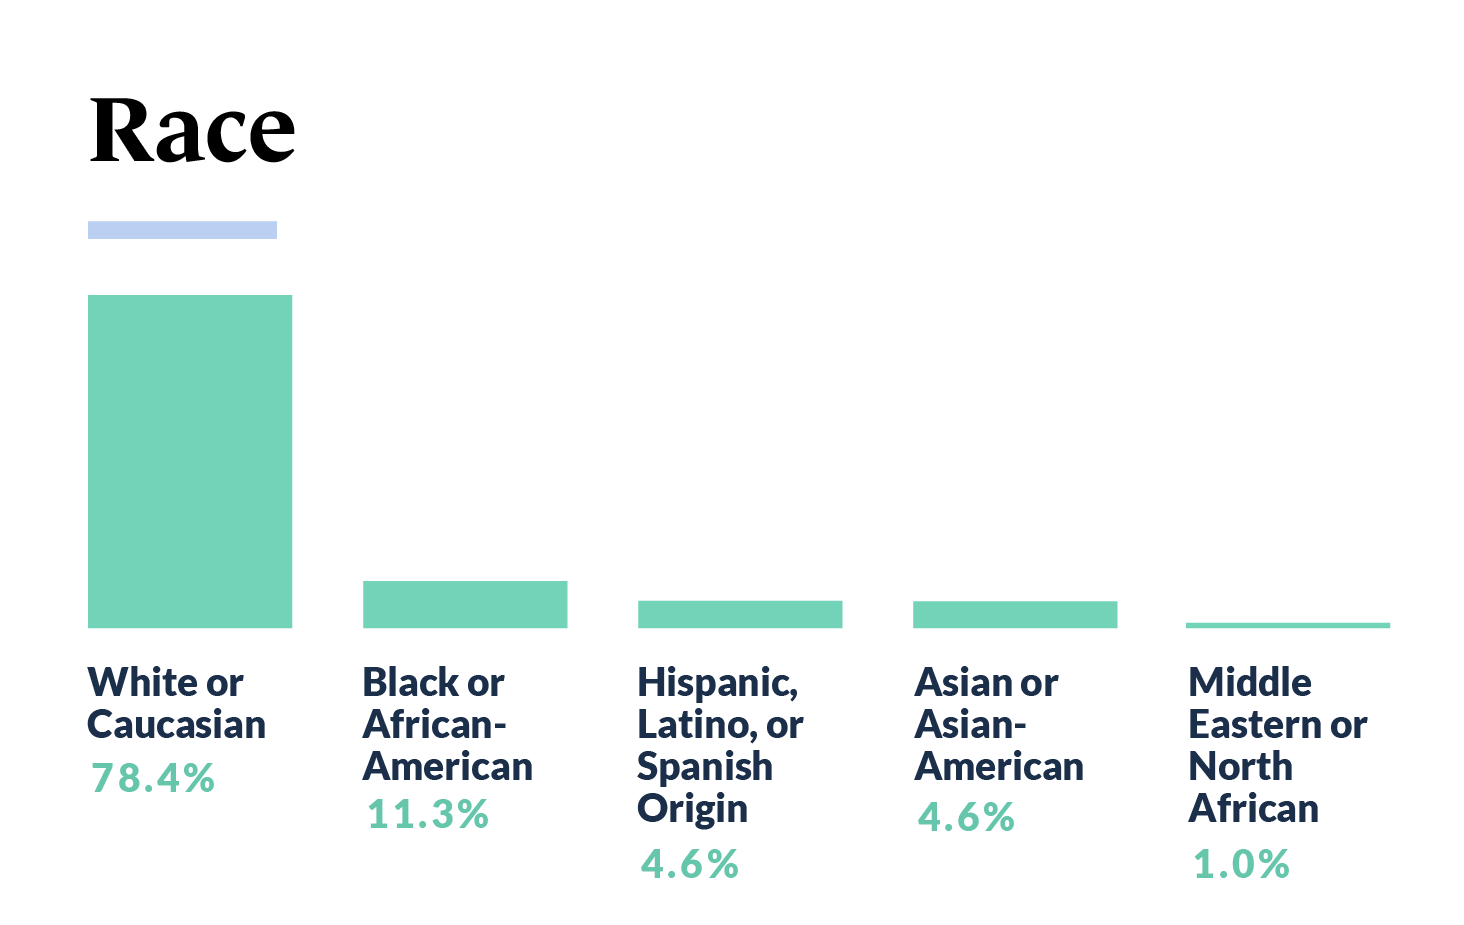
Guidant is committed to increasing success and opportunity for all small business owners, especially those traditionally underserved such as entrepreneurs of color, women in business and other minorities. Through our work at Guidant we hope to foster more diversity within American small businesses in years to come.
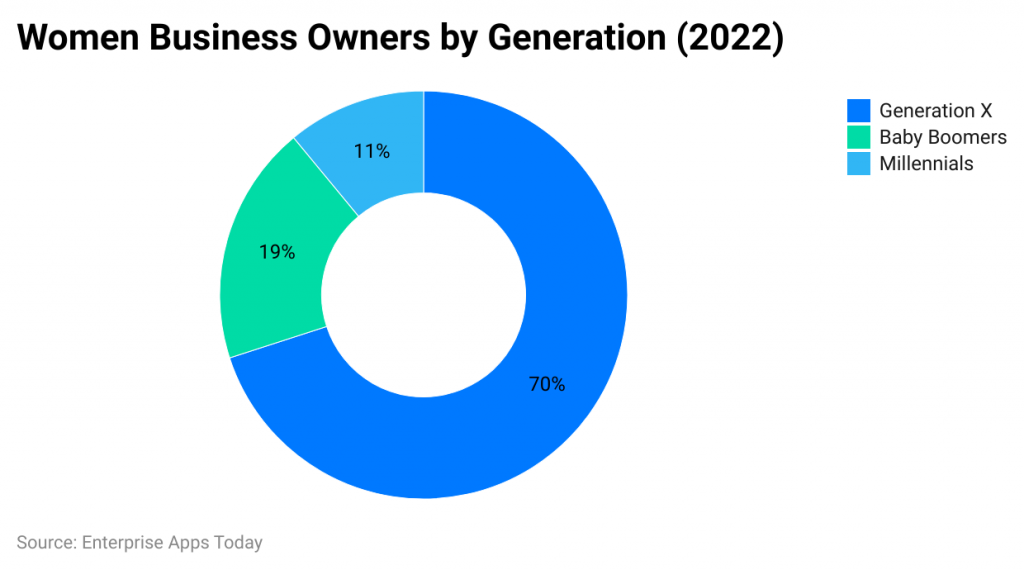
Women Entrepreneur Generation Statistics
- 43% of females have started their business globally.
- 70% belong to Gen X
- 11% Millennials
- 19% are Baby Boomers.
- 13% of businesswomen are linked with the health, fitness, and beauty industries.
- 71% of female entrepreneurs were driven by their passion
Financial Indicators of Women-owned Business in the United States
- 27% increase in average earnings since last year and that turned out $ 57,712.
- 2% increased average revenue by $ 263,091.
- The credit score was 587 which dropped by 1 point since last year.
- The average funded amount received by businesses run by women is $ 55,898.
- Texas, Georgia, Florida, California, and Illinois were the states having the most inquiries about loans.
- The average age of the business remained around 41 months or 3.5 years.
- The average earnings increased by 35% in the manufacturing sector.
United States Having More Employer Firms
- Hawaii = 24.7%
- Virginia = 23.8%
- Colorado = 22.2%
- Florida = 22.1%
- Maryland = 21.8%
- Alaska = 21.6%
- Georgia = 21.1%
- New Mexico = 20.9%
- Nevada = 20.8%
- Oregon = 20.6%
A Total Business Owned by the U.S.
- New businesses on a per-day basis are 1821.
- Minority-owned section gained 89% of new firms.
- Non-minority-owned section gains around 11% of new firms.
Funding Statistics
- 53% = Personal savings
- 44% = paycheck protection program
- 26% = economic injury disaster loans
- 15% = private business loans
- 9% = loans taken from friends and family.
Ethnicity Statistics of Women Entrepreneurs
- 5% are businesswomen and the average age of an American entrepreneur is 44.5 years in 2022.
- White American = 67.1%
- Hispanic or Latino = 15.4%
- Asian = 6.4%
- African or Black American = 6.3%
- Unknown = 4.3%
- Native American = 0.5%
The Age of American Women Entrepreneur’s Business
- More than 20 years old business was 6.14%.
- 16 – 20 years of business was 5.26%.
- 11 – 15 years = 12.28%
- 6 – 10 years = 17.5%
- 0 – 5 years = 49%
States with the Highest Female Entrepreneurs
- Louis = 24.84%
- Denver-Aurora-Lakewood = 24.80%
- Washington-Arlington-Alexandria = 24.62%
- Atlanta-Sandy Springs-Roswell = 23.87%
- Miami-Fort Lauderdale-West Palm Beach = 23.52%
- Tucson = 23.42%
- San Diego-Carlsbad = 23.28%
- Raleigh = 23.23%
- Los Angeles-Long Beach-Anaheim = 23.08%
- Austin-Round Rock = 23%
States with Lowest Female Entrepreneurs
- Salt Lake City = 14.81%
- Wichita = 15.72%
- Cleveland-Elyria = 15.98%
- Provo-Orem = 16.08%
- Madison = 16.11%
- Allentown-Bethlehem-Easton = 16.17%
- Birmingham-Hoover = 16.25%
- Ogden-Clearfield = 16.43%
- Chattanooga = 16.49%
- Lakeland-Winter Haven = 16.57%
Groups that Supported and Promoted Startup for Women
- WomenandMinorityBusiness, org
- SBA
- com
- National Association of Women Business Owners (NAWBO)
- MWBE Enterprises.Inc.
Few Important Statistics
- In the United States, 41.5% are women entrepreneurs and the rest is men oriented.
- Out of 1.25 million women-owned businesses, Texas ranks as the top state in women's entrepreneurship.
- For every $1 that a men entrepreneur makes in business and women make 91 cents on that average.
- 92% of federal small business contract spending goes to women; there will be an increase in their access to hundreds of millions of dollars in procurement possibilities.
- 23.68% of women entrepreneurs were having a business of more than 10 years older
Conclusion
After completing the article on Women Entrepreneurship Statistics it is clear that American women have demonstrated a higher rate of business success. Statistics on women entrepreneurs show that although they continue to face several challenges in obtaining the financing they require for their businesses. But on the other side, Women-owned businesses have shown to be a safer choice for investors. The article includes many informative stats on women business founders in the U.S. in 2022 will provide better guidance ahead.
Sources
FAQ.
There are 252 million women entrepreneurs present in the world and 12.9 million in the United States.
Richest women entrepreneur in U.S. is Diane Hendricks with $ 12.2 billion and in world is Fan Hongwei with $ 18.2 billion.
Finance issues, male dominating society, family commitments, underestimation, less support and etc.

Barry is a lover of everything technology. Figuring out how the software works and creating content to shed more light on the value it offers users is his favorite pastime. When not evaluating apps or programs, he's busy trying out new healthy recipes, doing yoga, meditating, or taking nature walks with his little one.