
Vacation Rental Statistics By Country, Type, Demographics, Region, Season, Factors Influencing and Online Services
Page Contents
- Introduction
- Editor’s Choice
- What is a Vacation Rental?
- General Vacation Rental
- Vacation Rental Statistics By Reasons to Become Rental Host
- Vacation Rental Statistics By Country
- Vacation Rental Statistics By Type
- Vacation Rental Statistics By Numbers
- Vacation Rental Statistics By Demographics
- Vacation Rental Statistics By Reasons To Use Online Services
- Vacation Rental Statistics by Region
- Vacation Rental Statistics by Season
- Vacation Rental Statistics By Factors Influencing Holiday Rentals
- Top 50 World’s Largest Short-term Rental Properties
- Vacation Rental Statistics By Size of Rentals
- Vacation Rental Statistics By Resources for Pre-Trip Planning
- Conclusion
Introduction
Vacation Rental Statistics: Renting a place on vacation is what refreshes our minds. Every year, global tourists focusing on millennials spend around 180 billion dollars on travel every year. Therefore, the market is expected to rise at a CAGR of 5.3% between 2022 to 2030. Today, planning and booking a short or long vacation has become easy, you can simply ask ChatGPT your itinerary for the trip and book on the websites that provide the cheapest price rates for the accommodation.
These Vacation Rental Statistics are including the most recent data focusing on global as well as American holiday rental markets. Don’t you think it's already summertime and you should be booking a vacation to the beach?
Editor’s Choice
- Due to the remote working system, the duration of vacations has been increased by 68% resulting in 21 to 30-day stays.
- As of today, there are 31.3% of privately owned vacation rentals in the United States of America with 600,000 Americans using online platforms to rent out their places.
- As of 2022, around 138 million nights got booked for rental listing in the United States of America.
- From a worldwide perspective, revenue in the vacation rentals market is expected to reach $96.85 billion in 2023.
- The global comparison of Vacation Rental Statistics confirms that in 2023, most of the revenue in the market will be generated from the United States of America.
- Around the world, 700 million travellers used vacation rentals and more than 60 million Americans preferred to stay in holiday rentals in 2022.
- As of 2022, the primary booking method for vacation rentals in the United States of America was online methods (76%), and offline methods (24%).
- The demand for vacation rentals that allow pets have increased by 40%.
- Furthermore, Vacation Rental Statistics of online booking state that the percentage of the same will rise to 80% by 2026.
- 43% of the rental hosts manage their property by themselves whereas 25% of the properties are managed by professionals.
What is a Vacation Rental?
As the word suggests, a vacation rental or holiday rental is a process of renting out a house, place, or furnished apartment for the purpose of travel such as vacation. This term is used in the United States of America, whereas in the United Kingdom Vacation Rental is called Cottage holidays, Holiday lets, or Self-catering rentals.
General Vacation Rental
- As of April 2022, the leading accommodation choice for Americans is 30% to stay with friends and family and only 18% choose a vacation rental.
- As of May 2022, 50% of Americans are worried about gas price hikes whereas only 10% of Americans have no worries about it.
- As of 2022, the property managers in the Vacation rental market are expecting growth in Urban areas by 111%, rural areas (90%), Coastal areas (86%), and Ski Resorts (55%) in the next 12 months.
- The holiday rental listings in the United States of America were expected to increase by 15%.
- 86% of the travellers are planning to book a vacation rental in advance.
- Every year, around 80% of travellers have travel plans included in their new year plans.
- 44% of the families prefer to work remotely while renting a place during vacations.
- Due to the remote working system, the duration of vacations has been increased by 68% resulting in 21 to 30-day stays.
- Around 59% of travellers book their holiday rentals 2 to 5 months in advance.
- The demand for vacation rentals that allow pets have increased by 40%.
- 43% of the rental hosts manage their property by themselves whereas 25% of the properties are managed by professionals.
- Managers of holiday rentals earn $44 for every $1 spent on email marketing.
- 81% of the travellers in Gen Z prefer to stay in cabins, condos, and vacation homes.
- Holiday rentals with an option of flexible cancellation policies are high in demand by 75% of travellers.
- As of 2022, the primary booking method for vacation rentals in the United States of America was online methods (76%), and offline methods (24%).
- Furthermore, Vacation Rental Statistics of online booking state that the percentage of the same will rise to 80% by 2026.
- As of today, there are 31.3% of privately owned vacation rentals in the United States of America with 600,000 Americans using online platforms to rent out their places.
- 29% of American travellers have rated their vacation rentals negative.
- Around the world, 700 million travellers used vacation rentals and more than 60 million Americans preferred to stay in holiday rentals in 2022.
- 80% of the traffic of holiday rentals in the United States of America is brought by Airbnb.
- As of 2022, around 138 million nights got booked for rental listing in the United States of America.
- The revenue of a full-time vacation rental in the United States of America, on average is 56K.
Vacation Rental Statistics By Reasons to Become Rental Host
| Reasons To Become A Vacation Rental Host | Share Of Hosts That Agree |
|---|---|
| Make ends meet | 40% |
| Earn extra spending money | 40% |
| Cover the rising cost of living | 35% |
(Source: passport-photo. online)
- According to the Vacation Rental Statistics, 40% of people become hosts to make ends meet.
- Similarly, 40% of the hosts want to earn extra spending money.
- Whereas, 35% of the hosts cover the rising cost of living by renting their properties.
Vacation Rental Statistics By Country
(Source: 99firms.com)
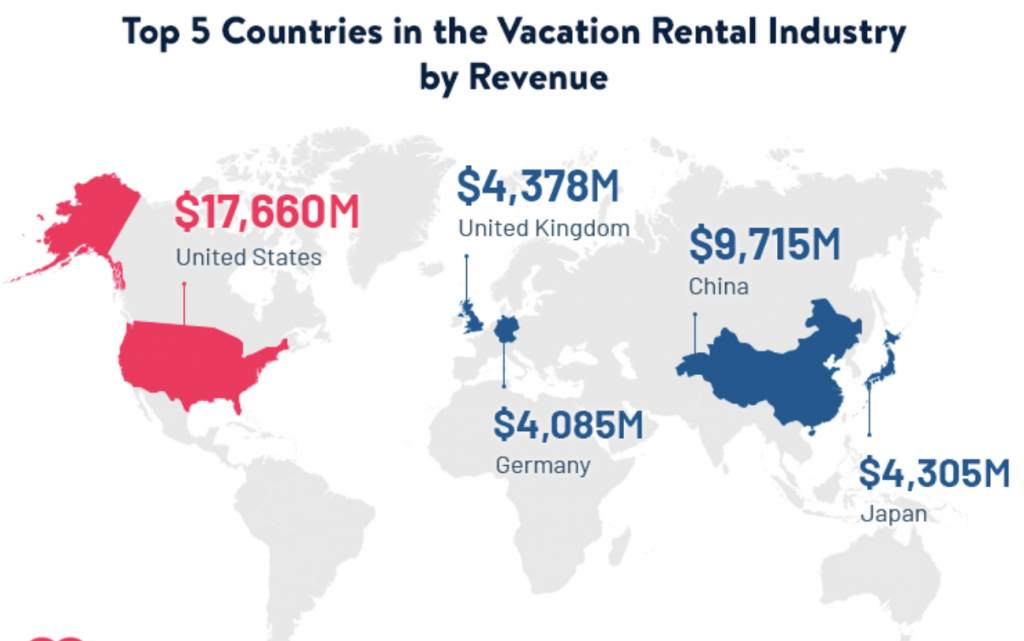
- According to the reports, the United States of America has the largest Vacation Rental Industry by revenue generating around $17,600 million in revenue in 2022.
- Further, it is followed by China and United Kindom for generating revenue of around $9,715 million and $4,378 million respectively.
- Other countries in the top 5 largest vacation rental industry by revenue are Japan and Germany with a revenue of $4,305 million and $4,085 million respectively.
Vacation Rental Statistics By Type
| Type of Vacation Rental | Annual Growth Rate in the US |
|---|---|
| Tiny House | +27% |
| Nature Lodge | +25% |
| Bus | +25% |
| Hut | +18% |
| Dome house | +17% |
(Reference: passport-photo.online)
- The highest increasing annual growth rate for vacation rentals by type is for Tiny House resulting in 27% in the United States of America.
- Nature Lodge and Bus have respectively followed the places by 25% similar increase in the annual growth rate in the US.
- Other two types of holiday rentals with growing rates are Hut (18%) and Dome house (17%).
Vacation Rental Statistics By Numbers
As of 2022, the holiday short-term rental in the United States of America forecasted the following data.
- Available Listing (1,227,218)
- Change in listings (15%)
- Change in demand (14.1%)
- Occupancy rate (59.8%)
- Average daily rate ($249.64)
- Change in average daily rate (-4%)
- RevPAR ($149.41)
- Change in RevPAR (-4.8%)
Vacation Rental Statistics By Demographics
- On average, 50.6% of renters are men while 49.4% of renters are women.
By The Age Of Renters
(Reference: 99firms.com)
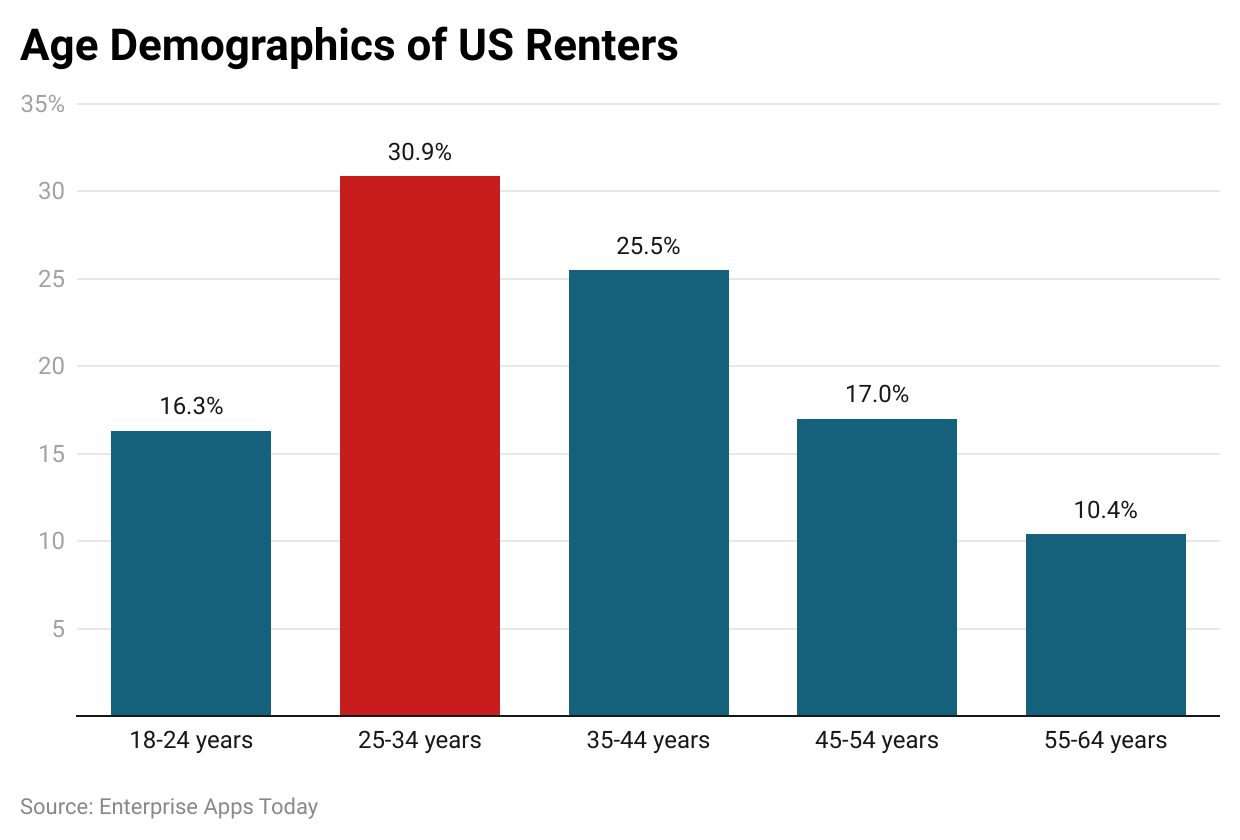
- The highest number of travellers who rent a vacation home belongs to the age group between 25 to 34 years.
- Whereas there are 16.3% and 25.5% travellers from the age group of 18 to 24 years and 35 to 44 years.
- In addition, renters aged between 45 to 54 years and 55 to 64 years contribute around 17% and 10.4% respectively.
Vacation Rental Statistics By Reasons To Use Online Services
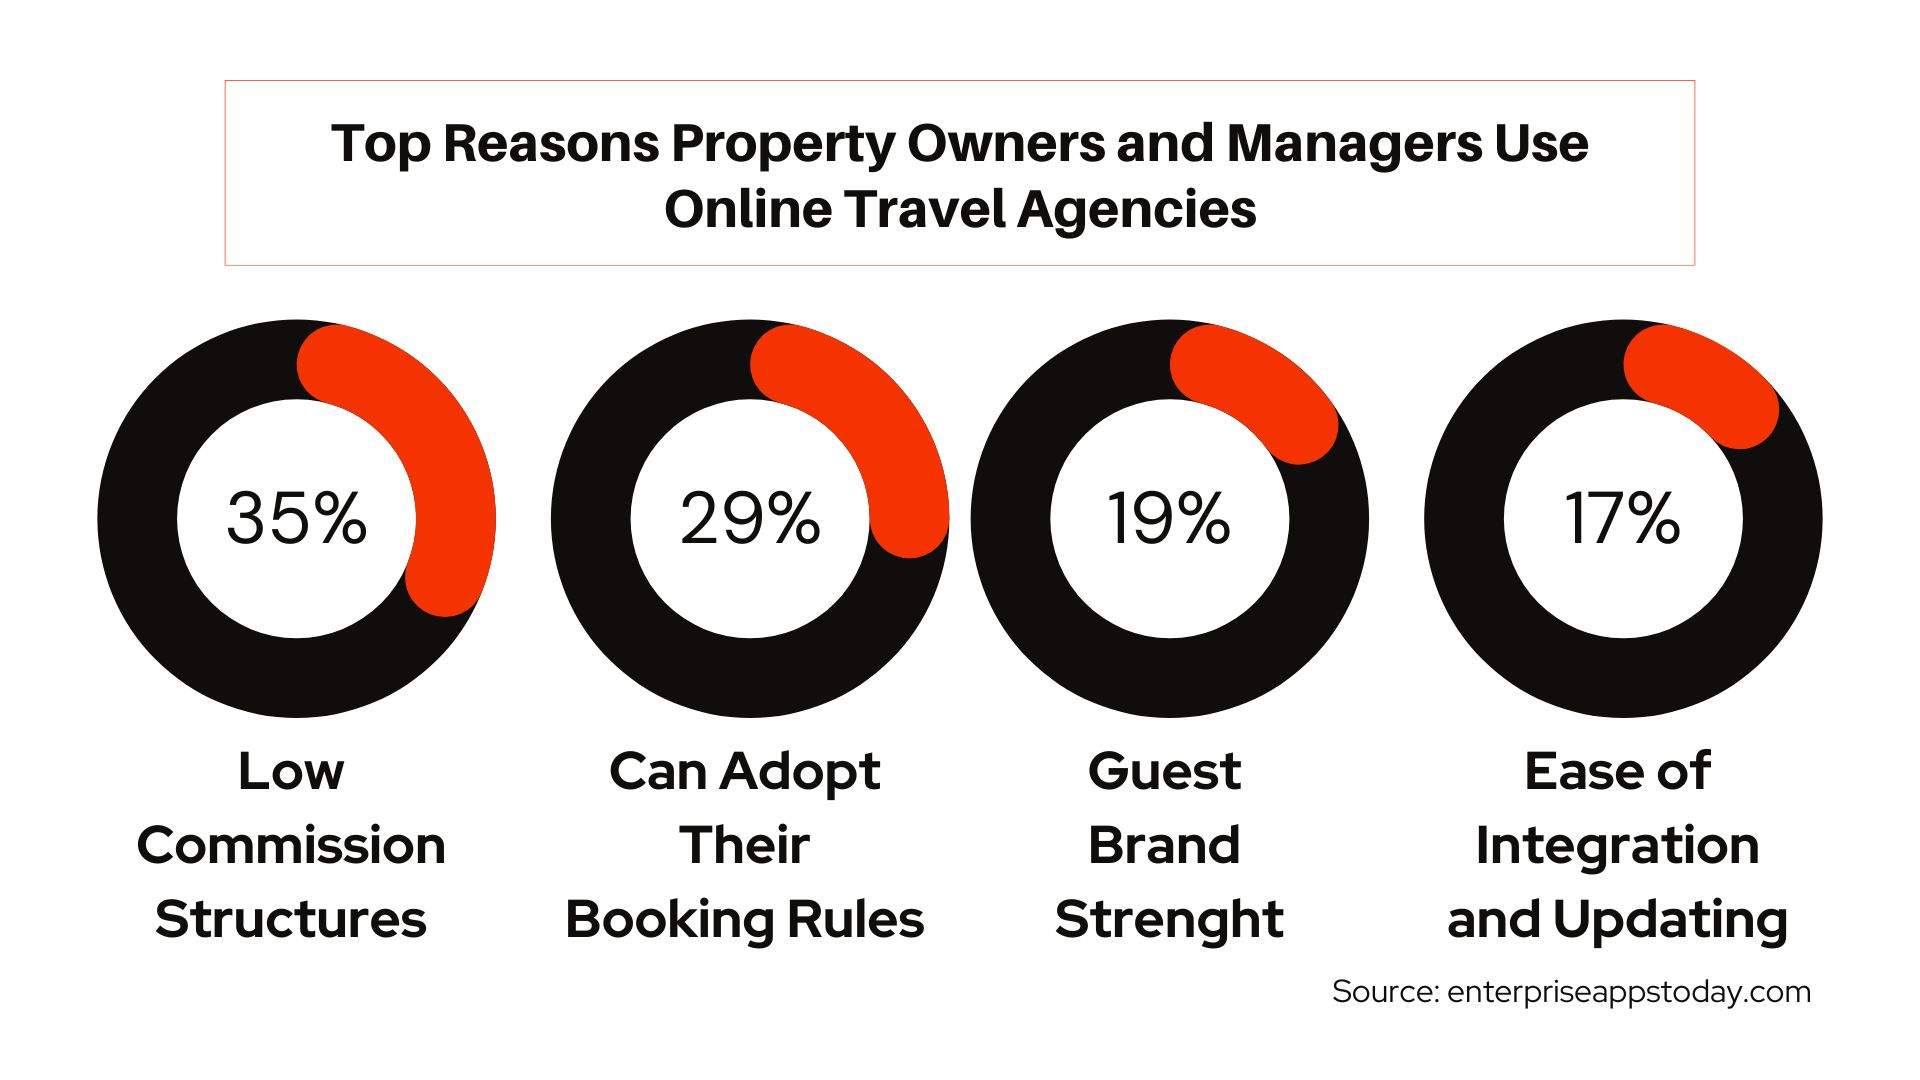
The top reasons why property owners or managers use online travel agencies to advertise their properties are low commission structures (35%), can adopt their booking rules easily (29%), Guest brand strength (19%) and ease of integration and updating (17%).
Vacation Rental Statistics by Region
Worldwide
- From a worldwide perspective, revenue in the Vacation Rentals market is expected to reach $96.85 billion in 2023.
- User penetration is projected to increase at 11.3% by 2027 whereas it is likely to increase by 10.9% in 2023.
- The global comparison of Vacation Rental Statistics confirms that in 2023, most of the revenue in the market will be generated from the United States of America.
- 75% of the total revenue is projected to generate from online sales by 2027.
- Moreover, the revenue is expected to reach $107.70 billion at a CAGR of 2.69% by 2027.
- In 2023, revenue growth in holiday rentals is expected to hit 15.6%.
- In addition, the average revenue per user is projected T $115.50.
- The total number of users in the segment is expected to rise to 0.90 billion by 2027.
Americas
- In 2023, the revenue growth in the American Vacation Rental market is expected to hit 7.3% reaching $28.54 billion.
- By 2027, the total number of users in the market will be 172.40 million.
- Furthermore, 80% of total revenue by 2027 will be generated by online sales.
- It is projected that, by 2027, the user penetration will reach 16.6% whereas in 2023, it will remain similar.
- It is expected that the average revenue per user is $169.50.
- The revenue in the segment is expected to increase by a CAGR of 1.83% reaching $30.69 billion by 2027.
Asia
- The Asian Holiday rentals market is expected to generate revenue of $29.74 billion in 2023 with a growth rate of 26.8% in 2023.
- Moreover, it is predicted that, by 2027, the market volume will reach $35.55 billion with a CAGR of 4.56%.
- The average revenue per user in the Asian segment is $80.96.
- By 2027, the estimates of Vacation Rental Statistics state that 69% of the total revenue will be generated by online sales.
- The total number of users will increase to 399.90 million by 2027, at an 8.6% rate of user penetration whereas it will be 8.1% in 2023.
Africa
- The African holiday rental market states that the revenue generated in 2023 will be $4.13 billion at a growth rate of 27.3%.
- The average revenue per user is expected to reach $42.63 with a user penetration rate of 7.7% in 2023 and 8.3% by 2027.
- Further estimates state that 67% of the total revenue will be generated through online sales.
- The total number of users in the Holiday rentals segment of the Asian market will be 114.20 million by 2027.
Europe
- The European vacation rental market is expected to grow at a CAGR of 1.38% by reaching $34.49 billion by 2027.
- In 2023, the total revenue is expected to reach $32.65 billion at a growth rate of 12.4%.
- The total number of users is expected to increase to 204.30 million by 2027.
- Furthermore, estimates state that 78% of the revenue will come from online sales, whereas in 2023, the user penetration will be 23.3% reaching 24.1% by 2027.
- The average revenue per user in Europe holiday rental market is expected to amount to $164.80.
Vacation Rental Statistics by Season
According to the below chart of Seasons, these were the best times to look for a vacation rental in 2022. Booking one month in advance is always beneficial in terms of lower booking charges and increased discounts as well as coupons.
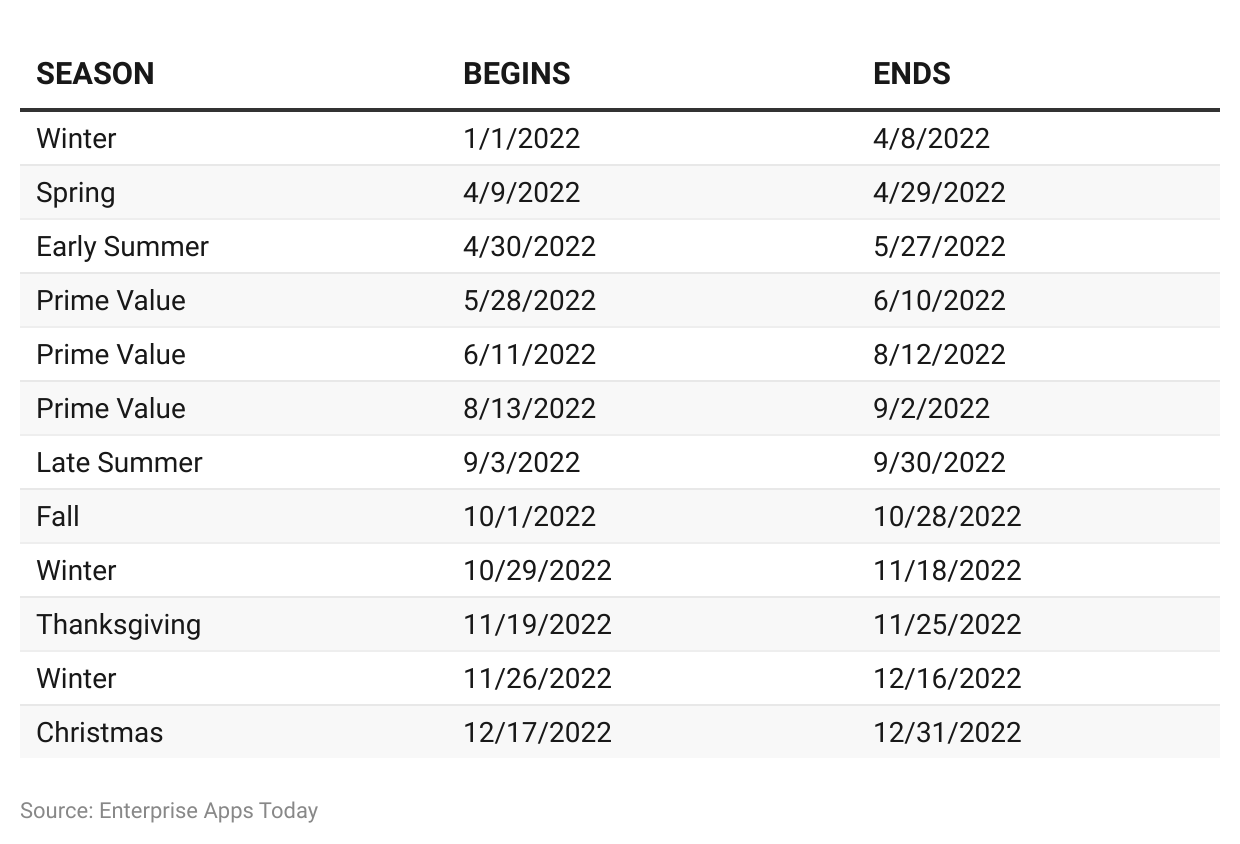
(Reference: proactivevacations.com)
Vacation Rental Statistics By Factors Influencing Holiday Rentals
Following are the factors that influence the booking of holiday rentals in 2023.
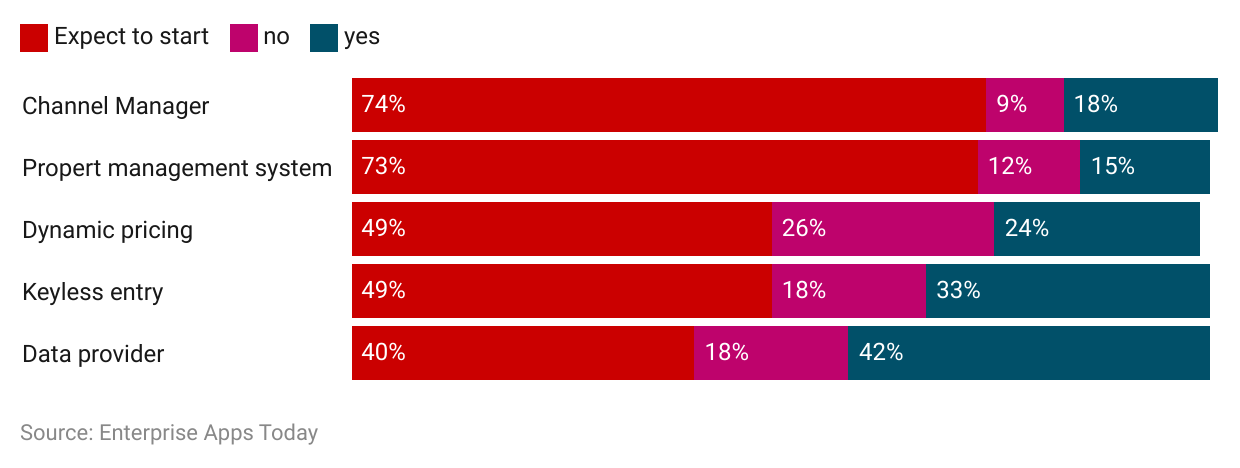
(Reference: rentalsunited.com)
Top 50 World’s Largest Short-term Rental Properties
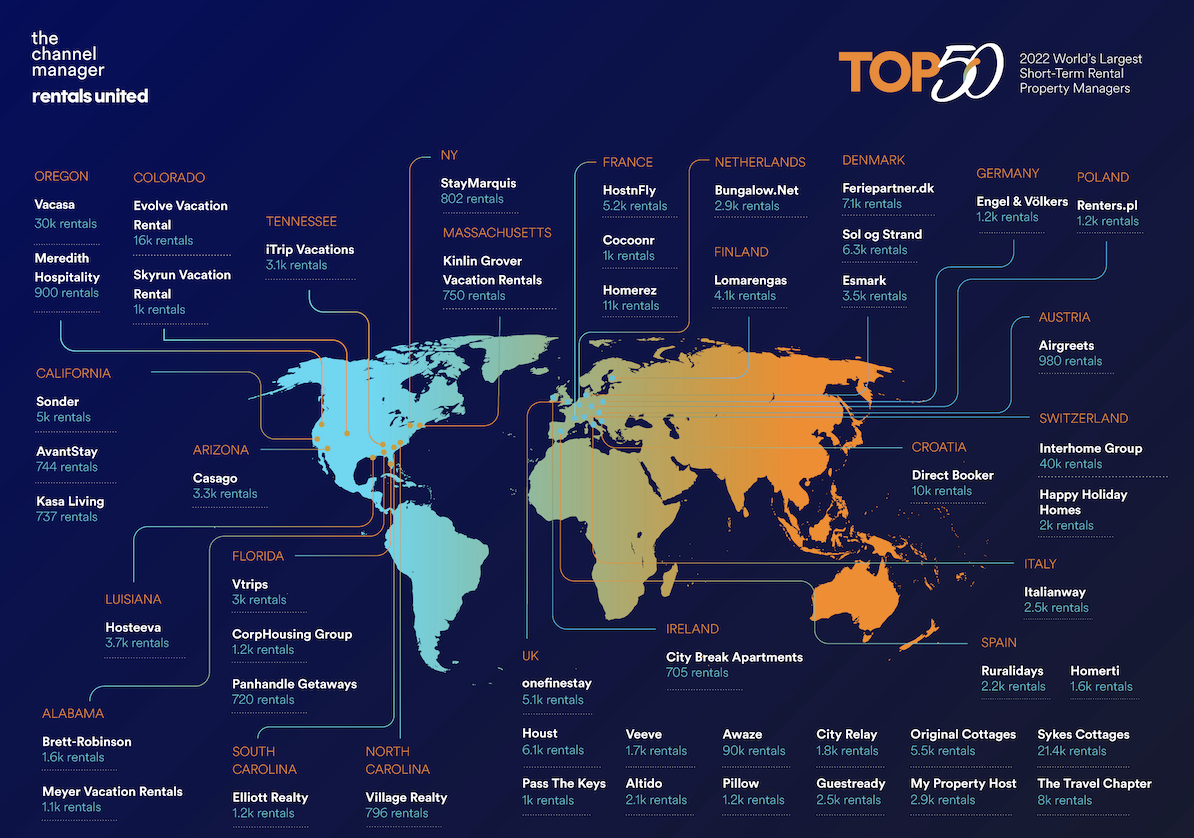
(Source: rentalsunited.com)
Vacation Rental Statistics By Size of Rentals
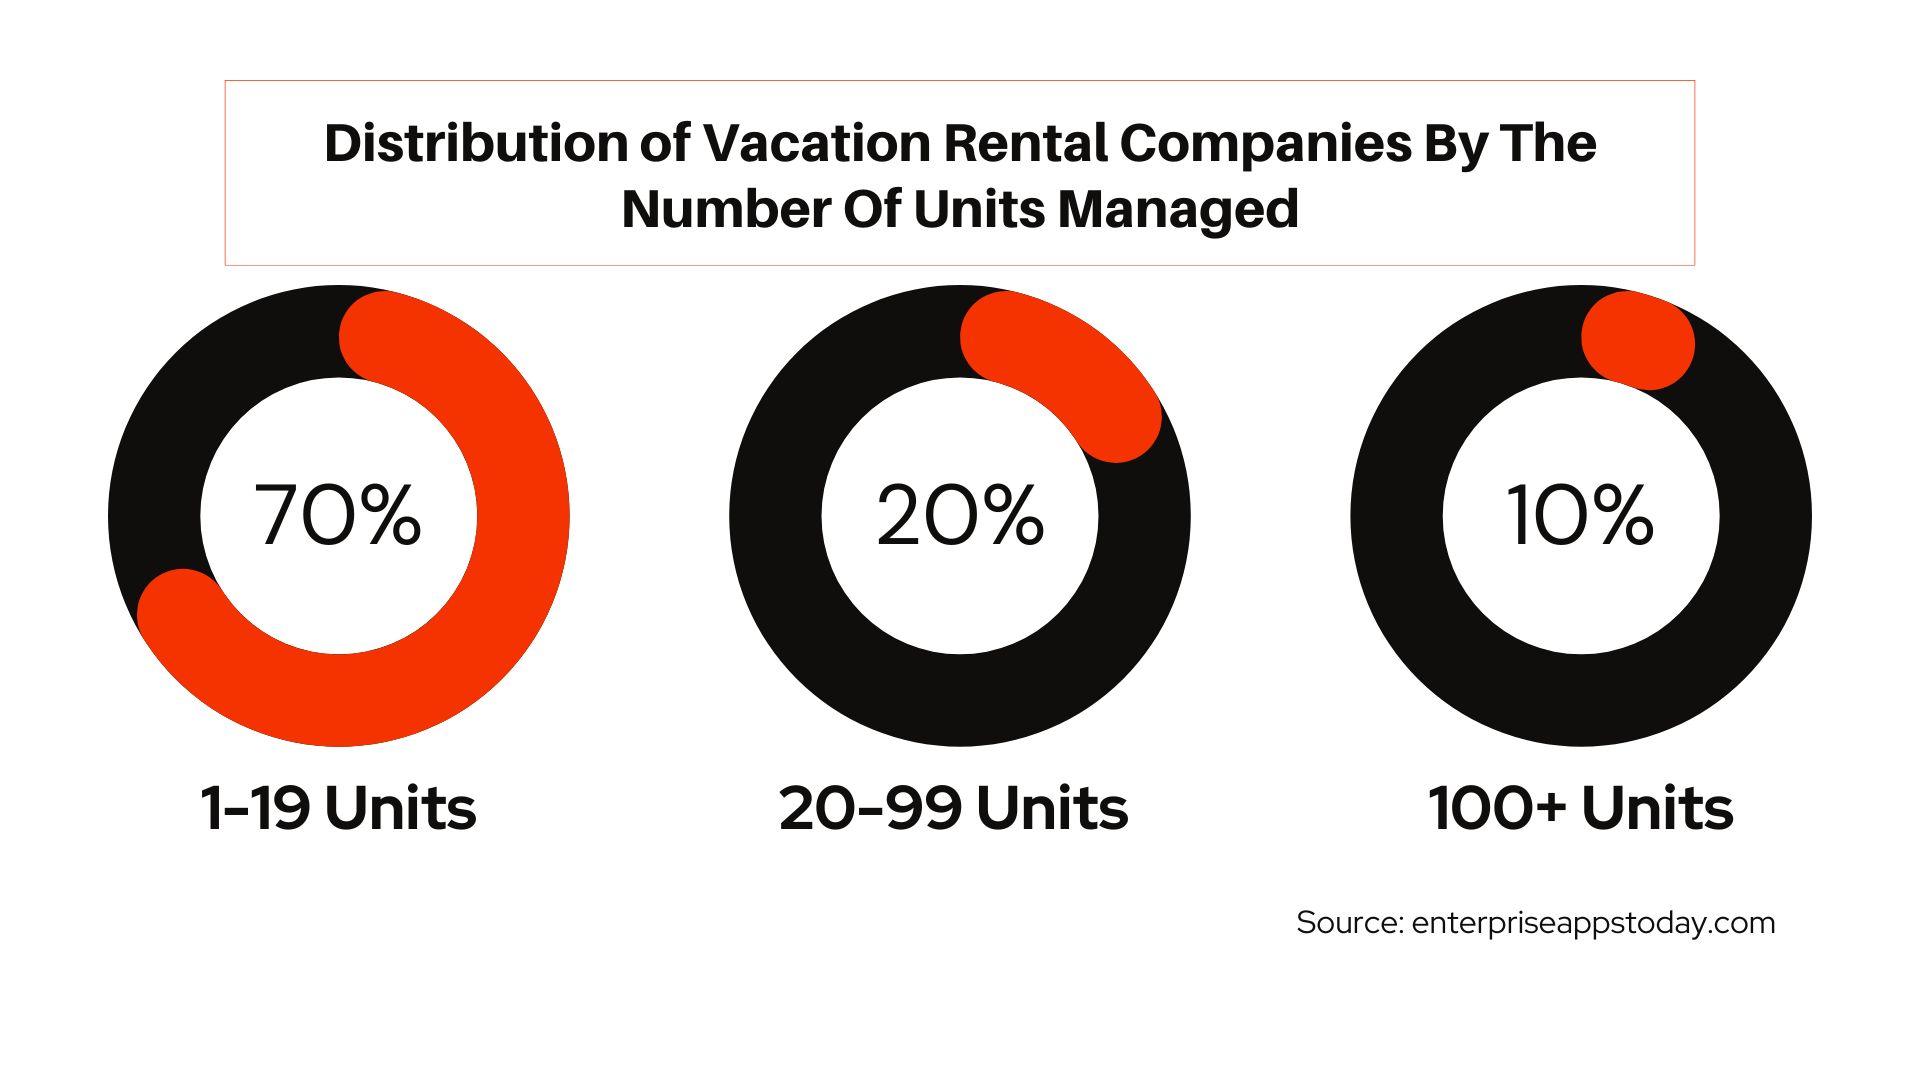
- As of today, there are 70% of the companies that are managing 1 to 19 units.
- Whereas, 20% of companies manage 20 to 99 units.
- And only 10% of Vacation Rental Companies manage more than 100 units at a time.
Vacation Rental Statistics By Resources for Pre-Trip Planning
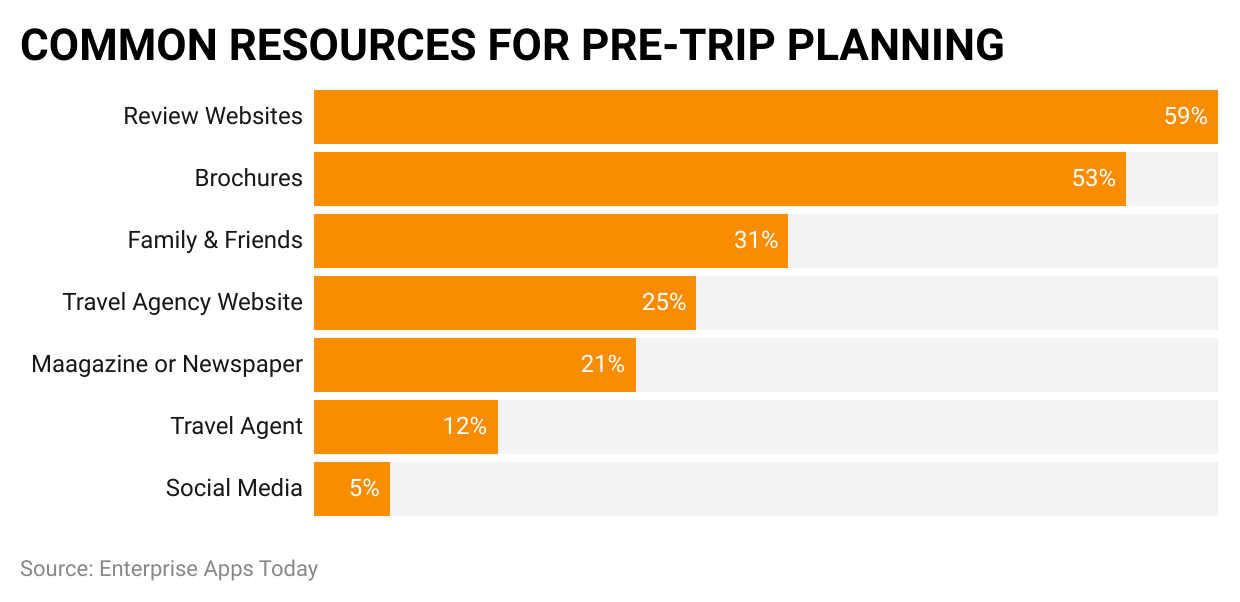
(Reference: ipropertymanagement.com)
Common resources for pre-trip planning according to Vacation Rental Statistics include Review websites (59%), Brochures (53%), Family and Friends (31%), Travel agency websites (25%), Magazines or Newspapers (21%), Travel agent (12%) and Social media (5%).
Conclusion
Considering the lockdown period, the holiday rental industry has a growing future from 2022 and beyond. Travellers from around the world are looking forward to booking their trips every year in advance although the pandemic situation still exists. Moreover, the industry has seen tremendous growth in remote workers in Vacation rentals. In addition to these, holiday rentals that are pet friendly are high in demand. Vacations twice a year are necessary for having mental peace and a great work-life balance for remote workers as well as hybrid workers. Once you are done reading these Vacation Rental Statistics don’t forget to book a month-long vacation with family.
Sources
FAQ.
Following are some of the top players in the global vacation rental market in no particular order.
- Tripadvisor Inc.
- NOVASOL AS
- Expedia Group Inc.
- Airbnb Inc.
- com Pte Ltd.
- Wyndham Destinations Inc.
- Oravel Stays Pvt. Ltd.
- Hotelplan Holding AG.
- Booking Holdings Inc.
- And MakeMyTrip Pvt. Ltd.
Expedia is the world’s largest vacation rental platform in 2023 allowing users to book cruise ships, car rentals, air tickets, accommodations, hotels, motels, villas, guest houses, and much more.
Digital bookings, guest experiences, remote workers, sustainable travel, pet-friendly accommodation, increased privacy, and eco-experiences are some of the driving factors in the vacation rental industry.
You can book the cheapest vacation rentals on Tripadvisor, Airbnb, Expedia, Vrbo, Hometogo, and Booking.com.

Barry is a lover of everything technology. Figuring out how the software works and creating content to shed more light on the value it offers users is his favorite pastime. When not evaluating apps or programs, he's busy trying out new healthy recipes, doing yoga, meditating, or taking nature walks with his little one.