
Google Play Store Statistics 2024 – By Ratings, Demographics, Brand Awareness, Device Traffic, Revenue, Paid App Price Distribution
Page Contents
- Introduction
- Editor’s Choice
- What is Google Play Store?
- Top 10 Mobile App Categories On Play Store
- General Google Play Store Statistics
- Google Play Store Statistics by Paid App Price Distribution
- Google Play Store Statistics by Ratings
- Google Play Store Statistics by Demographics
- Google Play Store Statistics by Brand Awareness
- Google Play Store Statistics by Worldwide Leading Android Apps by Downloads
- Dominating Category of Apps by Revenue in 2022
- Distribution of Free and Paid Apps in October 2023
- Google Play Store Statistics by Device Traffic
- Google Play Store Statistics by Leading Gaming Apps
- Number of Downloads of Selected Video Streaming Mobile Apps
- Mobile App Downloads by Store from 2021 to 2026
- Conclusion
Introduction
Google Play is an online store where millions of applications are available in various categories. All of the applications are providing the service digitally. Just like we go to physical stores and buy everything under one roof, Google Play offers its services under one roof. The two main stores i.e. App Store on iOS and Play Store on Android are the major players in the digital market, without which no app can be officially downloaded on smartphones. Today, from learning ABCD to building and decorating a house games are available on these apps. Let’s see what Google Play Store Statistics are showing about its
usage around the globe.
Editor’s Choice
- In 2022, this platform generated an overall 110 billion app downloads which is more than the iOS app store.
- In March 2023, around 2,136,954 applications were without any rating. However, only 126,953 apps had a 4.5 and above rating.
- As of October 2023, Google Play Statistics showed that this platform had 96.95% of free apps whereas 94.95% were available on iOS. However, iOS had 5.05% and 3.05% paid apps.
- In Q4 of 2022, Google Play generated 27.5 billion global app downloads whereas it was only 8.1 billion on the app store.
- According to the Google Play Store Statistics of October 2023, the highest number of apps are priced at less than $1, resulting in 38,039.
- As of November 2023, play.google.com generated a global 2.29 billion traffic, which was 2.41 billion in October. This has shown a negative rate of visitors resulting in 4.79%.
- Overall, various apps on the Google Play Store have received more than 32.7 billion ratings.
- In 2022, around 3,739 applications were added to the platform every day.
- As of 2022, around 85% of Americans were aware of the platform. However, only 20% of them were using it but there were 15% of users regular with the platform. Furthermore, in 23% of the users the brand was popular.
- Overall mobile traffic contributed by the top countries is 95.01% (2 billion) while only 4.99% belonged to desktops (1 million).
What is Google Play Store?
Google Play store is a digital store with various apps available to download on smartphones. These apps are either paid or free. This platform is only compatible with Android operating system-enabled devices. The initial release was made in 2008 by the developer, Google. Play Store can be accessed on Wear OS, ChromeOS, Web, Android TV, and Android. These apps are generally developed with Android Software development kit (SDK).
Following are some details about the total categories available on the Google Play Store.
Total Categories of Apps on Play Store
| Category | Number of Apps | Apps with above 50K downloads | Paid apps | Average price |
| Education | 263,682 | 19603 (7%) | 13551 (5%) | $ 6.47 |
| Business | 171,540 | 6242 (4%) | 1679 (1%) | $ 13.78 |
| Music & Audio | 161,682 | 11425 (7%) | 2882 (2%) | $ 5.46 |
| Tools | 153,516 | 21892 (14%) | 7770 (5%) | $ 7.74 |
| Entertainment | 142,491 | 20102 (14%) | 3978 (3%) | $ 6.12 |
| Lifestyle | 122,461 | 11026 (9%) | 2528 (2%) | $ 7.31 |
| Books & References | 120,305 | 11026 (9%) | 8010 (7%) | $ 5.97 |
| Food & Drinks | 113,451 | 3189 (3%) | 660 (1%) | $ 13.67 |
| Shopping | 107,987 | 7125 (7%) | 283 (0%) | $ 13.80 |
| Personalization | 104,150 | 13195 (13%) | 16367 (16%) | $ 1.90 |
| Productivity | 100,813 | 7429 (7%) | 3794 (4%) | $ 9.66 |
| Health & Fitness | 91350 | 6319 (7%) | 2480 (3%) | $ 6.81 |
| Finance | 83364 | 11836 (14%) | 1544 (2%) | $ 8.84 |
| Travel & Local | 70204 | 4847 (7%) | 2490 (4%) | $ 3.76 |
| Casual | 61568 | 9641 (16%) | 1672 (3%) | $ 8.32 |
| Puzzle | 60144 | 8039 (13%) | 3020 (5%) | $ 6.35 |
| Arcade | 59022 | 5462 (9%) | 1991 (3%) | $ 8.34 |
| Communication | 58212 | 5133 (9%) | 1141 (2%) | $ 7.45 |
| Social | 50143 | 5003 (10%) | 481 (1%) | $ 8.67 |
| Sports | 47809 | 3641 (8%) | 2412 (5%) | $ 19.67 |
| News & Magazines | 44775 | 3965 (9%) | 225 (1%) | $ 4.50 |
| Medical | 41326 | 2731 (7%) | 2446 (6%) | $ 11.52 |
| Photography | 35597 | 7395 (21%) | 1063 (3%) | $ 6.57 |
| Maps & Navigation | 33337 | 3400 (10%) | 1479 (4%) | $ 5.90 |
| Action | 32386 | 6738 (21%) | 1261 (4%) | $ 4.27 |
| Simulation | 28272 | 10456 (37%) | 1060 (4%) | $ 5.08 |
| Auto & Vehicles | 27444 | 1994 (7%) | 674 (2%) | $ 8.47 |
| Adventure | 25041 | 4845 (19%) | 1762 (7%) | $ 5.70 |
| Educational | 24745 | 3682 (15%) | 2504 (10%) | $ 3.38 |
| Art & Design | 20209 | 2064 (10%) | 737 (4%) | $ 4.74 |
| Beauty | 18857 | 866 (5%) | 81 (0%) | $ 6.61 |
| Events | 18853 | 320 (2%) | 68 (0%) | $ 12.59 |
| House & Home | 18738 | 984 (5%) | 195 (1%) | $ 5.33 |
| Trivia | 14967 | 1756 (12%) | 365 (2%) | $ 6.10 |
| Video Player & Editors | 14118 | 3620 (26%) | 581 (4%) | $ 7.92 |
| Role Playing | 13734 | 5406 (39%) | 995 (7%) | $ 5.08 |
| Board | 11815 | 2446 (21%) | 720 (6%) | $ 4.63 |
| Strategy | 11801 | 3299 (28%) | 814 (7%) | $ 6.96 |
| Racing | 11770 | 3452 (29%) | 333 (3%) | $ 6.60 |
| Word | 11757 | 1915 (16%) | 393 (3%) | $ 5.25 |
| Card | 9785 | 2830 (29%) | 532 (5%) | $ 3.54 |
| Sports Games | 8613 | 2406 (28%) | 418 (5%) | $ 4.78 |
| Weathers | 8581 | 2628 (31%) | 336 (4%) | $ 6.01 |
| Dating | 7116 | 1218 (17%) | 60 (1%) | $ 13.27 |
| Casino | 6751 | 1861 (28%) | 341 (5%) | $ 8.62 |
| Music | 6144 | 1339 (22%) | 194 (3%) | $ 5.85 |
| Libraries & Demo | 5686 | 394 (7%) | 134 (2%) | $ 10.07 |
| Parenting | 5022 | 699 (14%) | 207 (4%) | $ 6.09 |
| Comics | 2944 | 699 (24%) | 184 (6%) | $ 4.42 |
(Source: emizentech.com)
Top 10 Mobile App Categories On Play Store
| Rank | Category | Total number of apps | Number of Paid Apps | Number of Free Apps |
| 1. | Education | 263,682 | 13,551 | 250,131 |
| 2. | Business | 171,540 | 1,679 | 169,861 |
| 3. | Music & Audio | 161,682 | 2,882 | 158,800 |
| 4. | Tools | 153,516 | 7,770 | 145,746 |
| 5. | Entertainment | 142,491 | 3,978 | 138,513 |
| 6. | Lifestyle | 122,461 | 2,528 | 119,933 |
| 7. | Books & References | 120,305 | 8,010 | 112,295 |
| 8. | Food & Drinks | 113,451 | 660 | 112,791 |
| 9. | Shopping | 107,987 | 283 | 107,704 |
| 10. | Personalization | 104,150 | 16,367 | 87,783 |
(Source: emizentech.com)
General Google Play Store Statistics
- As of June 2023, the total number of available applications on the Google Play Store including paid and free was 2,597,819, however, since March it has experienced a slight decline in the total number of apps that were 2,673,292.
- As of November 2023, play.google.com generated a global 2.29 billion traffic, which was 2.41 billion in October. This has shown a negative rate of visitors resulting in 4.79%.
- Google Play Store Statistics state that, in 2022, around 3,739 applications were added to the platform every day.
- In 2022, this platform generated an overall 110 billion app downloads which is more than the iOS app store.
- Furthermore, in Q4 of 2022, Google Play generated 27.5 billion global app downloads whereas it was only 8.1 billion on the app store.
- Overall, various apps on the Google Play Store have received more than 32.7 billion
ratings. - Google Play Store is available in more than 190 countries.
- In 2022, more than 140 billion downloads were generated on the platform considering all of the categories.
- Every month on average, above 2.5 billion users are active regularly on the platform.
- The platform has more than 2 million apps and games that generate an overall $120 billion in earnings for developers.
- In 2022, the total number of apps released through the Google Play Store increased by 28%.
- Furthermore, in February 2023, on the platform around 2,796 apps per day were released, thus considering this rate, in a single month around 12,987 apps were published.
- In 2023, Google Play Store experienced more user spending on apps resulting in $96 billion as compared to App Store $60 billion.
- On average in the last 5 years, the user spending on Google Play is more as compared to iOS’s App Store.
- As of March 2022, 97% of apps in all categories were available to download for free.
- According to reports, the majority of the Google Play players are male resulting in 51% while 49% are female players.
- As of today, the platform has removed more than 7,00,000 obsolete apps.
- According to Google Play Store Statistics, in Q3 of 2022, around 490 thousand gaming apps were available on the platform.
- As of 2023, there are 1,149 million publishers considering all categories on the platform.
- As of 2023, out of the total available apps on Google Play, 87.12% are other categories and 12.88% are games, resulting in 3,099,626 and 458,261 respectively.
- As of December 2023, the top 5 upward trending app categories on the platform by increase are News and magazines (79.46%), Weather (11.1%), Dating (8.19%), Parenting (3.28%) and Shopping (2.64%).
- On the other hand, in a similar period, the top 5 most downward trending categories are Art and design (-13.71%), Communication (-13.86%), Business (-19.07), Libraries and demo (-35.02%), and Comics (-63.12%).
- In 2022, Candy Crush Saga became the most downloaded game on Google Play.
- Furthermore, as of September 2022, Google LLC became the top non-gaming app publisher by downloads in the United States of America.
- In Q2 of 2022, this platform published 75,000 business apps.
- In 2023, the conversion rate for the platform in terms of mobile app downloads was 31.3% in the United States of America.
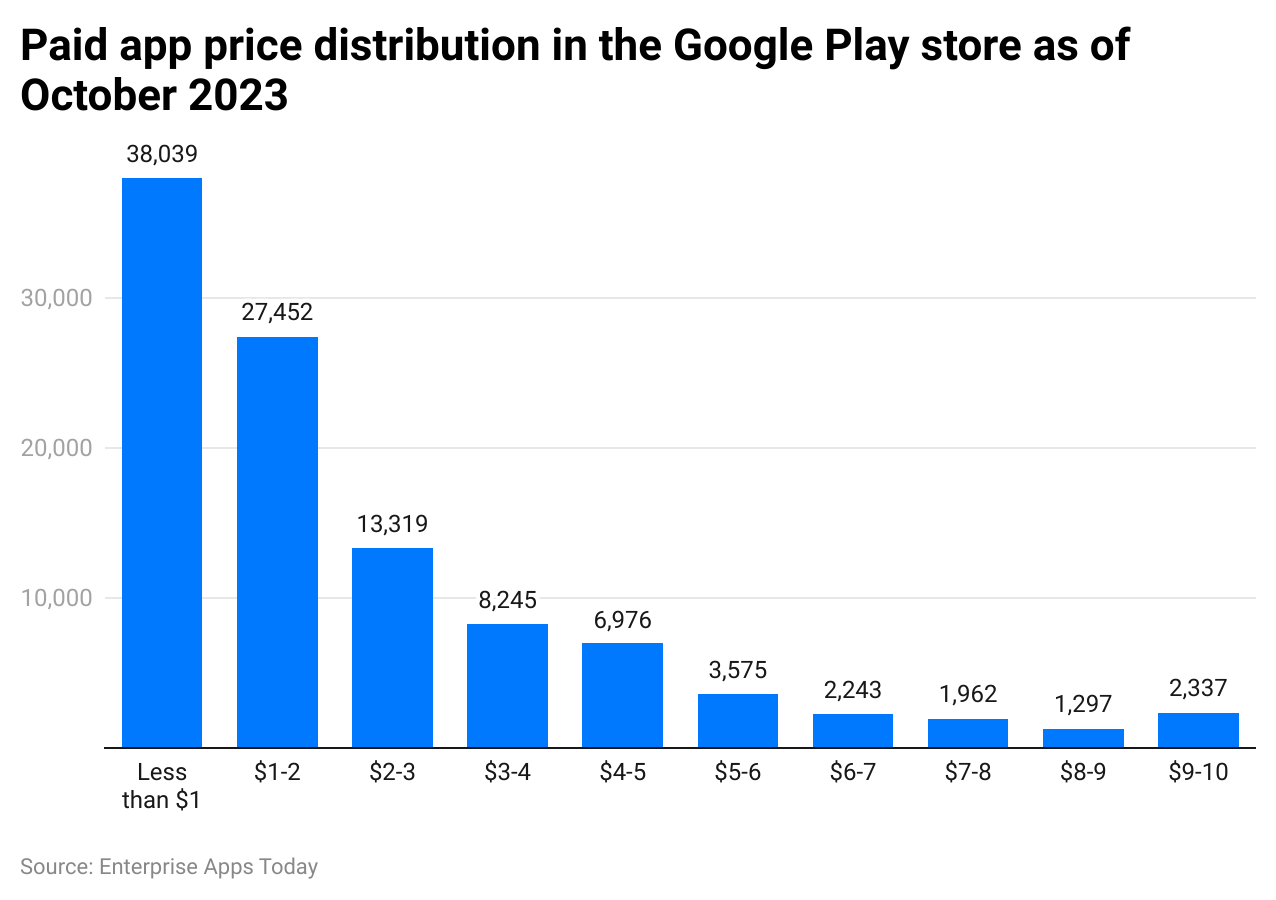
Google Play Store Statistics by Paid App Price Distribution
(Reference: statista.com)
According to the Google Play Store Statistics of October 2023, the highest number of apps are priced at less than $1, resulting in 38,039. The priciest apps are valued between $9 to $10, and the total number of available apps is 2,337. There are around 40,771 paid apps on the platforms priced between $1 to $3.
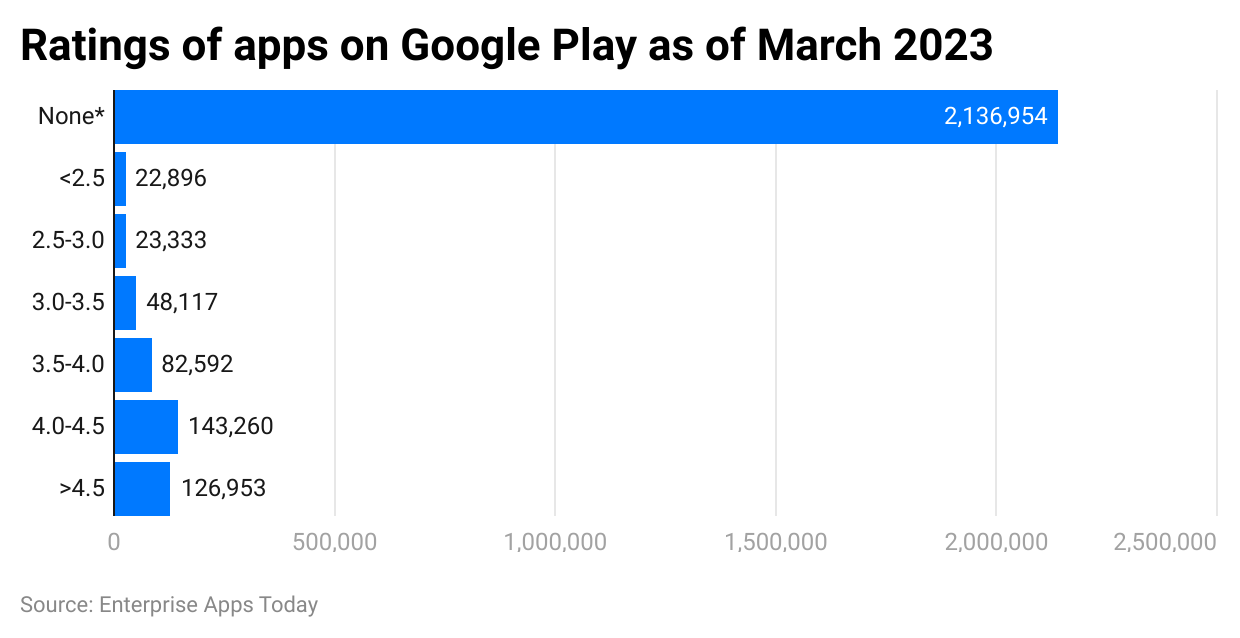
Google Play Store Statistics by Ratings
(Reference: statista.com)
In March 2023, around 2,136,954 applications were without any rating. However, only 126,953 apps had a 4.5 and above rating. 48,117 apps received average ratings between 3 to 3.5 stars.
Google Play Store Statistics by Demographics
The following data interprets the app use case by different age groups around the globe:
| Age Group | Monthly Hours Spent On Apps |
| 18-24 | 112.6 |
| 25-34 | 102.4 |
| 35-44 | 93.6 |
| 45-54 | 75.6 |
| 55-64 | 69.3 |
| 65+ | 51.4 |
(Source: emizentech.com)
According to reports, users aged between 18 to 24 years spend around 112.6 hours per month on apps compared to users in other age groups. Users aged 25 to 34 years spend around 102.4 hours every month. However, the lowest amount of time spent on this platform is observed by users aged 65 years and above.
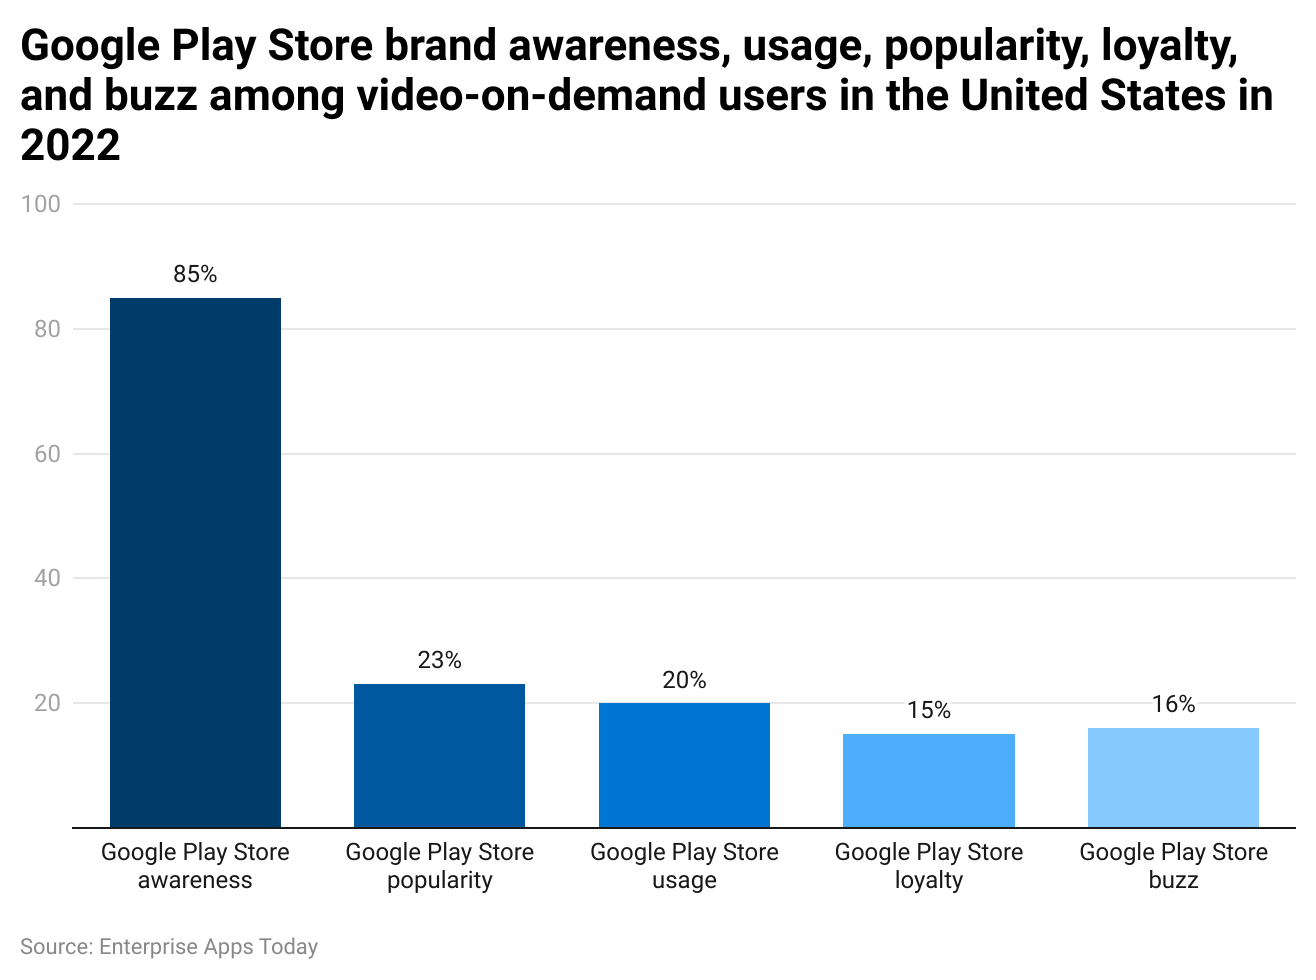
Google Play Store Statistics by Brand Awareness
(Reference: statista.com)
As of 2022, around 85% of Americans were aware of the platform. However, only 20% of them were using it but there were 15% of users regular with the platform. Furthermore, in 23% of the users the brand was popular.
Google Play Store Statistics by Worldwide Leading Android Apps by Downloads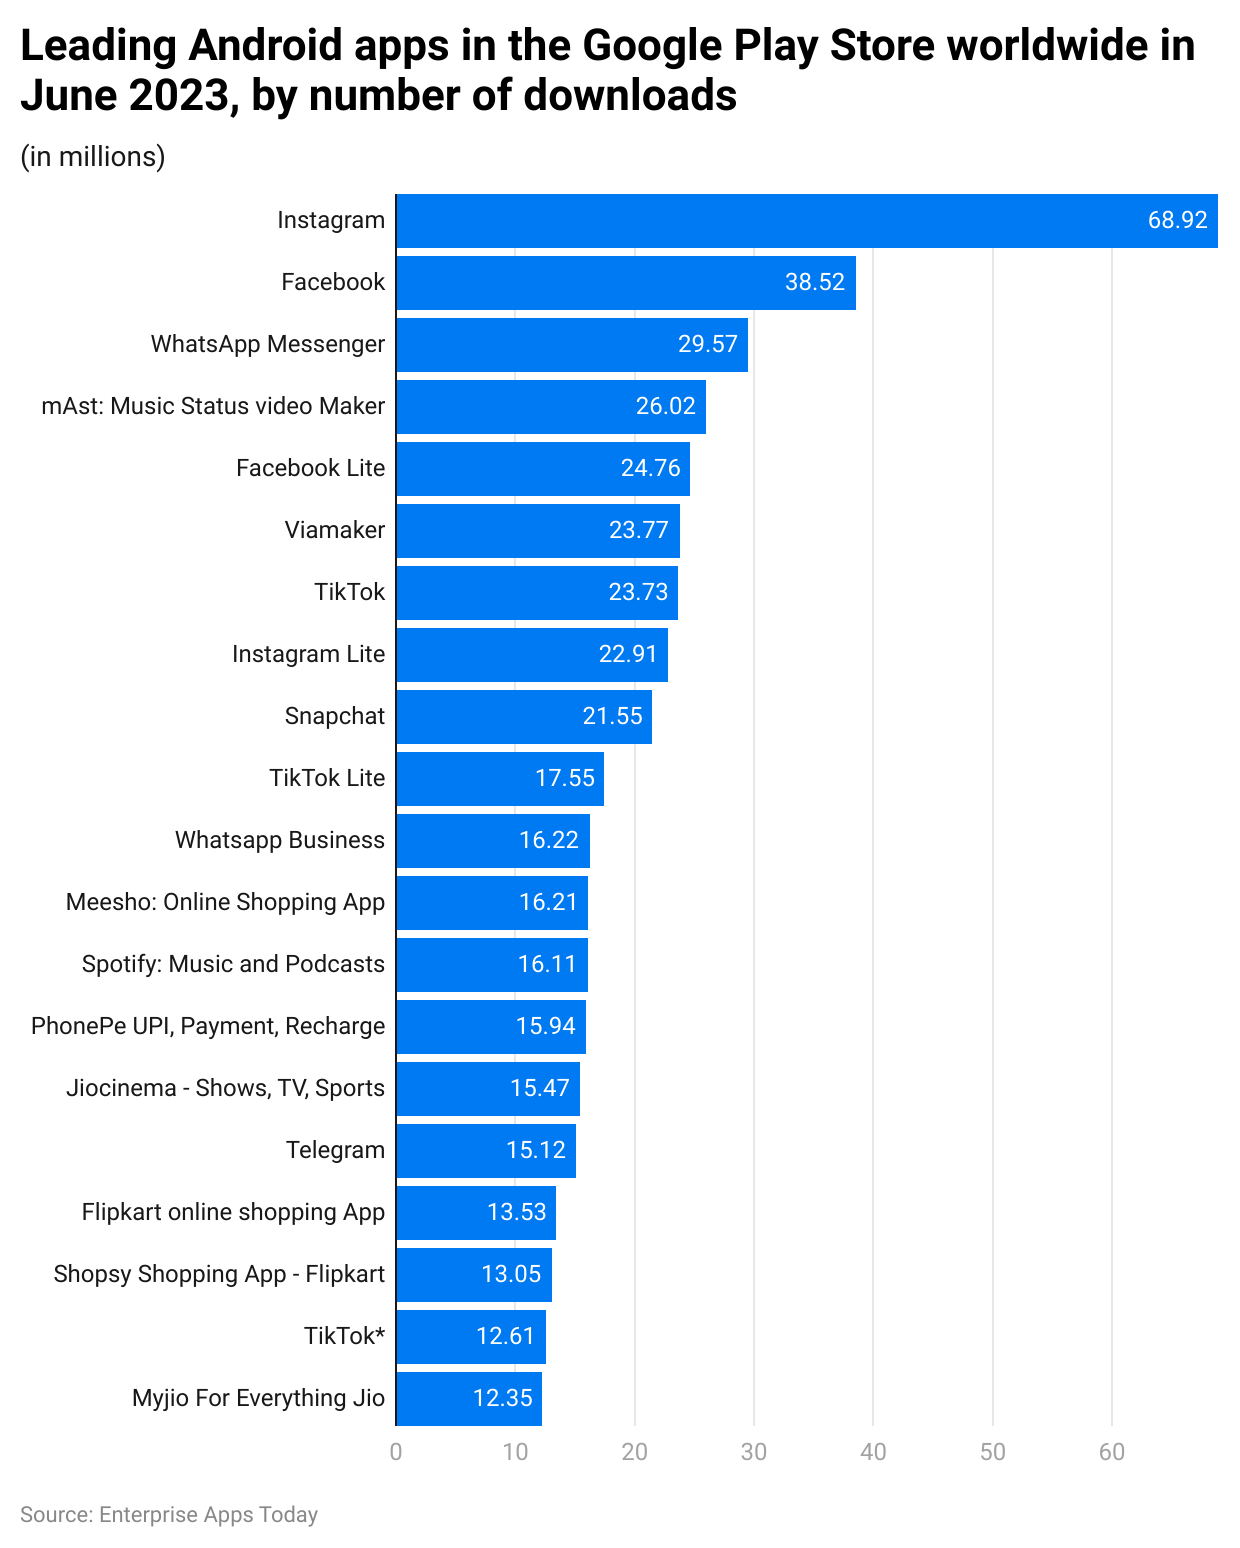
(Reference: statista.com)
As of June 2023, the top 3 most downloaded apps around the world were Instagram, Facebook, and WhatsApp Messenger resulting in 68.92%, 38.52%, and 29.57% respectively. In addition, in the list, there were lite versions of these apps with the highest downloads. Other categories by most downloads included OTT platforms, music, and shopping.
Dominating Category of Apps by Revenue in 2022
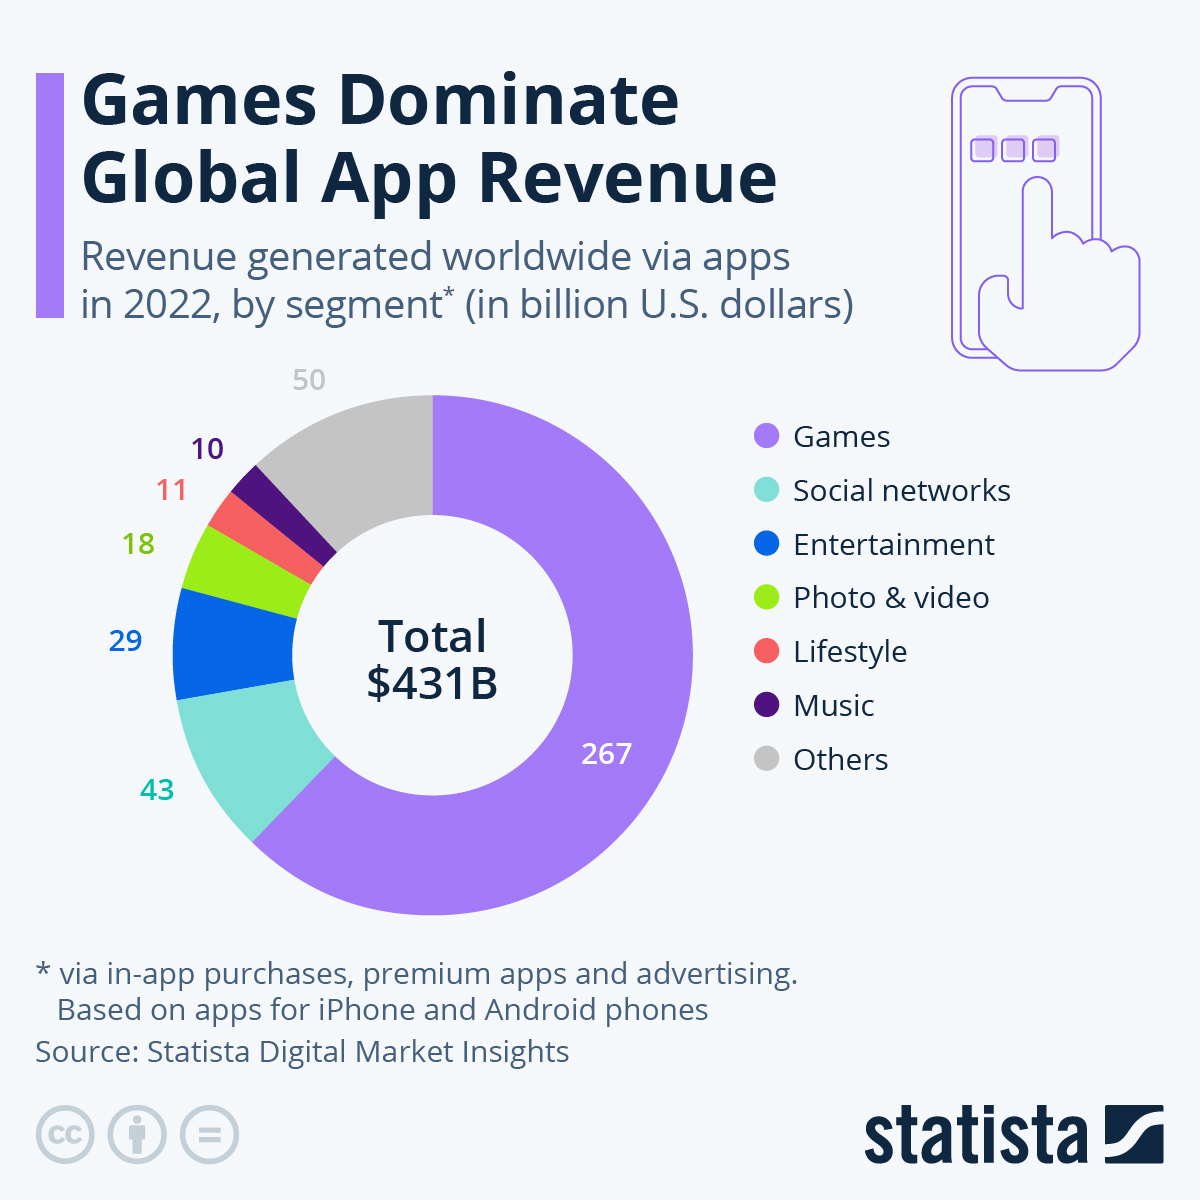
(Source: statista.com)
As of 2022, the game segment was the dominating category in iOS and Android platforms resulting in $267 billion of revenue, followed by social media networks ($43 billion), and entertainment ($29 billion). However, considering the popularity of daily music lovers and listeners this category generated only $10 billion.
Distribution of Free and Paid Apps in October 2023
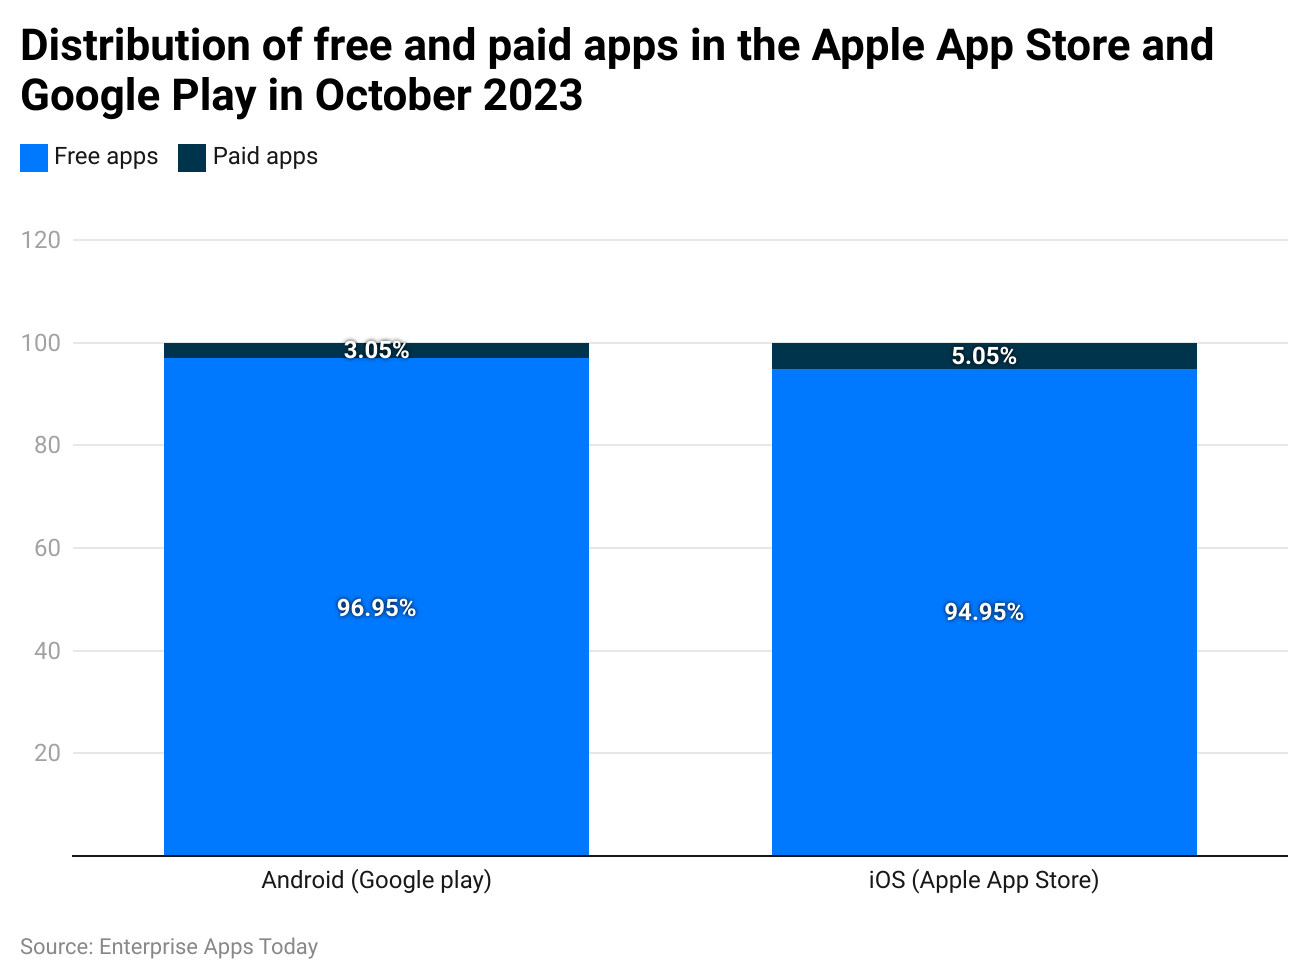
(Reference: statista.com)
As of October 2023, Google Play Statistics showed that this platform had 96.95% of free apps whereas 94.95% were available on iOS. However, iOS had 5.05% and 3.05% paid apps.
Google Play Store Statistics by Device Traffic
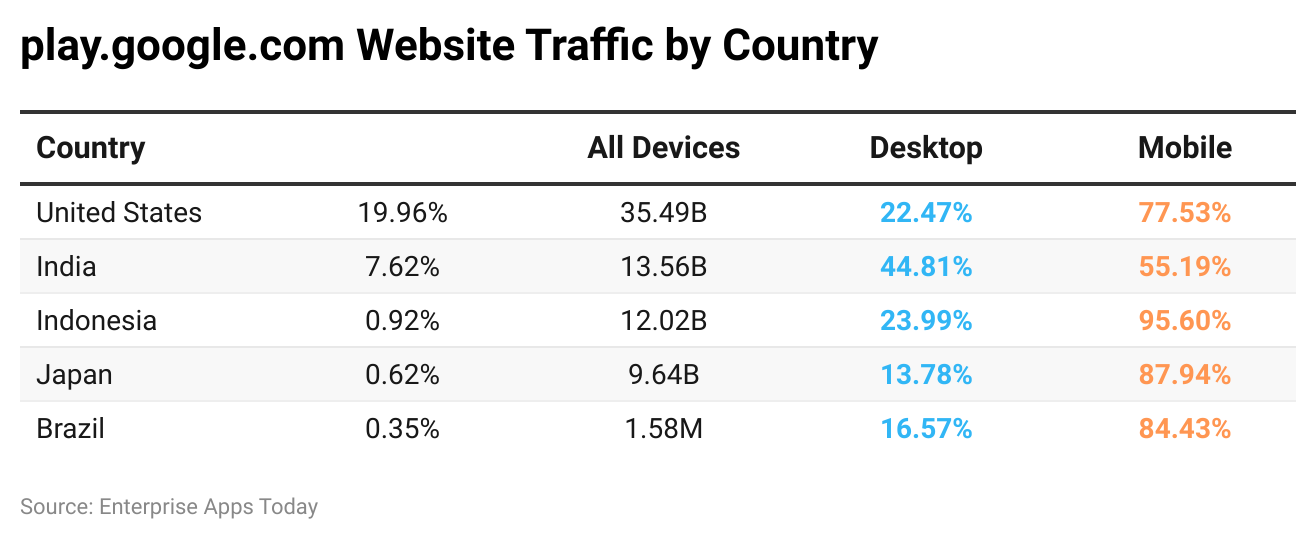
(Reference: semrush.com)
Over the last 6 months of 2023, the top 5 countries with the highest mobile device traffic on Google Play Store are the United States of America, India, Indonesia, Japan, and Brazil. Each of these countries contributed with highest number of mobile traffic. Overall mobile traffic contributed by these countries is 95.01% (2 billion) while only 4.99% belonged to desktops (1 million).
Google Play Store Statistics by Leading Gaming Apps
(Reference: statista.com)
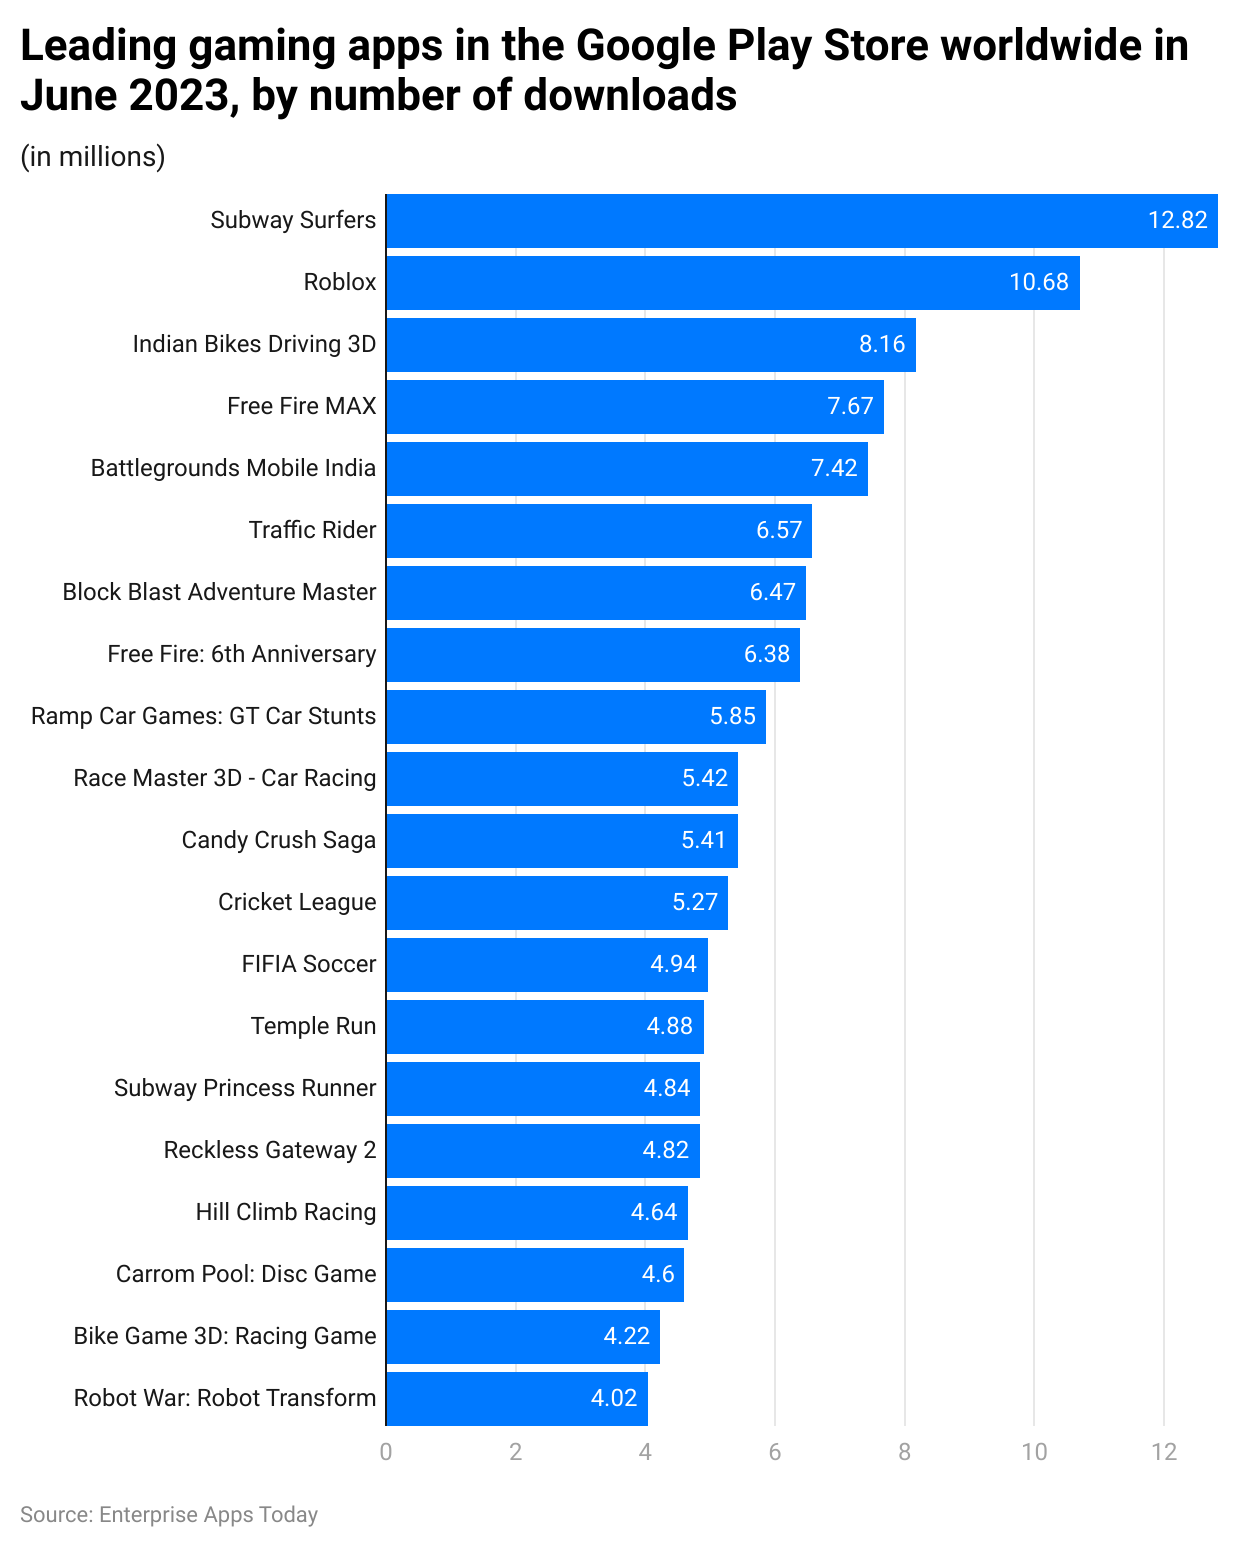
As of June 2023, the top 3 gaming apps by number of downloads were Subway Surfers (12.82 million), Roblox (10.68 million), and Indian Bikes Driving 3D (8.16 million). Other games listed in this category include Traffic Rider, Free Fire MAX, Candy Crush Saga, etc.
Number of Downloads of Selected Video Streaming Mobile Apps
(Reference: statista.com)
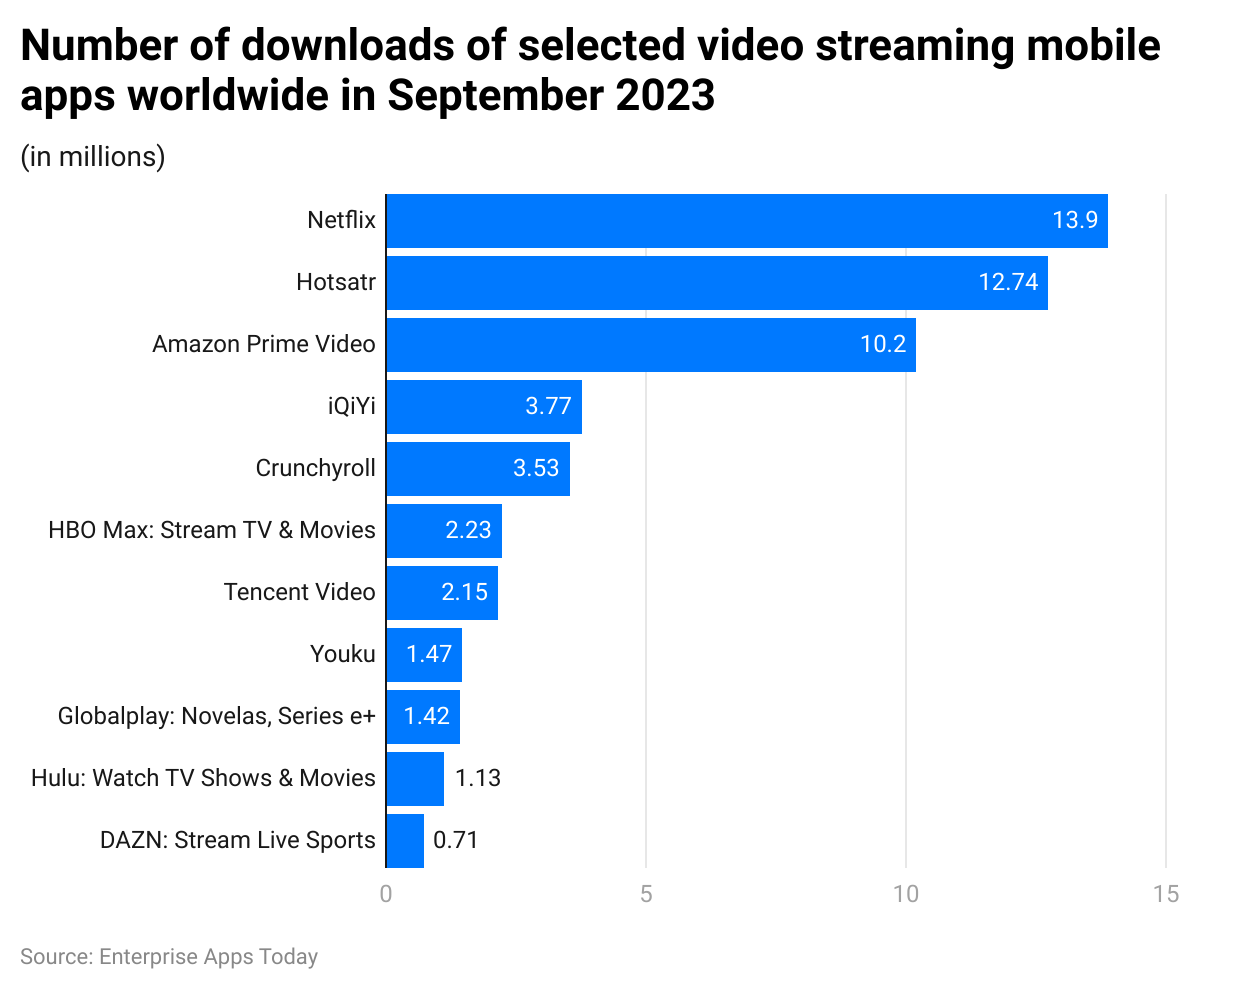
As of September 2023, Netflix generated 13.9 million global downloads, followed by Hotstar 12.74 million and Amazon Prime Video 10.2 million.
Mobile App Downloads by Store from 2021 to 2026
(Reference: statista.com)
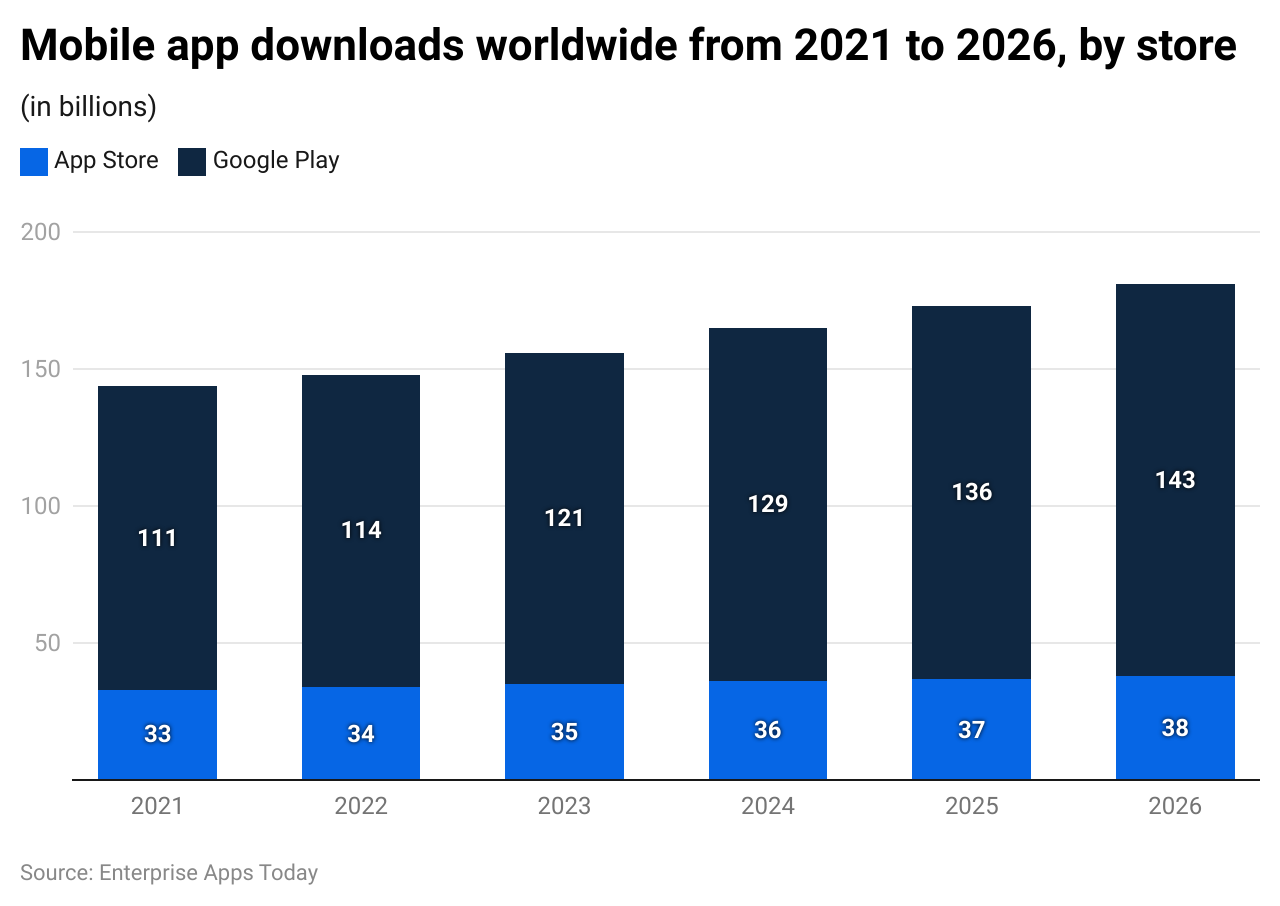
From 2021, Android mobile users are dominant around the world, thus this proves that, even in coming years it is expected to be at the same position as compared to iOS users. Thus, followed by the above prediction, by 2026, Google Play is expected to generate 143 billion mobile downloads whereas it will be just 38 billion app downloads for iOS systems.
Conclusion
Google Play is a default platform on all Android devices to download any kind of app. There is not a single thing we do not have on the digital platform. Google Play or App Store is making various categories of apps available for free and most of them we use daily. Looking at the overall Google Play Store Statistics, this platform is expected to be dominant in the coming years with the major difference in mobile app downloads. We use Facebook, and WhatsApp and scroll through reels all day long on Instagram, and all of these are downloaded from these stores only. Don’t you think these have become a part and parcel of our lives?
Sources
FAQ.
First, sign up for a developer account on Google Play, then create a merchant
account, then proceed to create an application, then add an app rating to target a
specific audience, upload APKs, then add the desired app on the dashboard, select
price and region if applicable and finally publish your app.
On average, for every 1 download, the revenue is between $0.60 to $1.20. However,
the average may change depending on the policies.
Considering today’s digitalization, shopping, and gaming segments are top revenue-
generating categories for developers.
For every 10K downloads, the app will make around $5 to $8 per day.

Barry is a lover of everything technology. Figuring out how the software works and creating content to shed more light on the value it offers users is his favorite pastime. When not evaluating apps or programs, he's busy trying out new healthy recipes, doing yoga, meditating, or taking nature walks with his little one.