
Mobile Application Revenue Statistics 2024
Page Contents
- How Big Is The Mobile Application Development Market?
- Mobile Apps Market during the Forecast Time
- Mobile Application Market Top Players Company Profiles.
- Age-related Statistics on the Usage Of Mobile Applications Worldwide
- Mobile App Download Statistics & Usage Statistics
- Most Popular Google Play Store App Categories
- Future Forecasts of the Mobile Application Industry: What will the future hold?
- Miscellaneous Facts About Mobile Application Statistics 2023
- Conclusion
Mobile Application Revenue Statistics: The global mobile application market, as reported by Grand View Research, showed considerable growth in 2022, with a valuation of USD 206.85 billion. This market is expected to continue its upward trajectory at a Compound Annual Growth Rate (CAGR) of 13.8% from 2023 to 2030. Key factors influencing this growth include:
- Increased Internet Usage: The surge in internet adoption, particularly in emerging economies like Brazil, China, and India, is a primary driver. The internet has become the most favored communication medium across various devices over the last decade.
- Growth in App Purchases: The expansion of the online retail sector, coupled with exclusive e-commerce offers and discounts, has boosted the number of users purchasing mobile apps.
- Rising Mobile Gaming Popularity: There is a significant increase in gamers willing to spend on mobile gaming apps, with a noticeable double-digit growth from the previous year.
- Impact of COVID-19: The pandemic led to a spike in downloads for games, social media, and entertainment apps, surpassing other app categories.
- Type Segmentation: The Apple App Store led the market share in 2022, mainly due to the variety of iOS-based mobile applications for devices like iPhones, iPods, and iPads. The Apple App Store's user-friendly interface for downloading, updating, and accessing apps contributes significantly to the enhanced mobile experience for iOS users.
- Application Categories: The market is diverse, encompassing games, social media, entertainment, health and fitness, tourism, hospitality, retail and e-commerce, education, and learning, among others. This diversity reflects the wide range of consumer needs and interests catered to by the mobile app industry.
- Regional Analysis: The market spans across North America, Europe, Asia-Pacific, and LAMEA, indicating its global reach and the varying consumer preferences across different regions.
- Google Play Store's Potential: While the Apple App Store currently dominates, the Google Play Store is expected to witness substantial growth. This is attributed to its accessibility to Android users worldwide and the opportunities it offers developers to reach a broader audience.
How Big Is The Mobile Application Development Market?
The market for mobile app development is huge. In fact, it's one of the largest markets spread around the world. With cloud-based solutions, the drawbacks of development on-site have been reduced. This has boosted the development of the app creation business.
- Market Valuation (2021-2022): The mobile application market was valued at USD 187.58 billion in 2021, growing to USD 206.73 billion in 2022. This indicates a robust and expanding market.
- Growth Rate (2021): Experienced a significant year-on-year increase of 20.45% in 2021. This sharp rise reflects the rapidly increasing demand and adoption of mobile applications.
- Forecasted Growth (2020-2025): Predicted to expand by USD 653.91 billion between 2020-2025, accelerating at a CAGR of 20.65%. This suggests a consistently strong growth trajectory for the market.
- App Download Trends (2016-2021): Downloads increased from 140.7 billion in 2016 to 230 billion in 2021, marking a 63% growth over five years. This trend underscores the rapidly increasing consumer engagement with mobile apps.
- Projected Growth of App Downloads (2022-2030): Estimated to grow at a rate of 13.4% from 2022 to 2030, reaching a value of USD 565.40 billion by 2030. This projection indicates a sustained interest in app usage and downloads.
- Mobile App Revenue Forecast (2025): Expected to exceed 613 billion U.S. dollars, with mobile games driving the largest revenue share. This highlights the significant financial impact of mobile apps, particularly in the gaming sector.
- App Store Revenue (2020): Revenue generated by stores was around $80 billion in 2020, reflecting the substantial economic value of the app marketplace.
(Source: appmysite.com)
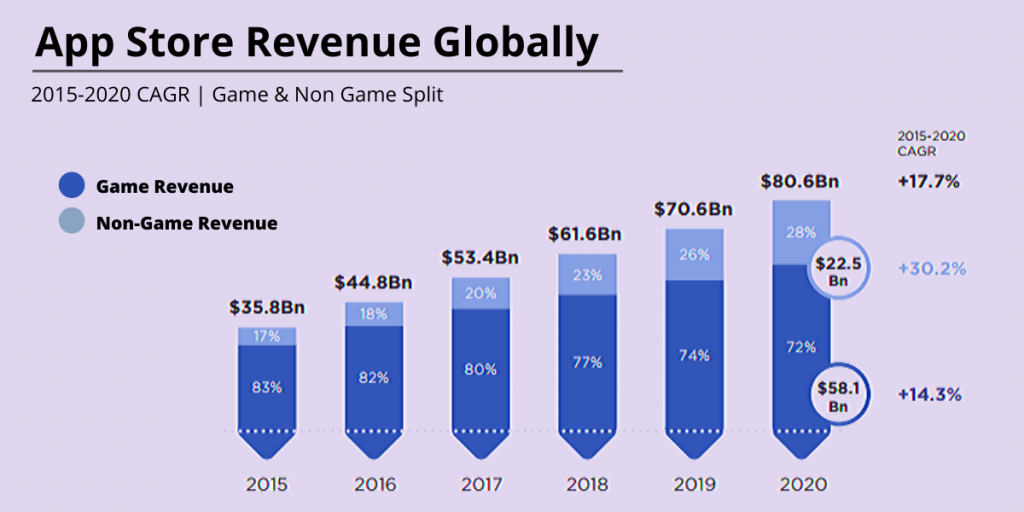
- 2015 Revenue Overview:
- Total Revenue: $35.8 billion.
- Gaming Apps: Contributed 83% of total revenue.
- Non-Gaming Apps: Made up 17% of revenue.
- Analysis: Gaming apps dominated the market, indicating their popularity and profitability.
- 2016 Revenue Trends:
- Total Revenue Increase: Grew to $44.8 billion.
- Gaming Revenue Share: Slightly decreased to 82%.
- Non-Gaming Revenue Share: Rose to 18%.
- Insight: A continued dominance by gaming apps, albeit with a slight increase in non-gaming app revenue.
- 2017 Market Growth:
- Revenue Growth: Increased by $9 billion, reaching $53.4 billion.
- Context: Represents a substantial year-over-year market expansion.
- 2018 and 2019 Revenue Patterns:
- Growth Continuation: Steady increase in total revenue.
- Gaming Revenue Percentage: Dropped to 77%.
- Non-Gaming Revenue Percentage: Increased to 23%.
- Observation: A gradual shift with non-gaming apps gaining a larger share of the market.
- 2020 Revenue Breakdown:
- Total Revenue: Reached $80.6 billion.
- Gaming Revenue Share: Further reduced to 72%.
- Non-Gaming Revenue Share: Increased to 28%.
- Conclusion: Non-gaming apps are steadily capturing more market share, indicating diversification in app usage and monetization strategies.
These bullet points outline the evolving dynamics of the mobile application store revenue from 2015 to 2020, with a consistent growth in total revenue and a gradual shift in the revenue contribution between gaming and non-gaming applications.
According To Statista
- Total Market Revenue (2022): Projected to reach US$420.80 billion in 2022. This figure represents the overall financial size of the app market.
- Revenue Growth Rate (2022-2027): Anticipated CAGR of 8.83%, leading to a market volume of US$673.80 billion by 2027. This growth rate indicates a healthy, expanding market.
- Revenue Streams (2022):
- In-app Purchases: Expected to reach US$149.90 billion.
- Paid Apps: Projected at US$5.02 billion.
- Advertising: Estimated to be US$265.80 billion.
These revenue streams reflect diverse income sources within the app market.
- Downloads and Revenue Per Download (2022): Approximately 235.30 billion downloads are projected, with an average revenue per download of US$1.79. This metric provides insight into the profitability of app downloads.
- Top Revenue-Generating Country (2022): Most revenue is generated in China (US$162.90 billion), indicating the country's significant market share in the global app economy.
Mobile Apps Market during the Forecast Time

(Source: technavio.com)
- The global Mobile app market size is expected to increase in the amount of approximately USD 1,095.9 billion between 2022 and 2027, accelerating by a compound annual rate of growth (CAGR) that is 22.97 percent.
- A rising number of smartphone users with greater attention to AR apps and growing online commerce are three major factors driving the market's growth.
- The market report for mobile apps includes extensive coverage of market segmentation based on platform (android market iOS market as well as others) as Type (gaming music and entertainment, fitness, health, social networks, and many more) and geography (APAC, North America, Europe, South America, and Middle East and Africa).
Mobile Application Market Top Players Company Profiles.
- Intellect Soft LLC – Intellect Soft has 100 employees, and the revenue per employee ratio is $90,800. Intellect soft peak revenue was $9.1M in 2022.
- Microsoft Corporation – Microsoft revenue for the twelve months ending June 30, 2023, was $211.915B, a 6.88% increase year-over-year. Microsoft's annual revenue for 2023 was $211.915B, a 6.88% increase from 2022. Microsoft's annual revenue for 2022 was $198.27B, a 17.96% increase from 2021.
- Google.Inc – Out of the total revenue of $69.8 billion, search ads accounted for $40.4 billion, representing 57.8% of the revenue. Revenue from Google Network ads was $7.5 billion (10.7%), and YouTube ad revenues reached $6.7 billion (9.6%).
- Hewlett Packard Enterprise Company – Hewlett Packard Enterprise's revenue for the twelve months ending July 31, 2023, was $29.655B, a 5.99% increase year-over-year. Hewlett Packard Enterprise's annual revenue for 2022 was $28.496B, a 2.56% increase from 2021. Hewlett Packard Enterprise's annual revenue for 2021 was $27.784B, a 2.97% increase from 2020.
- Cognizant Technology Solutions Corporation – Cognizant Technology Solutions revenue for the twelve months ending September 30, 2023, was $19.434B, a 0.35% increase year-over-year. Cognizant Technology Solutions annual revenue for 2022 was $19.428B, a 4.98% increase from 2021.
- IBM Corporation – For the year, IBM generated USD 60.5 billion in revenue and USD 9.3 billion in free cash flow. Our focus on delivering client value fueled revenue growth of 12% at constant currency in 2022, including about four points from incremental external sales to Kyndryl
- Broadcom, Inc – Broadcom's revenue for the twelve months ending July 31, 2023, was $35.454B, an 11.91% increase year-over-year. Broadcom's annual revenue for 2022 was $33.203B, a 20.96% increase from 2021. Broadcom's annual revenue for 2021 was $27.45B, a 14.91% increase from 2020.
- Verbat Technologies LLC- Verbat's revenue is $19.8 Million
- Netflix.Inc – Netflix revenue for the twelve months ending June 30, 2023, was $32.126B, a 3.53% increase year-over-year. Netflix's annual revenue for 2022 was $31.616B, a 6.46% increase from 2021. Netflix's annual revenue for 2021 was $29.698B, an 18.81% increase from 2020.
- Apple, Inc. – Apple's total net sales amounted to 29 billion U.S. dollars in their 2023 financial year, a decrease from the historical record of 394.33 billion U.S. dollars in the financial year 2022. Apple's annual revenue quadrupled in the last ten years.
 (Source: appmysite.com)
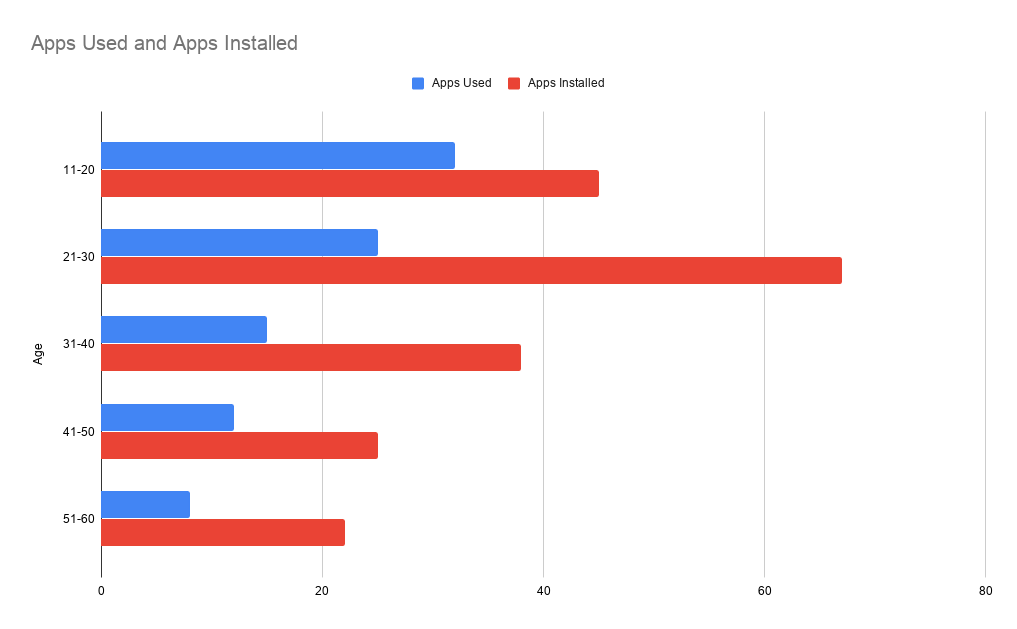
The demographics of mobile app use show that users of different age groups exhibit distinct behavior in relation to mobile applications. The data on the use of mobile apps by age reveal intriguing usage patterns, which are explained in the following paragraphs:
- Who is more likely to use apps – As is obvious, teens and young adults tend to spend more time with apps. 18 to 24-year-olds consume 112.6 hours while 25- to 34-year-olds consume 102.4 hours using apps over the course of a month. The people over 35 are spending under 100 hours per month using apps. The same goes for those who are over 65. years old spend just 51.4 hours per month using apps.
- App downloads by country – In 2022 China recorded a total of 111 billion downloads of mobile apps. India recorded 29 billion downloads within the same time frame, and the United States reached 12.24 billion downloads. In recent times, mobile app downloads have shown an upward trend in most countries.
- App usage by country – The app used by the country in 2022 Indonesian smartphone users logged 5 hours and 39 mins per day using mobile apps every day which was up four percent over 2021. Brazil was second in the rankings with the highest usage per day of apps in 2022, having 5.19 hours of consumption per day. Germany and China came last, in the rankings with 3.36 minutes and 3.33 hours of time spent each day on apps according to.
- Genre representation of Android apps – During the 2nd quarter of 2022 various mobile app categories experienced more use from male users than female users. About 92 percent of the automotive and car apps were accessed by men and only 8 percent of women were using this type of app. Male users accounted for 88 % of the users for business and finance apps. On the other hand, only the majority of parental apps had female users in the study period.
- The top apps in terms of preference by the age of users – Research indicates that the top app that millennials simply cannot do without is Amazon and is which is followed by Gmail and Facebook. Seventy-five percent of Gen Z users consider Snapchat as the best platform to stay connected and 71% of them vote YouTube as the top choice for content that is long-form.
- The most popular app categories according to the age of – Generation Z (those born after the nineties) is a group of people who spend the majority of their online media time using apps. Additionally, they spend thirty more time using their favorite apps than the average populace.
- Social media app usage – 20 to 29-year-olds spend the most time with applications for social networks. 13-19-year-olds are spending nearly the same amount of time using digital apps. It is evident that the use of social media apps is lower for people over 40 years old.
- The influence of age upon engagement in apps – Younger users remain the most active group across all categories of apps. In the 2nd quarter of 2022, comic apps received greater engagement from people between 18-24 years. More than half of downloads within the audio and music category originated from Android users who belong to the 18-24 demographic category. Three out of 10 users who download magazines and news apps are Between 50 and 64 and 22 percent of apps for parents were downloaded by those between 25-34 years old.
- Apps are a solution to boredom among millennials – About 74 percent of millennials admit to opening an app when they're bored. (Source: ComScore) This gives you the opportunity to create interesting videos, blogs, or other content to ensure that your users are engaged in your app to alleviate their boredom.
Mobile App Download Statistics & Usage Statistics
- With more than 6.3 million smartphone owners around the globe, it's not surprising that the mobile application market is growing. The use of apps and the penetration of smartphones continue to grow at a steady pace with no indication of slowing for the foreseeable future.
- Indeed, research shows how the majority of Americans check their phones every day 262 times! That's once every 5.5 minutes.
- Mobile apps will produce more than $900 billion in revenue by 2023.
- The Apple App Store has 1.96 million applications accessible to download.
- It is estimated that there are 2.87 million apps that are available to download from Google Play Store. Google Play Store.
- 21 percent of millennials use it more than 50 times every day.
- 49 percent of people use an application at least 11 times throughout the day.
- 70 percent of US internet-connected media is derived from mobile apps.
- It is estimated that the average smartphone user utilizes 10 apps a day, and 30 applications per month.
- In reality, 98% of the revenue generated by mobile apps worldwide is generated by free apps. Just a tiny fraction of people would purchase downloads.
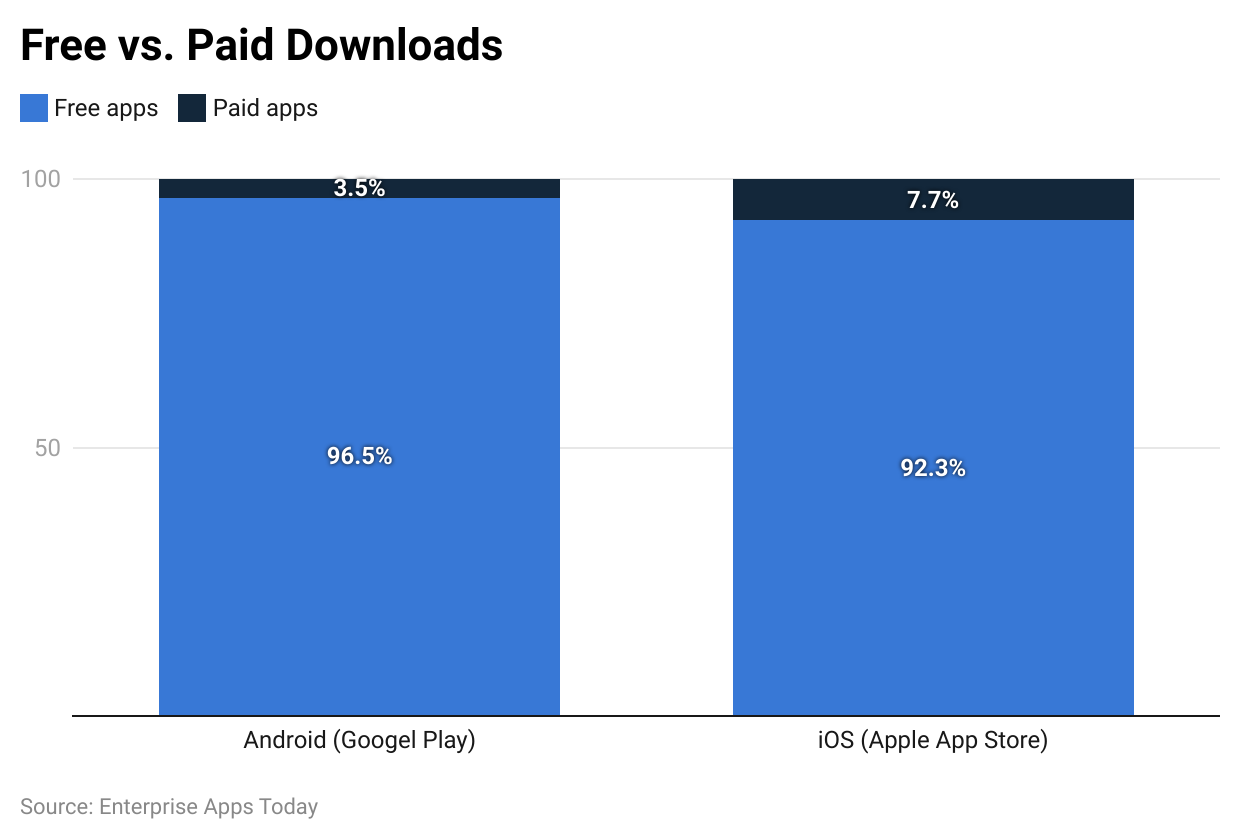
(Reference: buildfire.com)
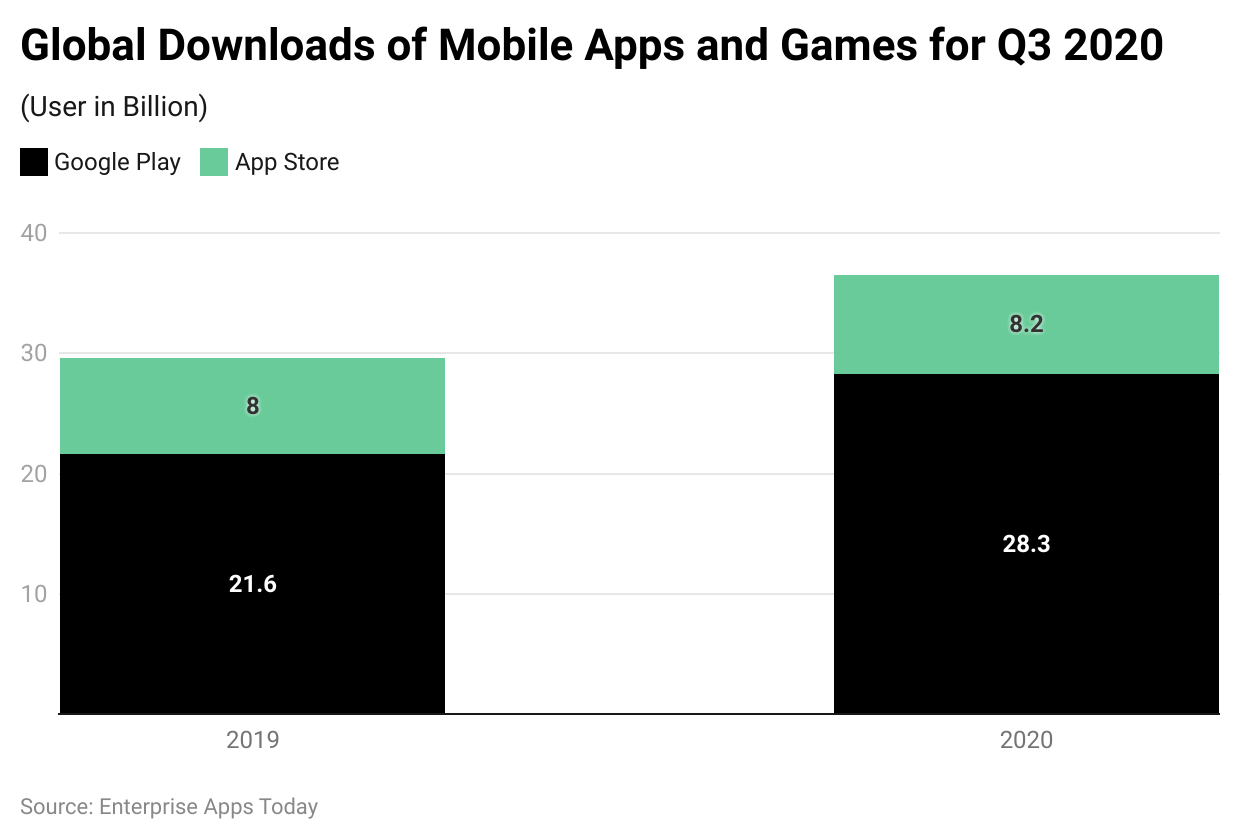
- Around the world, There are more downloads through Google Play Store than from Google Play Store. As you can see, both stores witnessed growth in the percentage of downloads between 2019 and 2020.
- It was reported that the Google Play Store downloads increased by 31%while it was the Apple App Store had just a 2.5 percent growth rate.
- In short, it is that it is clear that the Google Play Store has more downloads and is growing at a faster pace.
(Reference: buildfire.com)
Most Popular Google Play Store App Categories
You can measure the success of an app category based on penetration. According to Statista, these are the app categories with the highest penetration rate among Android users.
Some of these categories for leading Android apps need to be taken with a grain of salt. For example, look at the top categories on the list. Those apps (such as communication apps) likely come pre-loaded on all Android devices.
- Tools — 99.81%
- Communication — 99.93%
- Business Apps — 99.33%
- Video Players & Edit— 96.63%
- Travel & Local — 95.7%
- Social Media Apps — 95.02%
- Productivity — 91.67%
- Music & Audio — 88.38%
- Entertainment — 83.85%
- News & Magazines — 81.11%
- Photography — 75.77%
- Books & Reference — 70.74%
- Lifestyle — 65.67%
- Personalization — 61.62%
- Games (Casual) — 58.86%
- Games (Puzzle) — 56.5%
- Games (Arcade) — 55.08%
- Shopping — 35.79%
- Games (Action) — 34.19%
- Weather — 32.46%
Future Forecasts of the Mobile Application Industry: What will the future hold?
(Reference: appmysite.com)
- Forecast for app downloads – In 2026, consumers are expected to download an estimated 143 billion mobile apps through Google Play Store. Google Play Store, up by 30 percent over 111 billion downloaded apps in 2021. In the same way, it is predicted that the Apple App Store is expected to have 38 billion downloads, which is an increase of about 15 percent over the next five years.
- Forecast for mobile payments – The global mobile payment market is predicted to increase by 2.98 trillion US dollars in 2023 and reach 18.84 trillion US dollars in 2030. This shows an annual growth rate of 30.1 percent over the forecast timeframe.
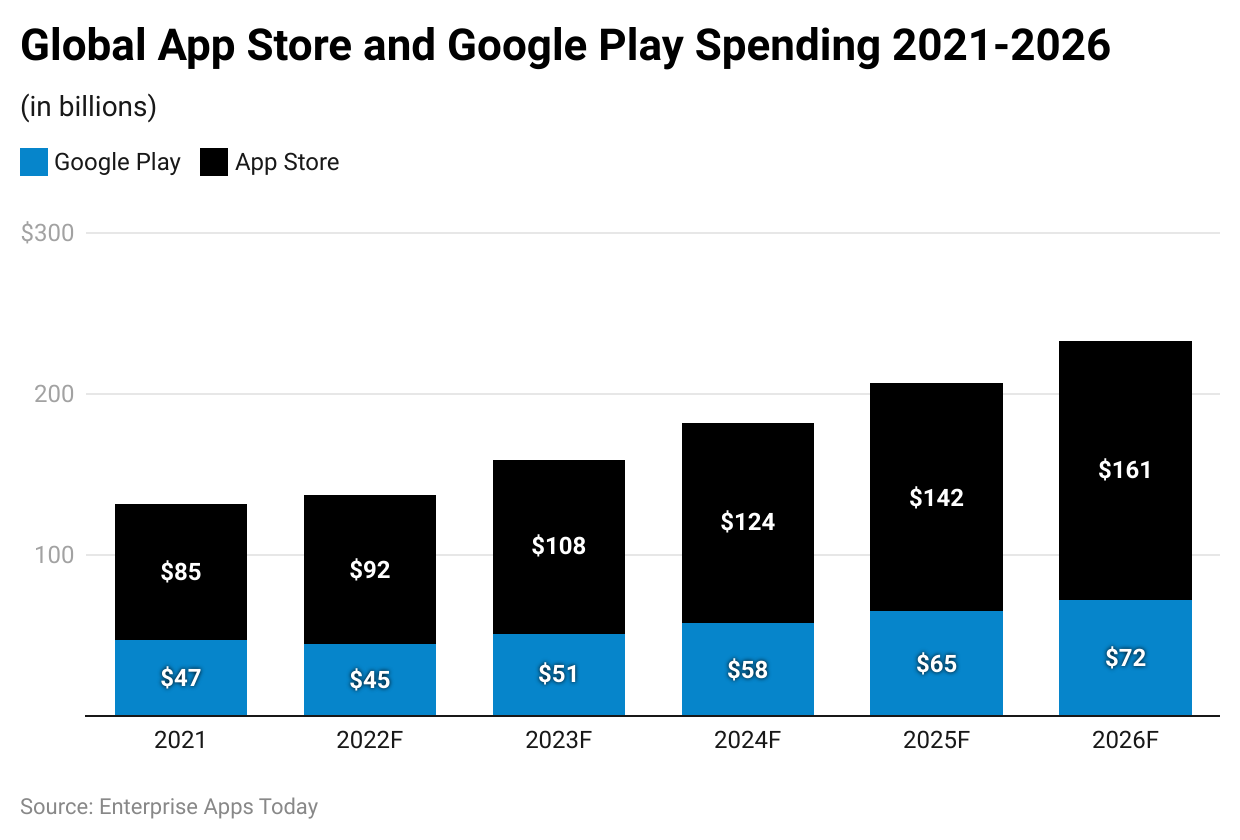
- The future App Stores – By 2027, the amount spent on the App Store of Apple will exceed 125 billion US dollars. The total amount of user spending on the App Store as well as Google Play is estimated to exceed 181 billion US dollars.
- Categories of top apps to be forecast – Keeping the ever-leading gaming apps out of the equation, social games, entertainment applications along productivity and entertainment apps are expected to expand as the most popular non-gaming app categories on app stores. Entertainment and social will likely be tied for a share of six percent in revenue in 2026.
Miscellaneous Facts About Mobile Application Statistics 2023
- The number of apps available for download worldwide has increased by 82% since 2016.
- People spent 3.8 trillion hours on mobile apps in 2022.
- 6% of people will still be using an Android app 30 days after they download it. For iPhone apps, it’s 4.3%.
- 2 million new apps were launched in 2021 alone.
- In 2021, $320,000 was spent every minute in the app stores.
Conclusion
The market for mobile apps is growing quickly and has incorporated itself into the digital world. Mobile applications offer users many options of features and services thanks to the rising popularity of tablets and smartphones,
The need for customized and user-friendly experiences is driving the development of mobile applications. The users are seeking out applications that can satisfy their specific needs and preferences, whether it's for gaming, social networking, productivity, shopping, or any other use.
So, developers are developing numerous applications to meet the various tastes and demands that smartphone customers have. The number of potential users for mobile apps has increased due to the rise in smartphone users.
Businesses face risks associated with the evolving technological landscape and the increasing demand for market services as well as the expertise and technical resources needed to build mobile applications. Developers are focusing on the development and introduction of new apps that are able to meet consumer demands and trends in the highly competitive and dynamic industry.
Sources
FAQ.
Beacon technology is an upcoming trend in the mobile app development scenario. It uses Bluetooth low-energy signals to transmit and connect to mobile devices within a 100 feet range. Mobile apps using beacon technology will be able to suggest the best services nearby for the consumer by using the device location.
The global mobile application market was valued at $208.5 billion in 2022, and is projected to reach $777.4 billion by 2032, growing at a CAGR of 14.4% from 2023 to 2032. A mobile application is a work of software that is intended to run on a mobile device.
21% of Millennials open an app 50+ times per day. 49% of people open an app 11+ times each day. 70% of all US digital media time comes from mobile apps. The average smartphone owner uses 10 apps per day and 30 apps each month.
Today, there are over seven million apps available across iOS and Android platforms, extending to every app and game genre and niche. These apps have come to play a huge role in the way we live our lives today
The Mobile Analytics market industry is anticipated to expand from USD 6.27 billion in 2023 to USD 26.08 billion by 2032, expanding at a compound yearly growth rate (CAGR) of 19.50% over the forecast period (2023-2032).
5G can be significantly faster than 4G, delivering up to 20 Gigabits-per-second (Gbps) peak data rates and 100+ Megabits-per-second (Mbps) average data rates. 5G has more capacity than 4G. 5G is designed to support a 100x increase in traffic capacity and network efficiency
The average app sizes vary for the two operating systems, for iOS it's around 35MB and for Android the number is around 12MB and obviously average sizes vary depending on which app category they are assigned to.
Speed. Both Wi-Fi 6 and 5G can theoretically provide gigabit speeds, which are often more than enough for most businesses. In a controlled environment, Wi-Fi 6 can achieve 9.6 Gbps while 5G can do up to 20 Gbps. In most cases, 5G will be faster but not all 5G is created equally.

Barry is a lover of everything technology. Figuring out how the software works and creating content to shed more light on the value it offers users is his favorite pastime. When not evaluating apps or programs, he's busy trying out new healthy recipes, doing yoga, meditating, or taking nature walks with his little one.