
Money Spent On Clothes Statistics 2024 By Demographics, Generation And Monthly Amount Spent
Page Contents
- Introduction
- Editor’s Choice
- Global Apparel Industry Statistics
- General Money Spent On Clothes Statistics
- Money Spent On Clothes Statistics By Demographics
- By Average Family Spending By Income Level
- By Types Of Preferred Stores For Apparel Shopping By Generation
- By Product Category
- Money Spent On Clothes Statistics Spending Pattern
- By Monthly Amount Spent On Online Clothing Purchases
- By Leading Second- Hand Apparel Online Shops
- By Spending Per Online Shopper By Category
- By Online Shopping
- By Devices Used In Online Shopping By Product Category
- By Deciding Factors
- Conclusion
Introduction
Money Spent On Clothes Statistics: Shopping is the most preferred activity and it does not need any occasion. Around the world, all shoppers buy clothes and apparel in stores or online. The data mentioned in this Money Spent On Clothes Statistics prove that the global clothing market has already touched trillions of revenue in every segment. Money spent on clothing is observed in all generations. Thus, the trend suggests that the most preferred shopping methods by generations are online, department stores, and big box stores.
Even in the coming years, with the help of technology, consumer trends will change but the habits of shopping in terms of clothing are never changing and therefore provide a bright future for the global clothing industry.
Editor’s Choice
- Per capita revenue in the global market is expected to reach USD 230.90 in 2024.
- The United States is forecasted to generate the highest revenue in the apparel industry, amounting to USD 359 billion in 2024.
- The worldwide apparel market is projected to grow to USD 1.79 trillion by 2024, with a compound annual growth rate (CAGR) of 2.72% leading up to 2027.
- An average American owns 75 to 100+ clothing items.
- Amazon dominates online apparel sales, accounting for 76% of purchases made via smartphones.
- Households allocate, on average, 3.8% of their total income to clothing purchases annually.
- Teenagers aged 18 to 19 years spend the most on clothing, averaging between USD 1,300 and USD 2,000 yearly. This is followed by those aged 15 to 17 years, who spend USD 800 to USD 1,200, and 12 to 14 years, spending between USD 500 and USD 700.
- Among American Gen Z shoppers, 17% prefer shopping for clothing on Amazon, with others favoring stores like Lulu’s, ASOS, Target, Walmart, and Costco.
- In 2023, Goodwill emerged as the leading second-hand apparel online store in the USA, with a brand awareness of 69%.
- Families earning between USD 20,000 and USD 70,000 annually spend an average of USD 1,700 on clothing each year.
Global Apparel Industry Statistics
- The global apparel industry is expected to reach USD 1.79 trillion in 2024.
- A growth rate of 2.72% is anticipated, aiming for a higher value by 2027.
- The United States is predicted to generate the most revenue, amounting to USD 359 billion in 2024.
- On average, each person might buy 24.1 pieces of clothing in 2024.
- By 2027, the total number of pieces purchased worldwide could hit 193.7 billion.
- Women's clothing is set to be the top-selling category, with sales reaching USD 0.94 trillion in 2024.
- Per capita spending on apparel is expected to be USD 230.90, based on the global population.
- A 1.3% increase in the quantity of clothes bought is projected for 2025.
General Money Spent On Clothes Statistics
- Americans lead globally in clothing expenditures compared to consumers in other nations.
- By 2025, the global clothing market is expected to reach USD 2.25 trillion.
- E-commerce dominates sales in the clothing sector worldwide.
- Annually, households allocate 3.8% of their income to clothing purchases.
- The USA accounts for 75% of online clothing shoppers.
- Amazon commands the largest portion of online apparel sales, with 76% conducted via smartphones.
- An average American owns between 75 to 100+ pieces of clothing, typically wearing an item at least 7 times before disposal.
- Consumer spending on clothing and footwear globally is anticipated to hit USD 2.9 trillion by 2029, marking a 20.44% increase from 2024 to 2029.
- Incorrect fit is the primary reason for returning online clothing purchases, accounting for 38% of returns.
- Online clothing sales surge by 46.2% during the holiday season, with spending priorities being gift cards (55%), clothing and accessories (49%), books, video games, or other media (28%), and personal care and beauty products (25%).
Money Spent On Clothes Statistics By Demographics
- According to a report of The State of Fashion by McKinsey, consumers under 20 years old buy clothing items that are not designed gender-wise.
Children
| Age Group | Yearly Spend on Clothing |
|---|---|
| 0 – 2 Years | Approximately $500 |
| 3 – 5 Years | Approximately $350 |
| 6 – 8 Years | Approximately $400 |
| 9 – 12 Years | Approximately $450 |
| 13 – 15 Years | Approximately $500 |
(Source: billpin.com)
Majorly, the parents of children spend below $500 for their kids aged from 0 to 15 years. However, 0 to 2 years and 13 to 15 years spend at least $500 on clothes shopping a year.
Teenage
| Age Group | Average Annual Spending on Clothing |
|---|---|
| 12-14 years | $500-$700 |
| 15-17 years | $800-$1200 |
| 18-19 years | $1300-$2000 |
(Source: billpin.com)
Every year, spending on clothing by teenage groups is highest in consumers aged between 18 to 19 years resulting in $1,300 to $2,000, followed by 15 to 17 years – $800 to $1200 and 12 to 14 years between $500 to $700.
By Average Family Spending By Income Level
| Income Level | Average Annual Clothing Budget |
|---|---|
| Low Income (<$20,000) | $550 – $750 |
| Middle Income ($20,000 – $70,000) | $1,700 |
| High Income (>$70,000) | $2,000 – $3,500 |
(Source: billpin.com)
The yearly average spend money on clothing for a family with an income level of $20,000 to $70,000 is $1,700. Less than $20,000 spent between $550 to $750. On the other hand, households with an income of more than $70,000 spend between $2,000 to $3,500.
By Types Of Preferred Stores For Apparel Shopping By Generation
Gen Z
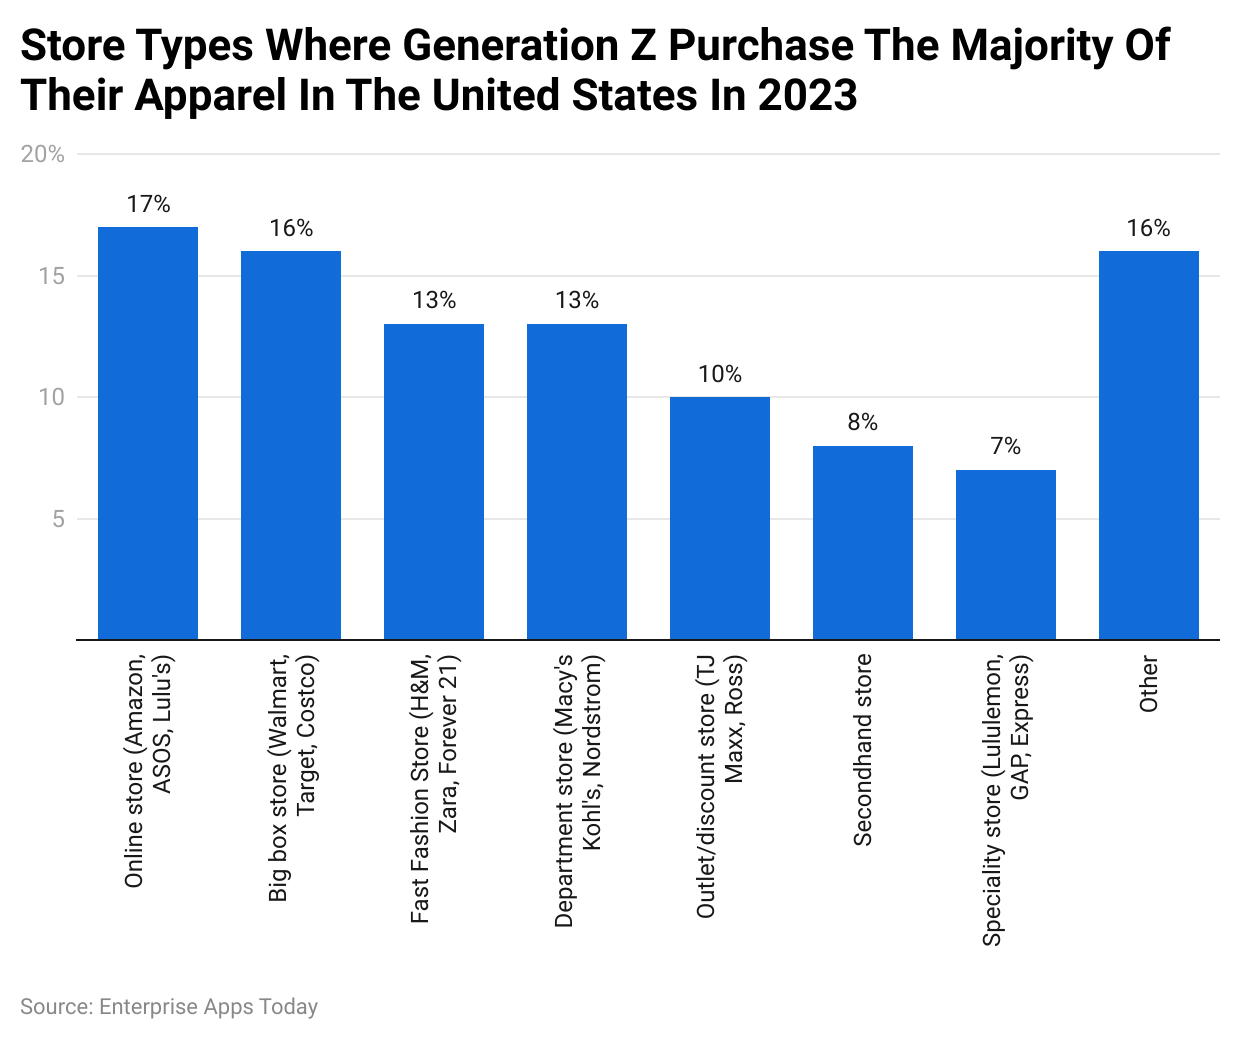 (Reference: statista.com)
The majority of American Gen Z clothing shoppers prefer to shop online on Amazon (17%), Lulu’s, and ASOS, while others prefer Big Box Stores such as Target, Walmart, Costco, and others. 13% equally prefer to shop at Fast Fashion stores and department stores. And remaining shoppers prefer Outlets, secondhand stores, and specialty stores.
By Age Group
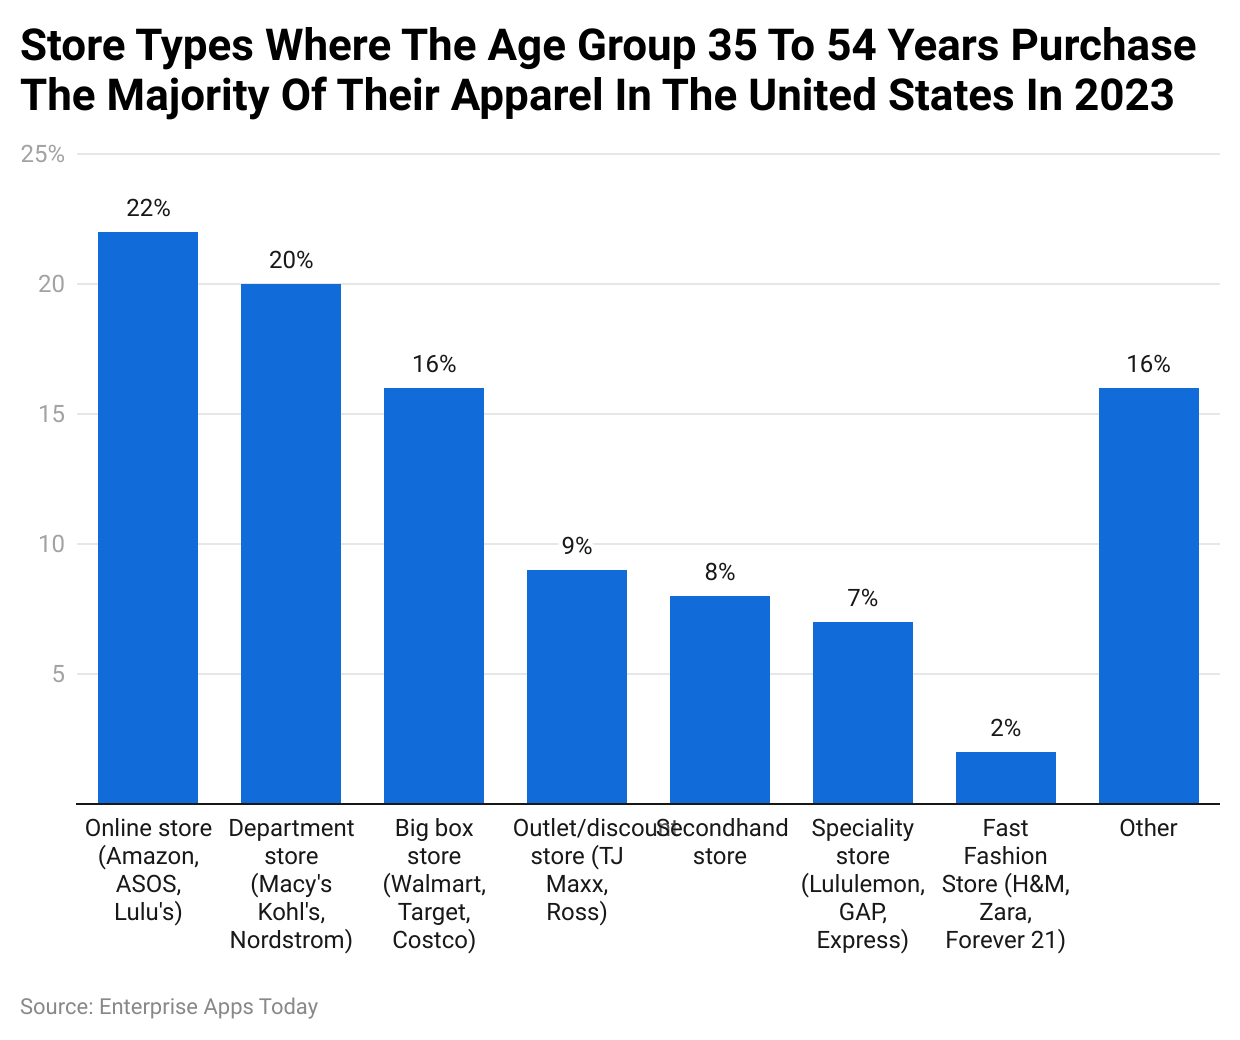 (Reference: statista.com)
Similarly, American consumers aged between 35 to 54 years prefer to shop online on various e-commerce sites (22%), followed by Department stores (20%) and Big box Stores (16%). Compared to Gen Z, outlet or discount stores, secondhand stores, specialty stores, and fast fashion stores have less demand from consumers aged 35 to 54 years.
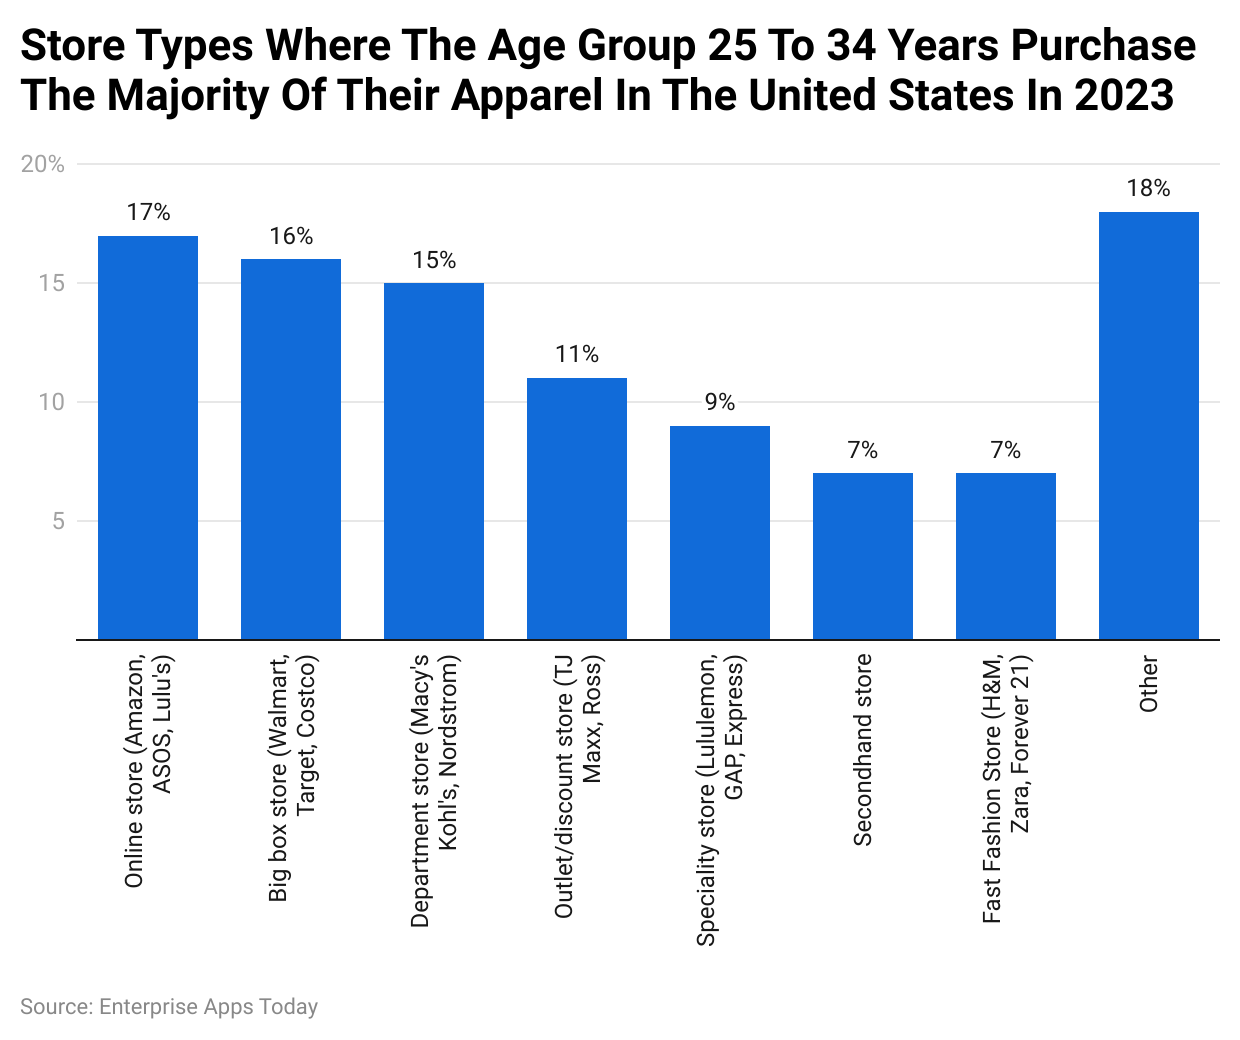 (Reference: statista.com)
Overall, the clothing shopping trends are similar in every generation. Even consumers aged between 25 to 34 years prefer to shop online, in big box stores, and in department stores.
By Product Category
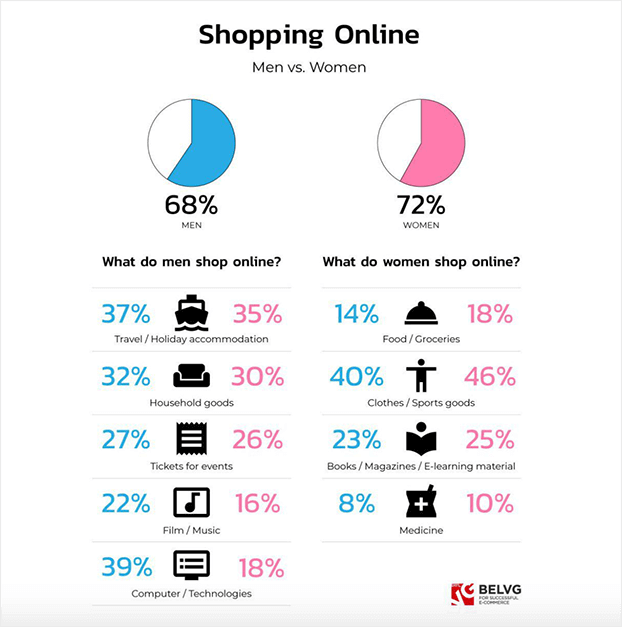
(Source: optinmonster.com)
Considering online shopping, women are more likely to give preference to clothing as compared to men. The rate of which is 40%, while men prefer travel and holiday accommodation booking.
Money Spent On Clothes Statistics Spending Pattern
- In the USA, the average family spending pattern on clothing every year is $1,700 while individual spending accounts for $1,932 on average.
- Furthermore, spending on clothing by women reaches up to $2,000 a year.
- Adult clothing expenditure on average per month is $161 which becomes $1,700 a year.
- Similarly, American women shoppers spend $2,000 on average yearly on clothes.
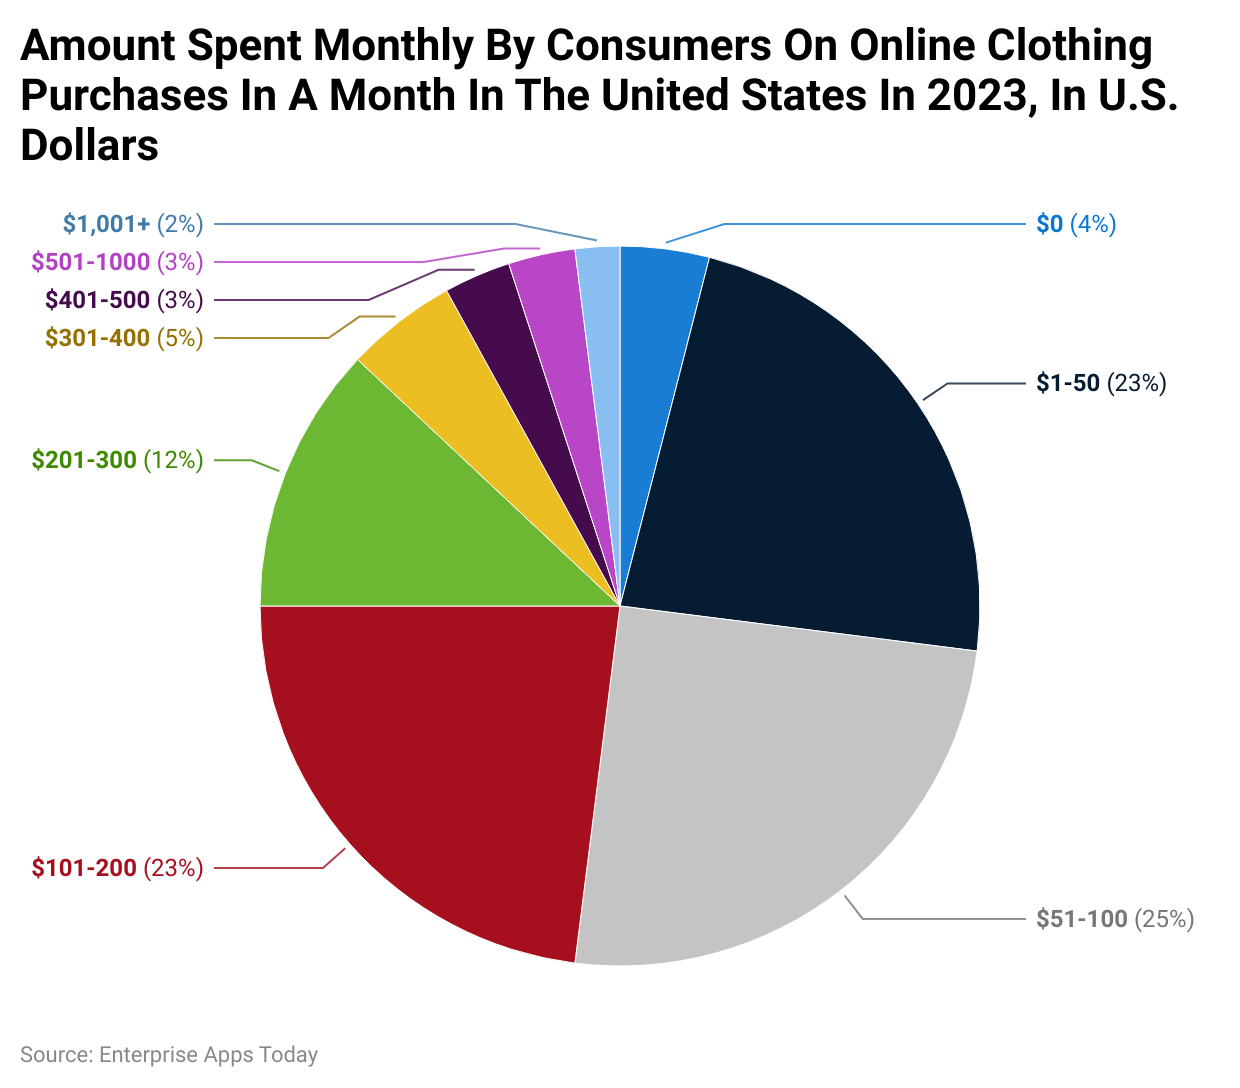
By Monthly Amount Spent On Online Clothing Purchases
 (Reference: statista.com)
As per Money Spent On Clothes Statistics 2023, most American shoppers who purchased clothes online spent between $51 to $100 representing 25% of the total shoppers. Furthermore, 23% of shoppers spend between $1 to $200 in a month. There were only 2% of buyers spending more than $1001 on clothing in a month.
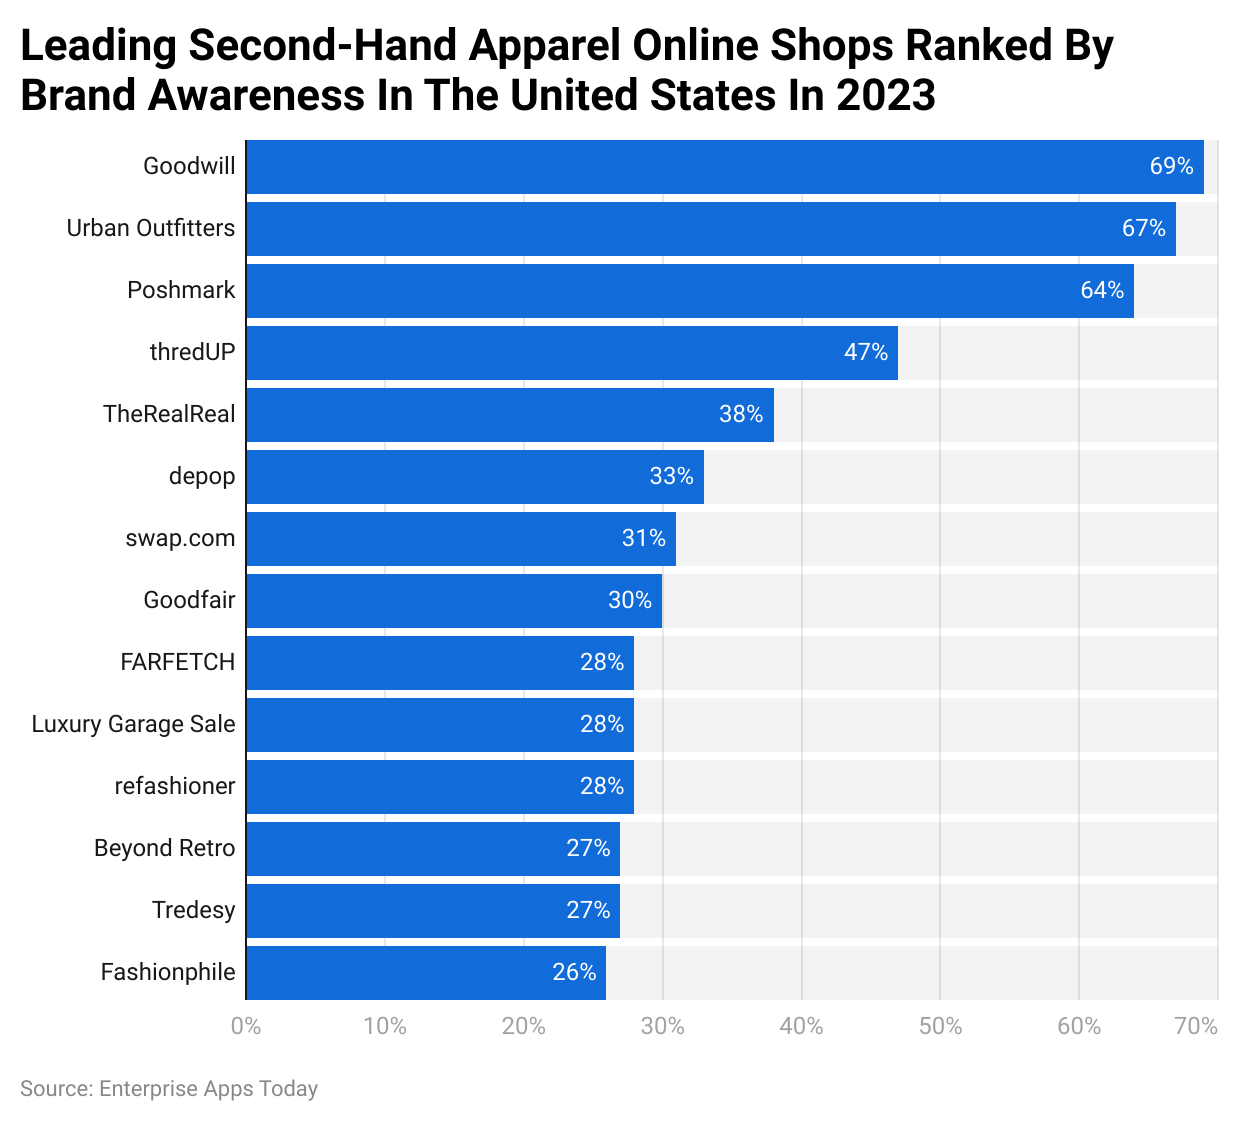
By Leading Second- Hand Apparel Online Shops
 (Reference: statista.com)
As of 2023, in the USA, Goodwill became the largest second-hand apparel online shop by brand awareness contributing 69%. Furthermore, Urban Outfitters and Poshmark were the other well-known brands with 67% and 64% of awareness. Other top brand names included thredUP, TheRealReal, Depop, Swap.com, Goodfair, and FARETECH etc.
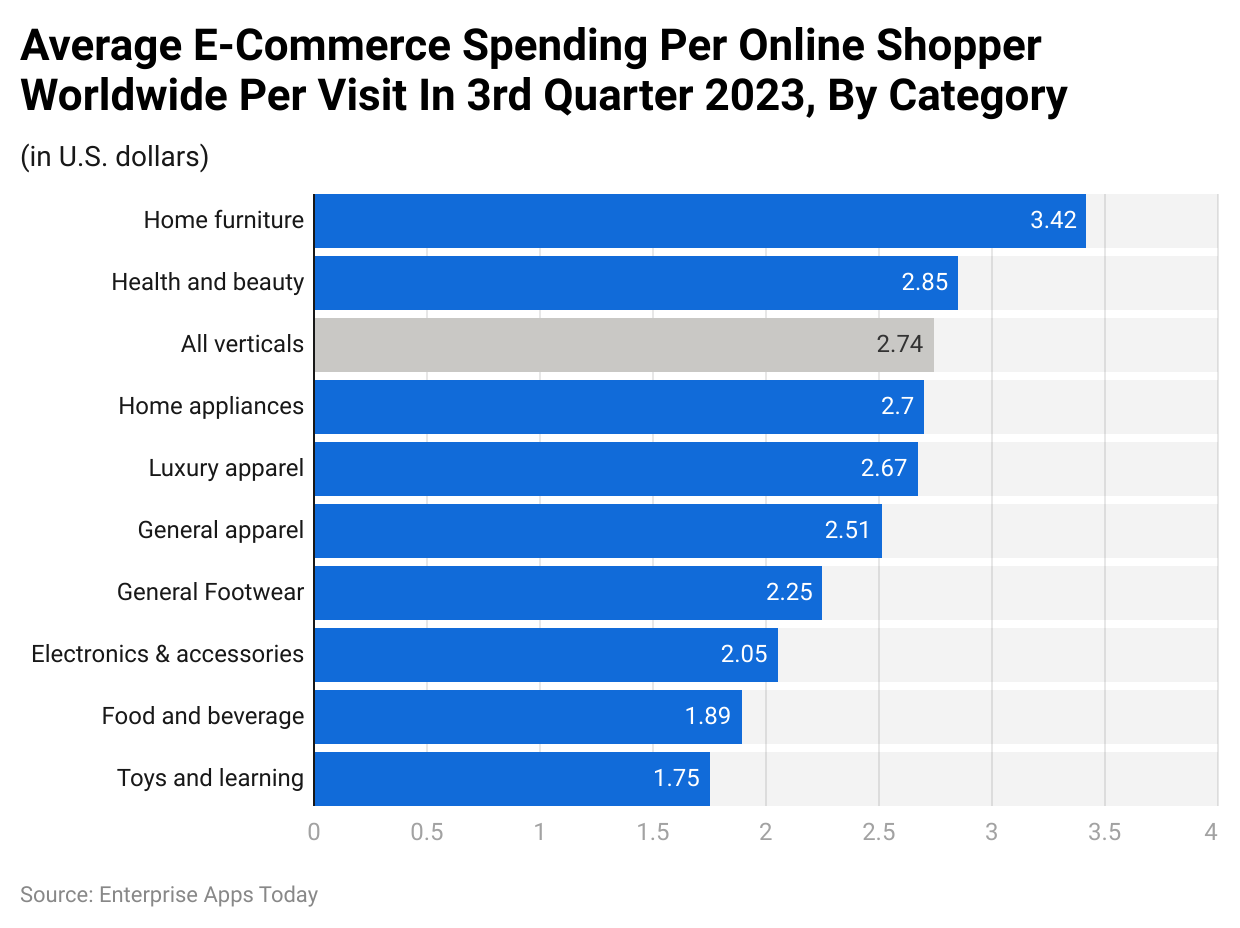
By Spending Per Online Shopper By Category
 (Reference: statista.com)
Money Spent On Clothes Statistics states that per online shopper spending around the world on general apparel is $2.51 on average. However, the highest money spent on the category is Home furniture $3.42, health and beauty $2.85, and home appliances $2.7.
By Online Shopping
(Reference: capitaloneshopping.com)
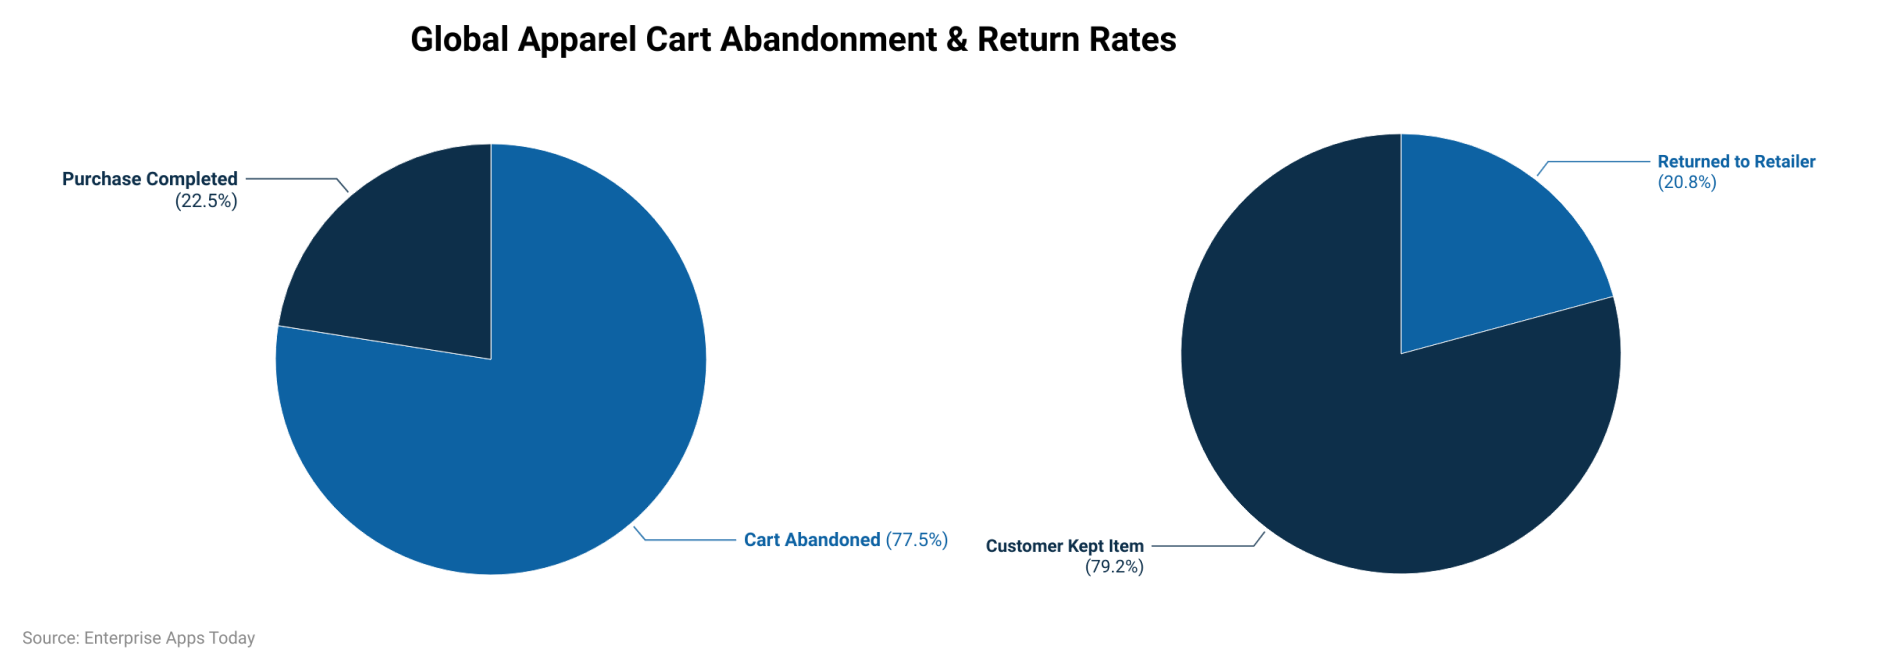
The global apparel cart abandonment rate is 77.5% whereas the purchase completion rate is just 22.5%. In terms of online clothing shopping, the majority of the customers keep the product they have received representing 79.2% while 20.8% return it to retailers.
By Devices Used In Online Shopping By Product Category
 (Reference: capitaloneshopping.com)
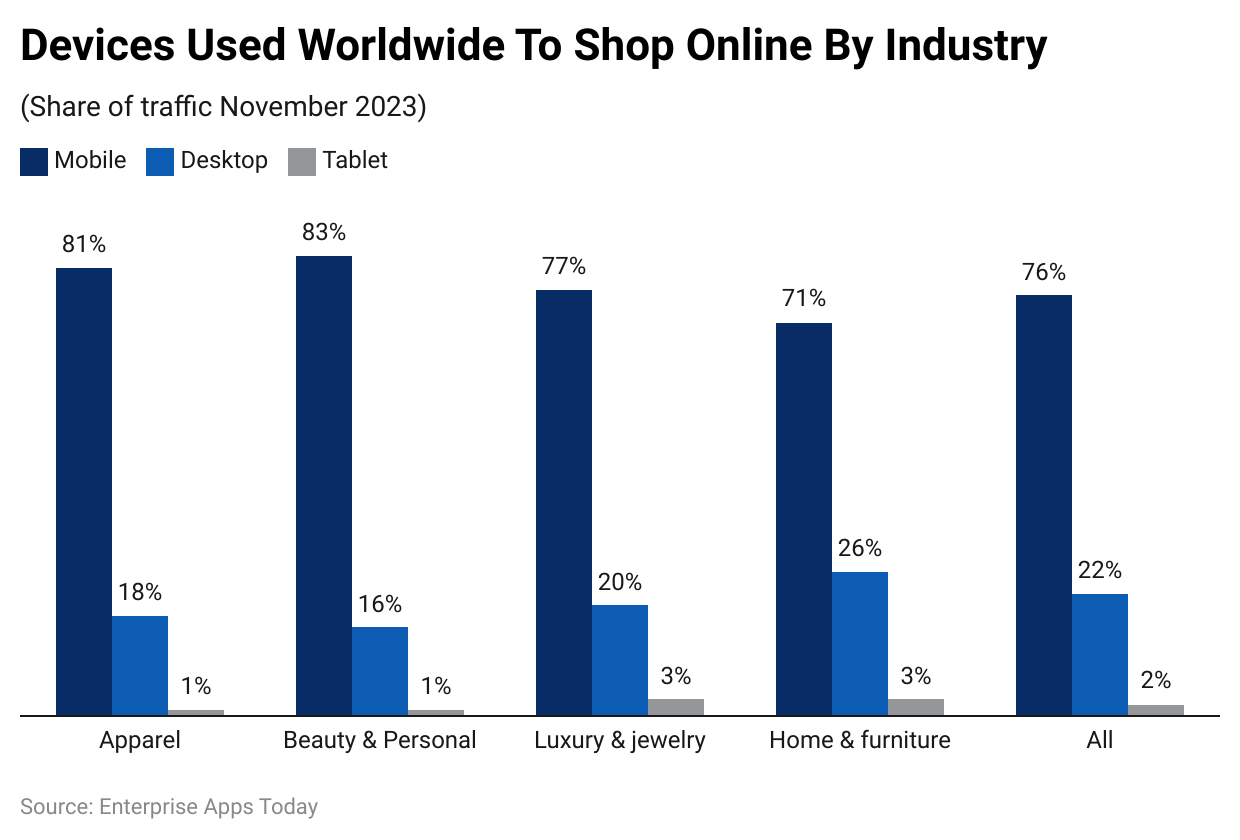
Considering apparel, beauty and personal care, luxury and jewelry, home and furniture, and other segments in online shopping, the majority of shopping is completed through mobile, followed by desktop and tablet. Mobile has more than 70% contribution in mentioned shopping categories.
By Deciding Factors
 (Reference: statista.com)
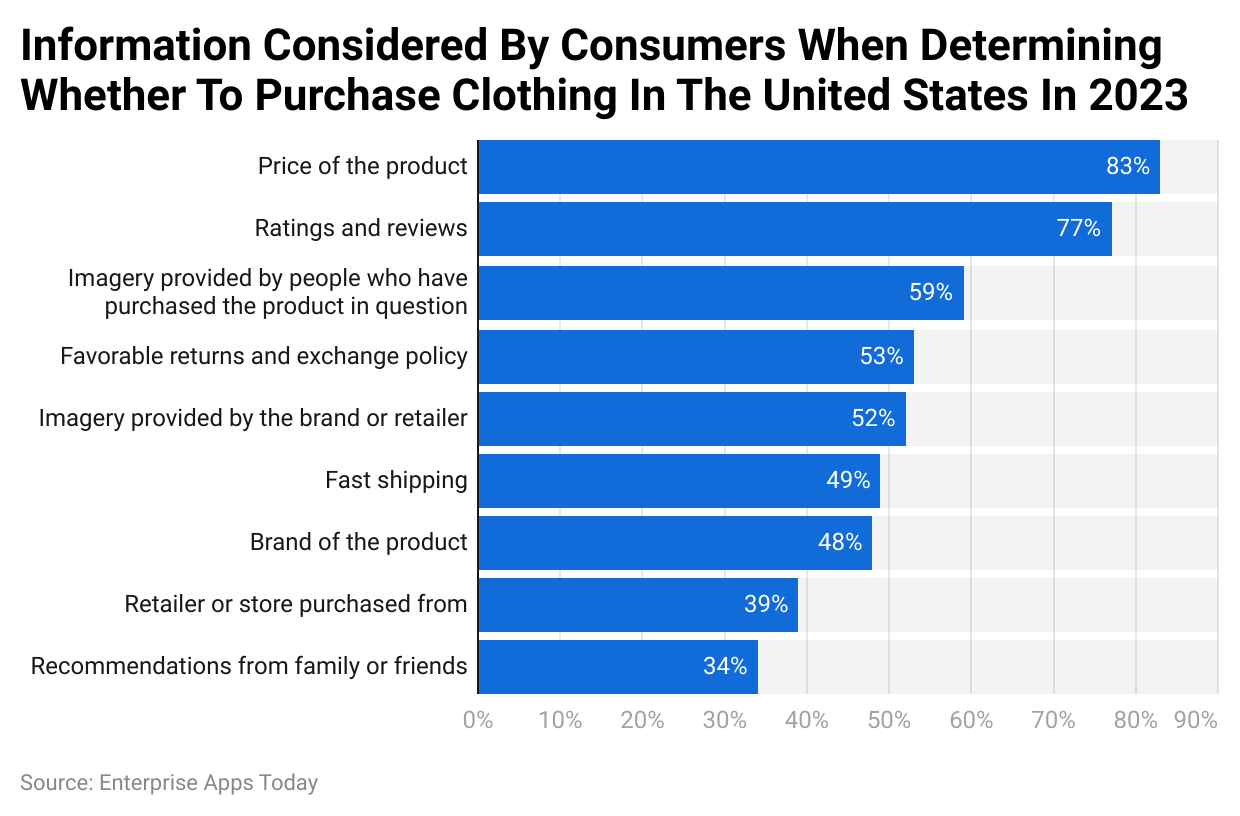
The price of the product is the top determining factor for clothes shopping for Americans as observed by Money Spent On Clothes Statistics resulting in 83%. Rating reviews and images provided by people who have purchased the product contributing 77% and 59% are two of the top 3 deciding factors. In factors included in such cases by American shoppers are return policy, images provided by brands or retailers, shipping time, brand name, and recommendations.
Conclusion
Clothing is one of the leading segments in the fashion industry. Fashion Industry is always changing according to the market trends. Well, fashion is not limited to the entertainment and media industry but general people also regularly shop for clothes. As digitalization was introduced, money spent on clothes was enhanced through sales through eCommerce.
Today, Money Spent On Clothes Statistics states the industry has reached a trillion dollars around the world. Moreover, as much as the trends are changing in the market, then only the spending will be increased until the market faces a stagnant phase.
FAQ.
The apparel market around the world is valued at $703.11 billion and is expected to grow at a CAGR of 7.2%.
According to a report by LinkedIn, women are more likely to do clothing shopping than men.
Every year in the US, men spend around $325 while women spend $545 on clothing shopping.

Barry is a lover of everything technology. Figuring out how the software works and creating content to shed more light on the value it offers users is his favorite pastime. When not evaluating apps or programs, he's busy trying out new healthy recipes, doing yoga, meditating, or taking nature walks with his little one.