
Media and Entertainment Industry Statistics and Facts

Page Contents
- Introduction
- Editor’s Choice
- What Includes Media and Entertainment?
- Top 10 Websites In Media and Entertainment (January 2023)
- General Media and Entertainment Industry Statistics
- Global Media and Entertainment Industry Statistics
- By Spending
- By Market Value
- By Region
- By Segment
- By Daily App Usage
- By Popularity
- By Platforms
- Media and Entertainment Industry Statistics By Demographics
- Media and Entertainment Industry Statistics By Country
- Conclusion
Introduction
Media and Entertainment Industry Statistics: Without the media and entertainment industry, no individual on this earth will be able to spend their time appropriately. The entertainment sources in this industry have increased while including technology. The industry is growing rapidly and expecting to get contributions from artificial intelligible in the overall media and entertainment segments.
This media and entertainment industry statistics is packed with interesting insights from around the world with interesting graphics for better understanding.
Editor’s Choice
- As of March 2022, Zee Entertainment Enterprise was the leading media and entertainment company considering the net sales of 66 billion Indian rupees.
- Considering the media and Entertainment Industry the Asian pacific is the fastest-growing market while North America is the largest market.
- As of the second quarter of 2022, the most popular video content overall reach around the globe is 92.7%
- In the United States of America, there are 96% of users from Gen Z and millennials play video games 11 hours and 13 hours each week respectively.
- Users from Gen Z listened to the radio for at least 46 minutes every day while 1 hour and 55 minutes were spent listening to music.
- The guardian ranked top in the most-read newspapers as of 2022 while having 35 million readers in the year 2022.
- Top Gun: Maverick was the grossing film in cinemas as of 2022 earning $718 million in revenue.
- Between 2022 to 2026, it is expected that global cinema spending will grow by 18.9%.
- Users from baby boomers choose to listen to the radio more than music comparing the ratio of 1 hour and 5 minutes to only 40 minutes.
- The year 2022, recorded global cinema revenues of 38 billion while 5.7 billion were admissions.
What Includes Media and Entertainment?
The Media and entertainment industry includes audio, video and animation, publishing, streaming media, music, social media, film, events, theatre and art, graphics, and interactive media. These segments are vast and divided into many other subcategories. Today, online, and offline media and entertainment content are ruling the world. The media and entertainment industry has not only been restricted to TV and movies but modern stuff such as technological developments – Artificial intelligence and virtual reality used along with the above-mentioned categories.
Top 10 Websites In Media and Entertainment (January 2023)
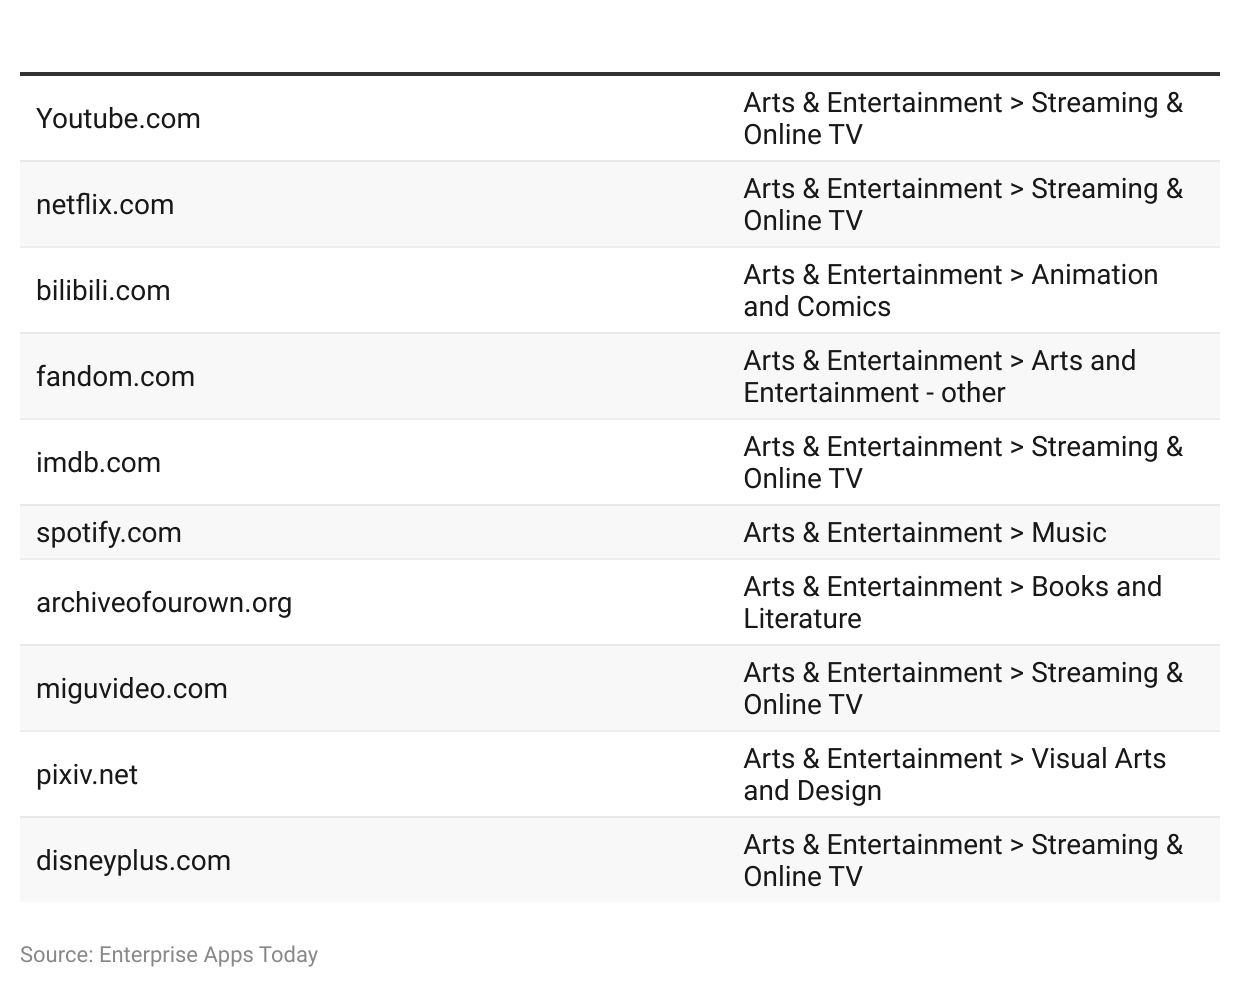 (Source: Similarweb)
- As of January 2023, Youtube.com ranked top in streaming and online TV segment, while Netflix.com ranked second in a similar segment.
- com has ranked third in the animation and comics segments while fandom.com has ranked fourth in the arts and entertainment segment.
- Other websites have been ranked in various segments respectively as follows: 5. imdb.com (streaming and online) 6. Spotify.com (music), 7. Archiveoffourown.org (books and literature) 8. Miguvideo.com (streaming and online TV) 9. Pixiv.net (visual arts and design) and disneyplus.com (streaming and online TV).
General Media and Entertainment Industry Statistics
- As of March 2022, Zee Entertainment Enterprise was the leading media and entertainment company considering the net sales of 66 billion Indian rupees.
- Between 2022 to 2026, it is expected that global cinema spending will grow by 18.9%. In a similar period, the consumption of data will be increased by 26%.
- Considering the media and Entertainment Industry the Asian pacific is the fastest-growing market while North America is the largest market.
- Around 1.5 trillion has been added to the United States of America’s GDP by core copyright industries.
- As of 2022, around 1.4 million Americans were employed in the media and entertainment industry.
- As of 2022, the music industry created a market size of $43 billion.
- In the United States of America, as of 2022, the book publishing industry is sized at $26.8 billion.
- 82% of the traffic on the internet belongs to video streaming accounts as of 2022.
- On average a resident in America uses more than 2 OTT platforms for entertainment purposes.
Global Media and Entertainment Industry Statistics
By Spending
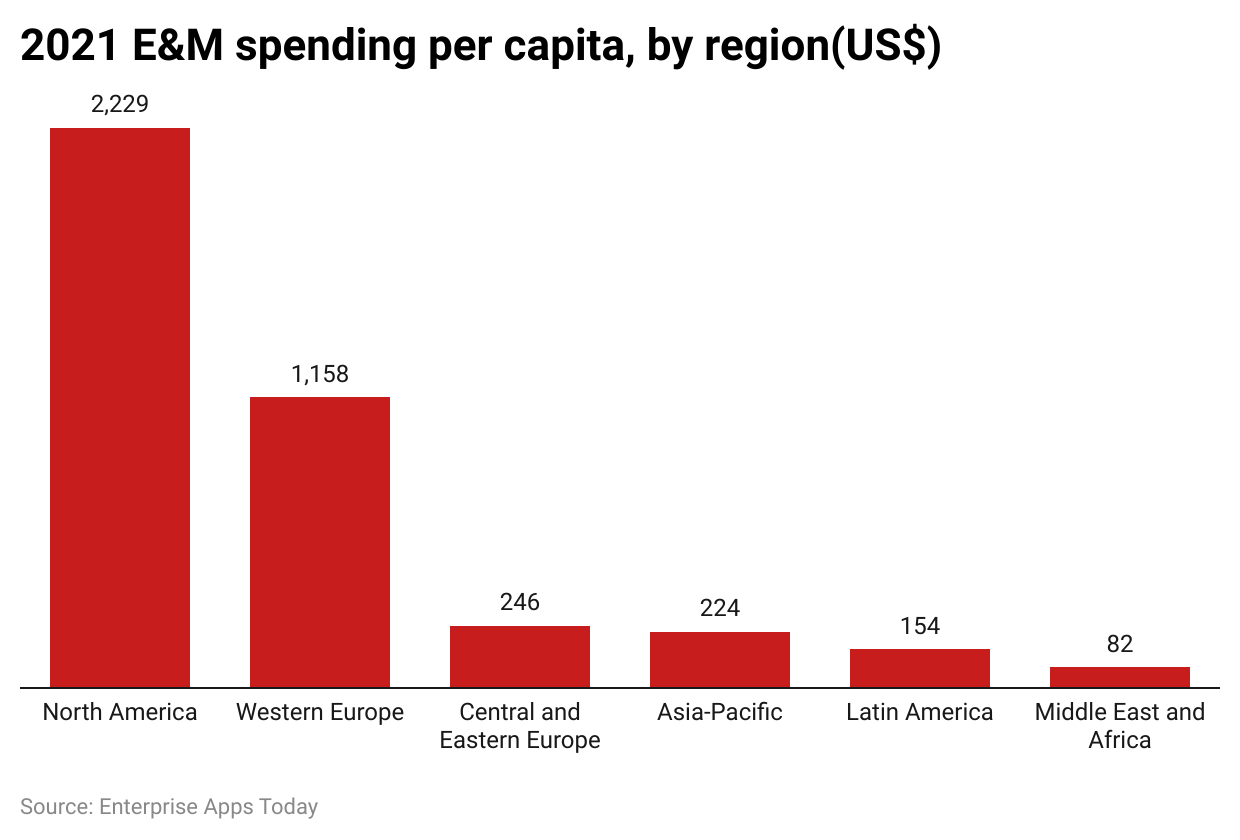 (Source: PWC)
- As of 2021, media and entertainment industry statistics say that the spending per capita on the segment in North America was the highest resulting in $2,229.
- Followed by Western Europe it was $1,158 and central and eastern Europe contributed around $246.
- Asia Pacific and Latin America contributed to the per capita spending on media and entertainment around $224 and $154 respectively.
- While the Middle East and Africa recorded the spending per capita by $82.
By Market Value
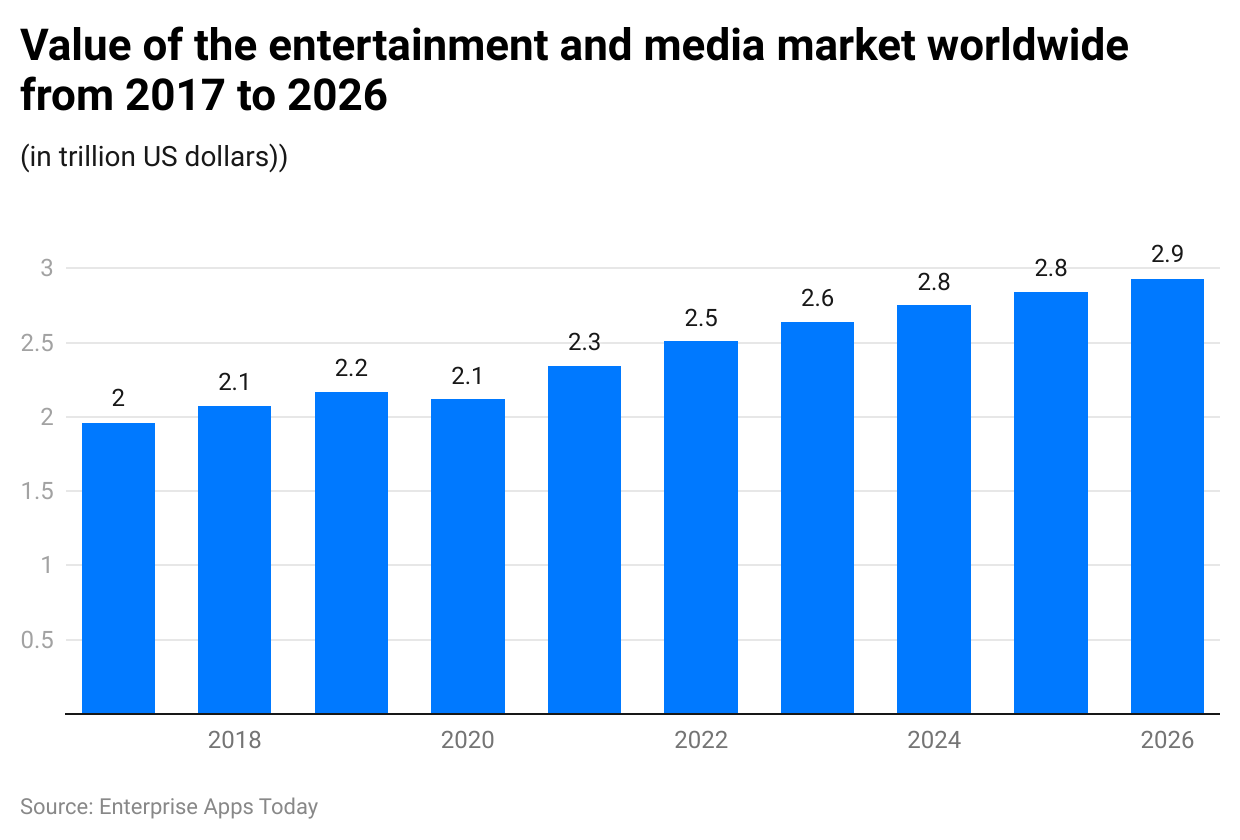 (Source: Statista)
- The last 5 years’ analysis of media and entertainment industry statistics show that the value of the segment in the years 2017, 2018,2019,2020, and 2021 was $1.96 trillion, $2.07 trillion, $2.17 trillion, $2.12 trillion, and $2.34 trillion respectively.
- As of 2022, the market value of media and entertainment was $2.51 trillion.
- In the year the industry is expected to value at $2.64 trillion around the globe.
- While the forecast says that, in the coming years the industry will be valued at $2.75 trillion, $2.84 trillion, and $2.93 trillion respectively.
By Region
- The global revenue of the entertainment segment was expected to reach $29.35 billion as of 2022.
- By the year 2026 global media and entertainment industry will generate a total revenue by CAGR of 7.41% resulting in $40.74 billion.
- As of 2022, the projected in-app purchase revenue for the entertainment segment was $1.59 billion.
-Asia
- Chinese market generated the highest revenue in the global comparison resulting in $13,930 million in the year 2022.
- As of 2022, the expected total revenue in the Asian media and entertainment industry was $18.14 billion.
- By the year 2026, the total revenue is expected to grow at a CAGR of 7.55% reaching $25.18 billion.
- As of 2022, the advertising revenue in the entertainment category was projected at $11.48 billion.
-Europe
- By the year 2026, the total revenue of the media and entertainment industry is expected to reach $3.59 billion at a CAGR of 8%.
- In the year 2022, it was expected that the average downloads on the internet in the entertainment category were 1,326.7 million.
- In the year 2023, the average revenue for every download is expected at $1.78.
-Africa
- Media and entertainment industry statistics say that the overall revenue in the African market is expected to grow at 7% resulting in $43.83 million by the year 2026.
- As of 2023, the average revenue for every download is expected to reach $0.42.
- The revenue generated in the paid app in the entertainment category was expected to reach $0.51 million in the year 2022.
- The overall in-app purchase revenue in the similar category was projected at $11.3 million in the year 2022.
-Americas
- As of 2022, the total revenue in the entertainment and media industry was projected at $8.37 billion.
- The in-app purchase revenue in the category of entertainment in the year 2022 was projected at $2,951 million.
- As of 2023, the average revenue for every download is expected to result in $3.42.
- The number of downloads in the online entertainment category of various platforms was expected to reach 2,445.8 million in the year 2022.
By Revenue (5-year analysis)
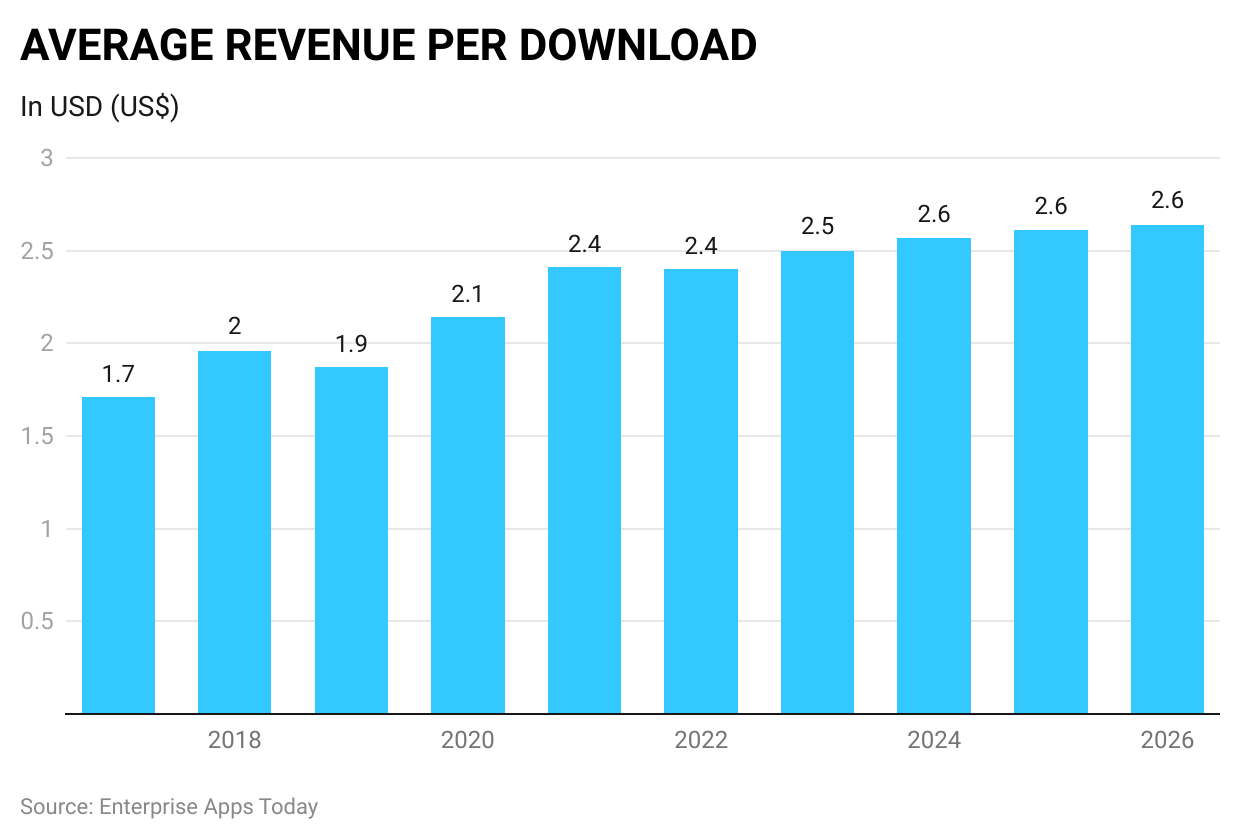 (Source: Statista)
- Around the world, considering the various media and entertainment applications, as of 2017 to 2021 the statistics show that, the average revenue per download generated respectively was $1.71, $1.96, $1.87, $2.14, and $2.41.
- As of 2022, the average revenue per download was $2.40. And in the year 2023, it is expected that the amount will rise to $2.50.
- In the coming years of 2024, 2025, and 2026 the expected average revenue per download is $2.57, $2.61, and $2.64 respectively.
 (Source: PWC)
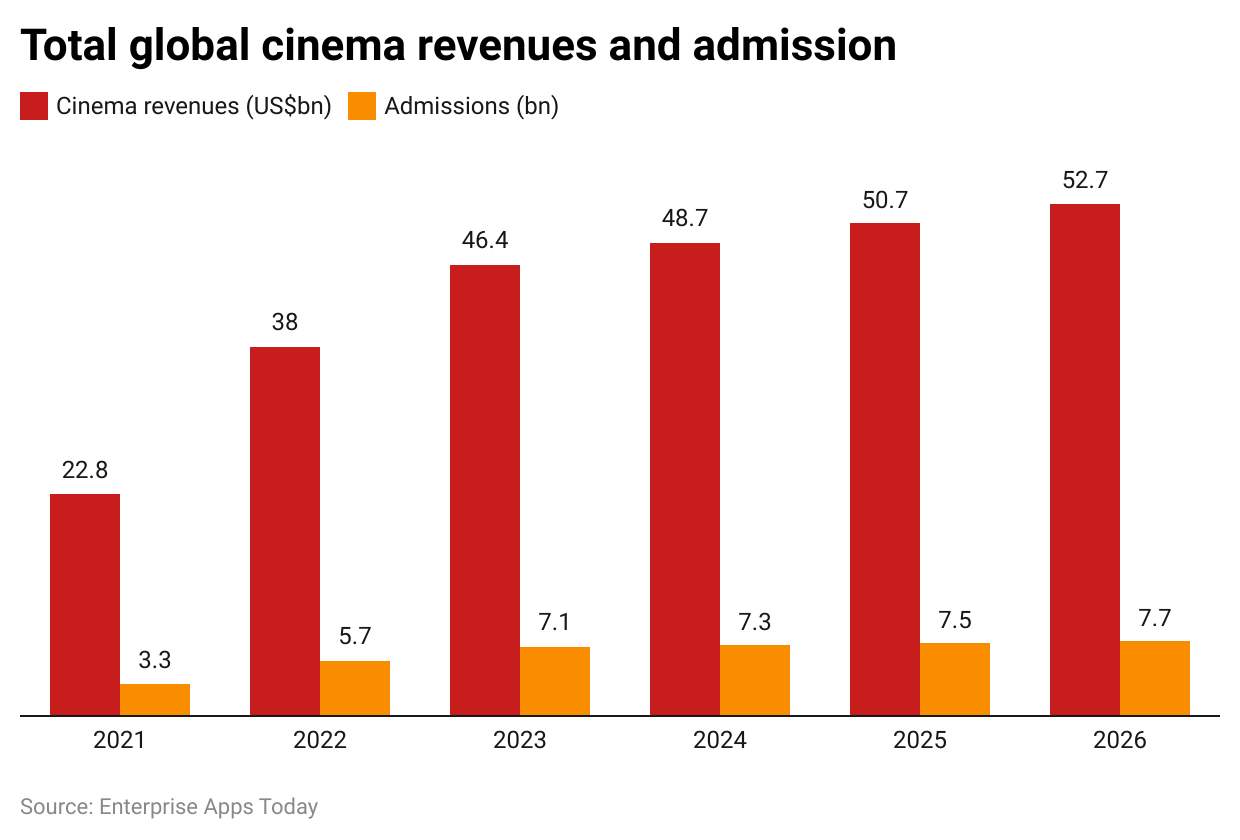
- In the year 2021, the media and entertainment industry statistics say that the global cinema revenue was 22.8 billion while the overall admission in the industry was 1.9 billion.
- The year 2022, recorded global cinema revenues of 38 billion while 5.7 billion were admissions.
- It is expected that in the year 2023, the cinema revenues will be resulting in $46.4 billion while having 5.7 billion in admissions.
- In the coming years, the projected respective revenues and admission will be 2024 ($48.7 billion:$7.3 billion), 2025 ($50.7 billion: $7.5 billion ), and 2026 ($52.7 billion: $7.7 billion).
By Segment
 (Source: PWC)
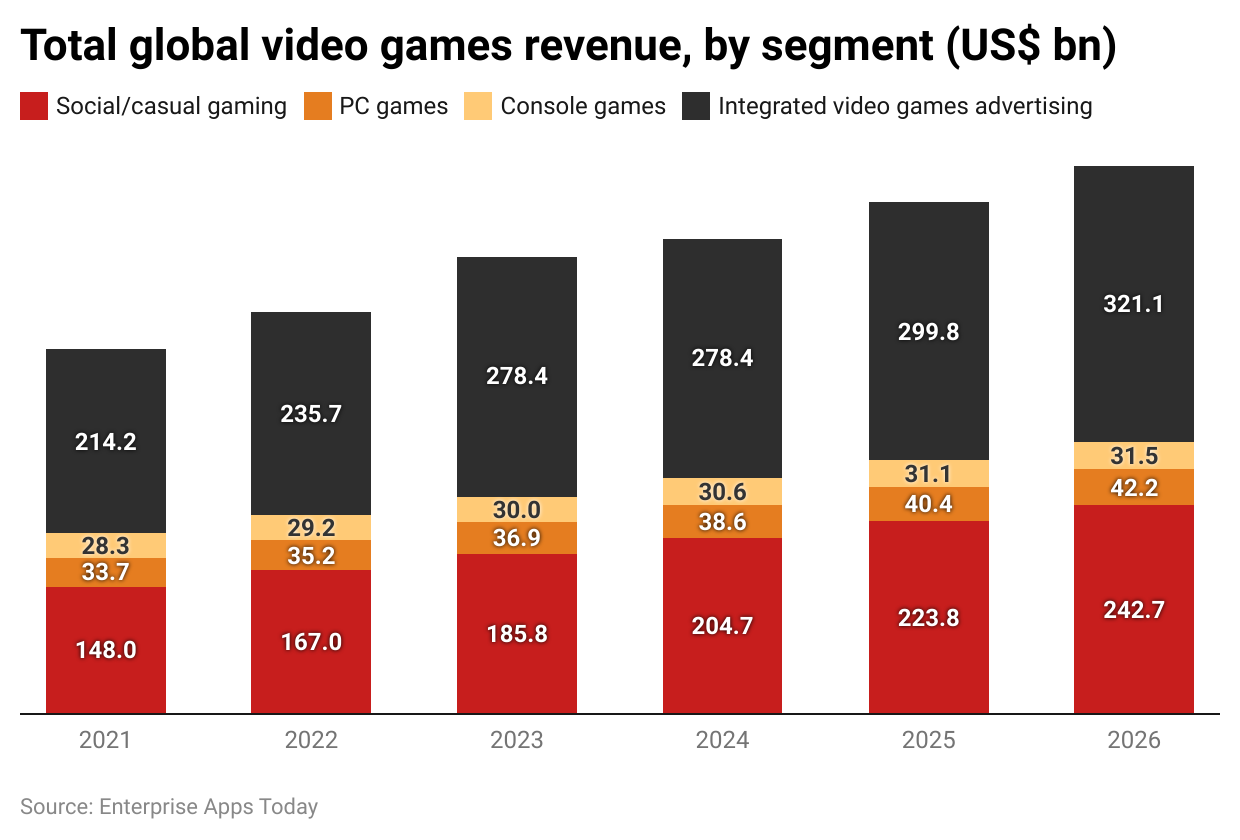
- As of 2021, media and entertainment industry statistics say that the social/casual gaming segment in video games generated overall revenue of $148 billion. While $33.7 billion and $28.3 billion were captured by PC and console games respectively.
- The highest revenue as of 2021 belonged to integrated video gaming advertising resulting in $214.2 billion.
- Similarly, in the year 2022, integrated video game advertising generated around $235.7 billion of revenue while $29.2 billion and 35.2 billion were generated by console and PC games respectively.
- $167 billion were captured by social and social and casual gaming sector.
- In the coming years, the forecast for the various sectors in global video games revenue is 2023: Social/ casual gaming ($185.8 billion), PC games ($36.9 billion), Console games ($30 billion), and integrated video games advertising ($257.1 billion)
- 2024: Integrated video games advertising ($278.4 billion), console games ($30.6 billion), PC games ($38.6 billion), and social/casual gaming ($204.7 billion).
- 2025: Social/ casual gaming ($223.8 billion), PC Games ($40.4 billion), Console games ($31.1 billion), and integrated video games advertising ($299.9 billion).
- 2026: Social/ casual gaming ($242.7 billion), PC games ($42.2 billion), Console games ($42.2 billion), and integrated video game advertising ($321.1 billion).
By Daily App Usage
(Source: Statista)
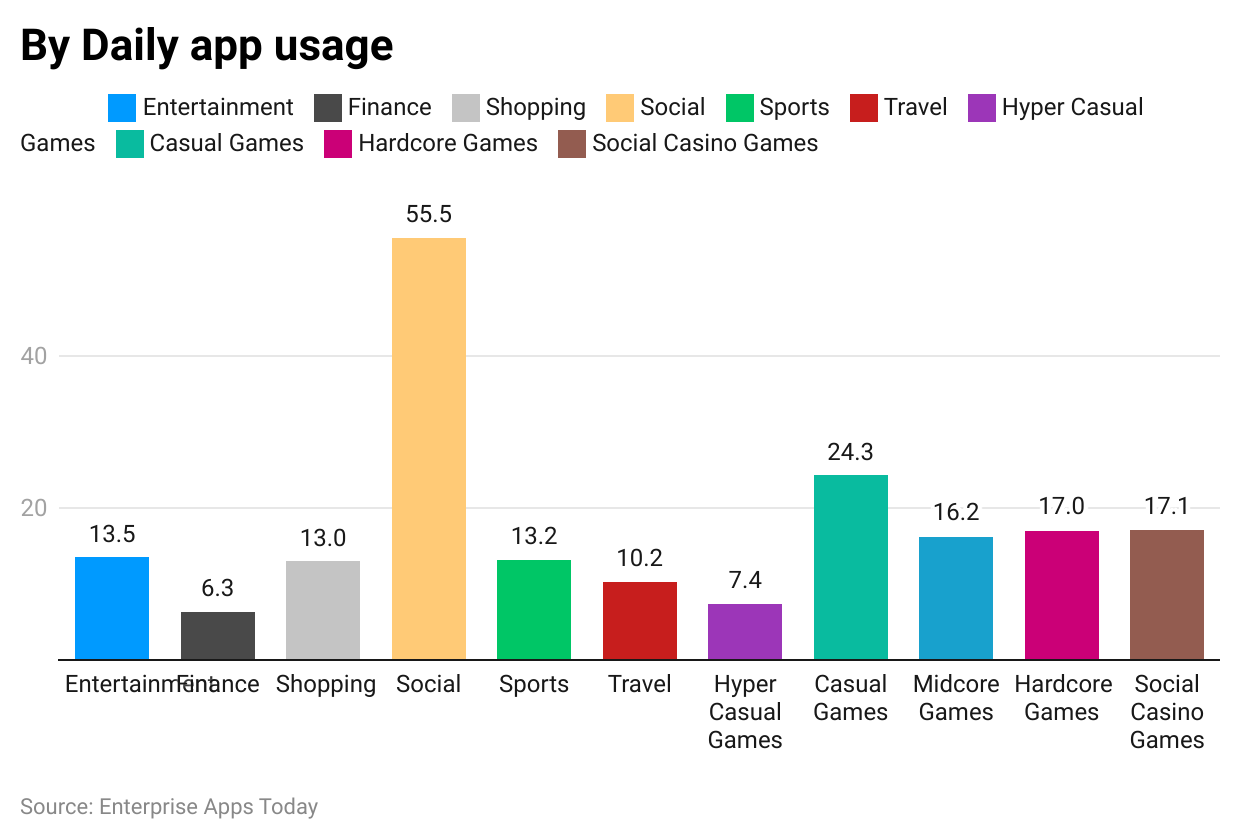
- As of 2021, various types of media and entertainment apps received various minutes spent on applications around the world.
- Around the world, the highest daily minutes were spent on social media apps resulting in 55.5 minutes.
- The above list is followed by playing causal games and social casual games resulting in 24.3 minutes and 17.1 minutes respectively daily.
- Other applications in various categories recorded the following minutes of daily usage; entertainment (13.5), Sports(13.2), Midcore games (16.2), Finance (6.3), Travel (10.2), hardcore games (17), shopping (13), and hyper-casual games (7.4).
By Popularity
 (Source: Statista)
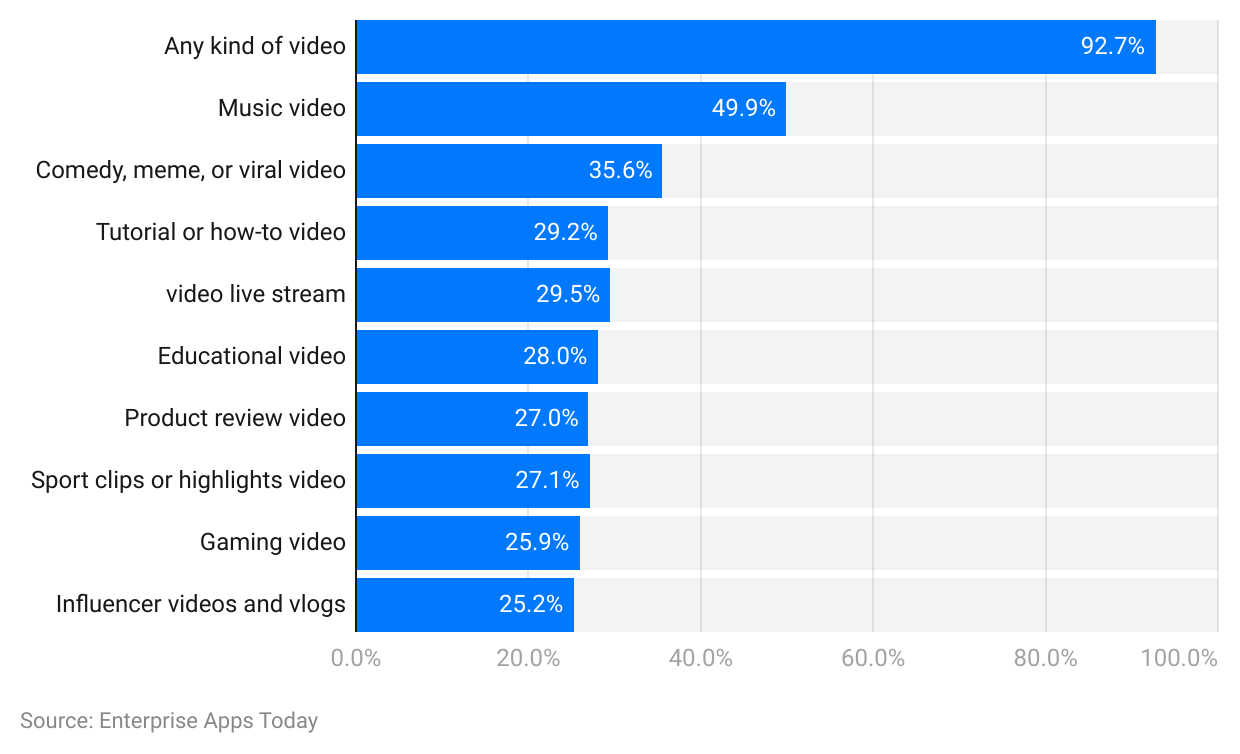
- As of the second quarter of 2022, the most popular video content overall reach around the globe is 92.7%
- Further segmented by media and entertainment industry statistics is music video 49.9%.
- 6% of the reach is captured by comedy, memes, or viral videos.
- Tutorial or how-to videos reached around 29.2% in the year 2022, while 29.5% were live-streaming videos.
- Other content videos received reach over the world with the following share educational videos (28%), product review videos (27%), Sports clips or highlights videos (27.1%), gaming videos (25.9%), and influencer videos and vlogs (25.2%).
By Platforms
- According to the media and entertainment industry, Netflix is the leading OTT platform as of 2022 with 225 million users around the globe.
- Roblox ranked the number 1 PC game by having 230 million users.
- As of 2022, ESPN News networks ranked top by having 1.9 million viewers in primetime.
- In the year 2022, Garena Free Fire received the highest number of downloads in the mobile gaming category resulting in global 21.8 million global downloads.
- Similarly, in Q3 of 2022, BBC radio top player in the market having 14.5 million weekly users.
- The guardian ranked top in the most-read newspapers as of 2022 while having 35 million readers in the year 2022.
- On a similar note, in the entertainment segment, Facebook topped the list by having 2.934 billion active users in the year 2022.
- Top Gun: Maverick was the grossing film in cinemas as of 2022 earning $718 million in revenue.
Media and Entertainment Industry Statistics By Demographics
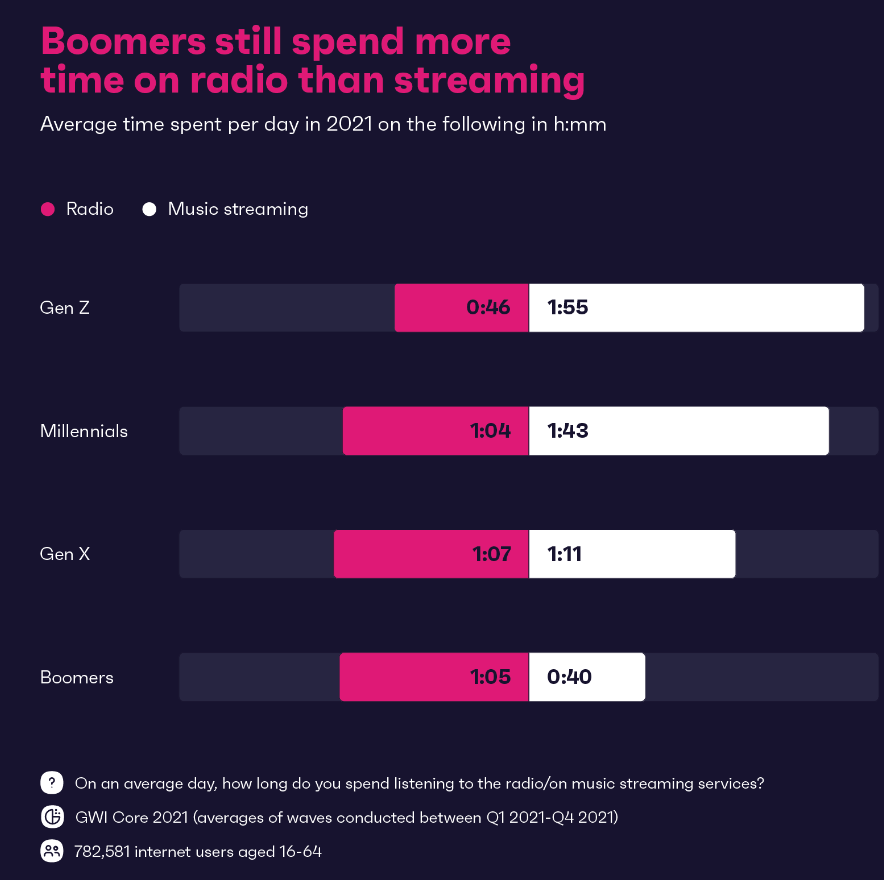 (Source: gwi.)
- According to media and entertainment industry statistics, as of 2021, users from Gen Z listened to the radio for at least 46 minutes every day while 1 hour and 55 minutes were spent listening to music.
- Similarly, 1 hour and 4 minutes and 1 hour and 7 minutes were spent on radio listening by millennials and Gen X respectively.
- And, 1 hour and 43 minutes and 1 hour and 11 minutes were spent listening to music every day.
- Users from baby boomers choose to listen to the radio more than music comparing the ratio of 1 hour and 5 minutes to only 40 minutes.
 (Source: Deloitte)
United States of America
- In the United States of America, there are 96% of users from Gen Z and millennials play video games 11 hours and 13 hours each week respectively.
- Similarly, as stated by the media and entertainment industry statistics, there are 89% of the players from Gen X, play 10 hours every week. While 57% of the players from baby boomers prefer to play video games for 6 hours every week.
United Kingdom
- United Kingdom has 98% and 95% of the players from Gen Z and millennials who play video games for 12 hours every week respectively.
- 80% of players play for 9 hours and 46% of the players play video games for 7 hours each week.
Germany
- As of March, respective 96% of the players from Gen Z and millennials played for 11 hours and 10 hours each week.
- 10 hours of gaming was spent by 82% of the Gen X people while 59% of the people played for 6 hours.
Brazil
- In Brazil as of 2022, 96% of the Gen Z players played for 12 hours every week while 93% of the millennials chose to play for 10 hours.
- 88% of the users from Gen X played for 9 hours every week and 77% of the baby boomers played 7 hours every week.
Japan
- In Japan, 39% of the baby boomers and 69% of the players from Gen X played video games for 5 and 8 hours respectively.
- While 84% of the millennials and 96% of Gen Z chose to play for 11 and 12 hours every week as of 2022.
Media and Entertainment Industry Statistics By Country
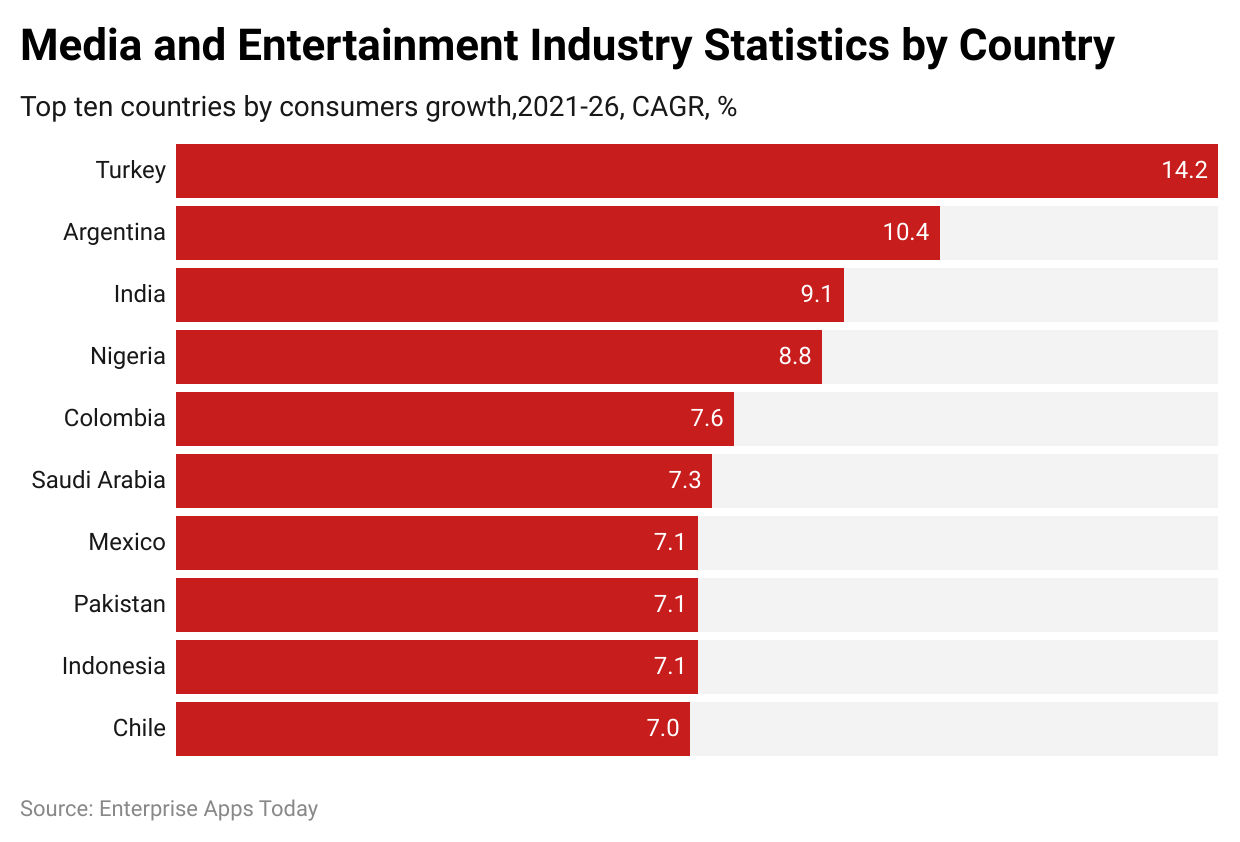 (Source: PWC)
- According to the media and entertainment industry statistics, consumer growth as of 2021 has increased over the past few years.
- Turkey a highest has a consumer growth rate by CAGR of 14.2%, while Argentina has a 10.4% growth rate.
- Other countries with an increasing consumer growth rate in the media and entertainment sector are India (9.1%), Nigeria (8.8%), Colombia (7.6%), Saudi Arabia (7.3%), Mexico, Pakistan and Indonesia (7.1), and Chile (7%).
Conclusion
As per the above media and entertainment industry statistics, the industry has already become a trillion-dollar industry a long time ago. Now a person not only sticks to watching movies as entertainment but has various opportunities in which he can enjoy his time. This industry will never die as in the future technological developments will help to strengthen the base.
Sources
FAQ.
You can pursue graduation in film, television, programming, content production, writing, and distribution majors to pursue a career in media and entertainment.
You can get a job as a copywriter, media researcher, writer, social media manager, broadcast journalist, advertising media buyer, etc
Netflix, Warner Bros, Sony Music, and Disney are some of the largest companies around the world in the media and entertainment segment.
In the coming years, looking at the demand and technological developments, the industry will have AR and VR segments to the overall segments.

Barry is a lover of everything technology. Figuring out how the software works and creating content to shed more light on the value it offers users is his favorite pastime. When not evaluating apps or programs, he's busy trying out new healthy recipes, doing yoga, meditating, or taking nature walks with his little one.