
Microsoft Teams Statistics – By Demographics, Country, Company Size, Reasons for Usage, Market Share, Sources of Traffic
Page Contents
- Introduction
- Editor’s Choice
- What is Microsoft Teams?
- Features of Microsoft Teams
- Types of Teams in Microsoft Teams
- General Microsoft Teams Statistics
- Microsoft Teams Statistics By Social Media Traffic
- Microsoft Teams Statistics By Sources of Traffic
- Microsoft Teams Statistics By Demographics
- Microsoft Teams Statistics By Brand Awareness
- Microsoft Teams Statistics By Country
- Microsoft Teams Statistics By Total Users
- Microsoft Teams Statistics By Company Size
- Microsoft Teams Statistics By Reasons for Usage
- Microsoft Teams Statistics By Market Share
- Microsoft Teams Statistics By The Total Number of Chats
- Microsoft Teams Statistics By The Total Number of Conversations
- Microsoft Teams Statistics By Device Traffic
- Conclusion
Introduction
Microsoft Teams Statistics: Keeping us connected is what makes us feel together. Be it remote work or working from home, we are still able to connect with our colleagues from offices. During the pandemic, many universities and schools offered live classes using Microsoft Teams. Even presentations in schools and offices were easily shared using share my screen with other meeting participants. Although Microsoft Teams has a go a long way in terms of market capture, it has many wonderful features which other similar applications don’t have yet.
We have gathered some interesting Microsoft Teams Statistics focusing on various companies and industries as well as its unique features
Editor’s Choice
- On average, on Microsoft Teams, a user spends around 4 minutes and 46 seconds.
- As of 2022, Microsoft Teams bagged the third rank for securing 111 million global downloads in the category of leading business apps worldwide.
- According to Microsoft Teams Statistics of demographics, the highest number of users belong to the age group of 35 to 44 years resulting in 31%.
- On the other hand, in the United States of America, Microsoft Teams ranked second for generating 25 million downloads in 2022 in the category of leading business apps in the USA.
- 43% of Americans can recognize the Microsoft Teams brand by its logo and written brand name.
- Information Technology Industry has the highest number of Microsoft Teams users resulting in 29.6%.
- Microsoft Teams offer direct connections to LinkedIn, which means if you hover over the name of the participant, you will come to know their LinkedIn profile.
- As of January 2023, teams.microsoft.com generated 230.1 million of global traffic while it was 203.9 million in February 2023.
- As of January 2023, the platform has 280 monthly active users globally.
- Microsoft Team Statistics state that every 60 seconds there are 300 conversations recorded, while in 60 minutes, the total number of conversations reaches 18,000.
What is Microsoft Teams?
Microsoft Teams is a platform of proprietary business communication owned by Microsoft. Some of the basic features include video conferencing, file storage, communication, and workspace. This messaging platform was launched in 2017 and is available in 48 languages. Moreover, it supports all types of operating systems such as Web, Windows, MacOS, iOS, and Android. The applications can be easily downloaded from either Playstore, Appstore, or their primary website www.microsoft.com. The web-based desktop app was developed by GitHub based on a rendering engine and Node.js JavaScript platform.
Features of Microsoft Teams
- Provide priority notification on the desktop.
- The platform has task management along with Microsoft Planner.
- It lets you host webinars and virtual conferences.
- Joining the meeting is easy by using Passcode and Meeting ID or simply by clicking on the link.
- Microsoft Teams offer direct connections to LinkedIn, which means if you hover over the name of the participant, you will come to know their LinkedIn profile.
- One of the best features of Microsoft Teams is Annotation.
- Speaker coach (support for the speaker in the meeting providing him/her feedback on hints).
- Offers integrations between Teams and Outlook.
- Allows you to make changes using Slash commands.
- Improved Security.
- Stores conversations unless the user deletes them.
- Team chats
- And collaboration with other Microsoft Teams applications.
- 91 out of 100 companies featured in Fortune use Microsoft Teams.
Types of Teams in Microsoft Teams
After you create a team, you are required to choose a team type such as Class, Professional Learning Community (PLC), Staff, and Other. Each has unique features as follows:
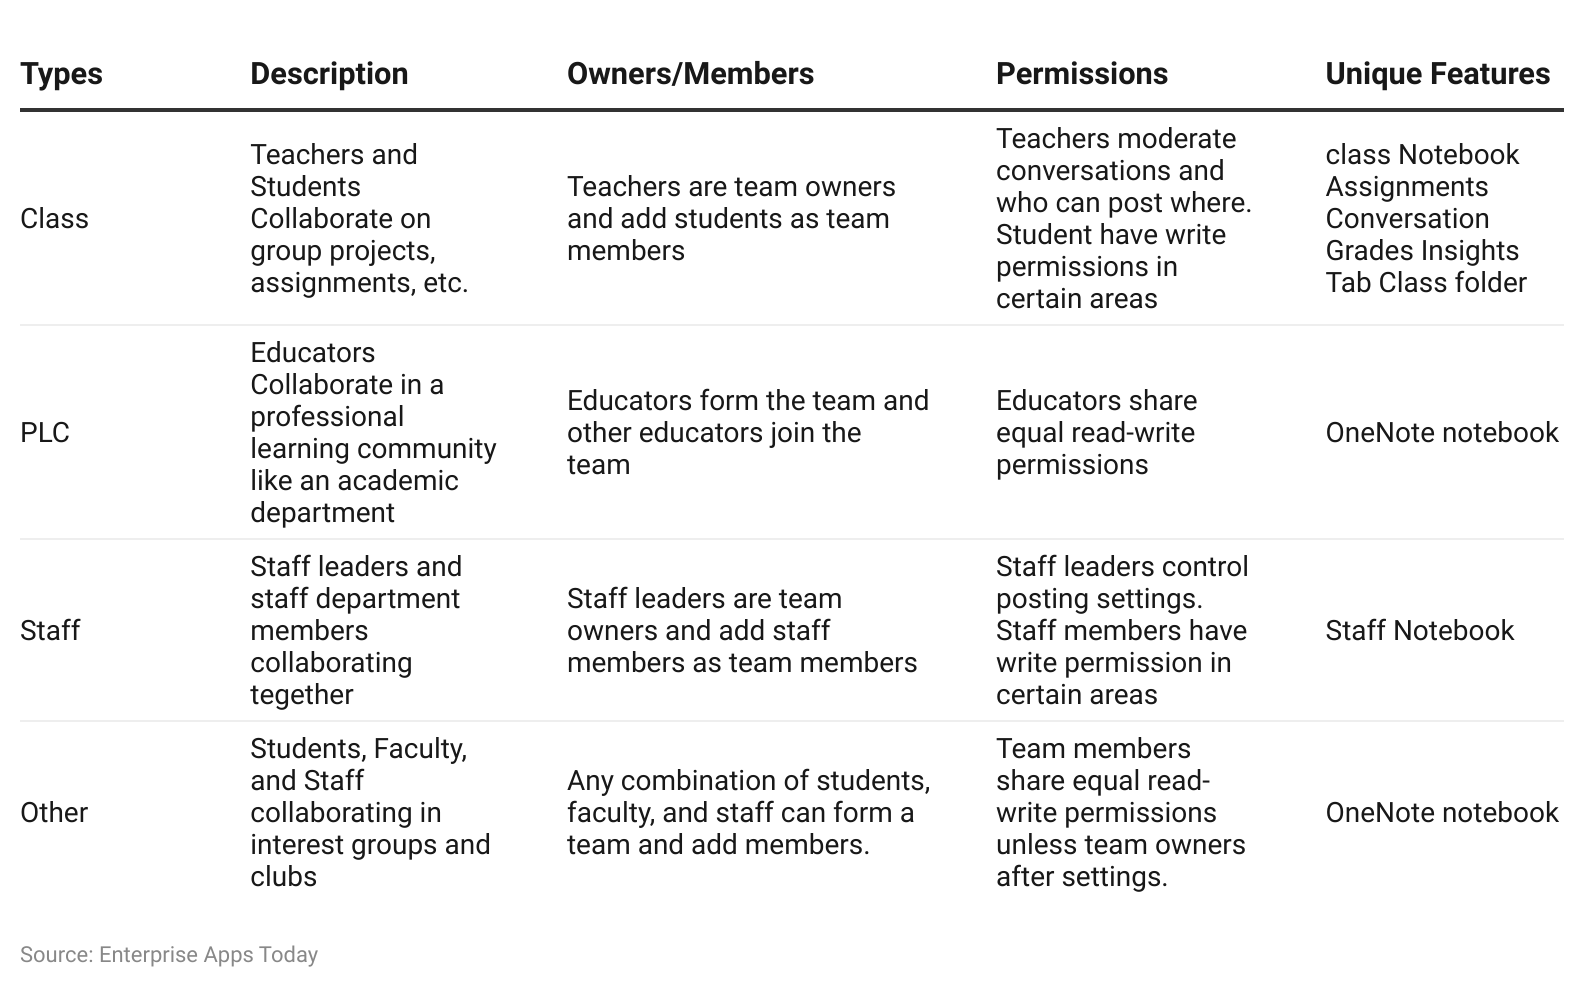
(Reference: inside.wooster.edu)
General Microsoft Teams Statistics
- As of 2022, Microsoft Teams bagged the third rank for securing 111 million global downloads in the category of leading business apps worldwide.
- On the other hand, in the United States of America, Microsoft Teams ranked second for generating 25 million downloads in 2022 in the category of leading business apps in the USA.
- Moreover, as of 2022, the platform generated the highest number of mobile application downloads resulting in 31 million globally.
- Microsoft Teams Statistics shows that as of January 2023, the platform has 280 monthly active users globally.
- On average, on Microsoft Teams, a user spends around 4 minutes and 46 seconds.
- Nowadays, users turning their video on during Microsoft team meetings has increased by 2x.
- As of January 2023, teams.microsoft.com generated 230.1 million of global traffic while it was 203.9 million in February 2023.
- Moreover, in March 2023, the website received 232.2 million global traffic with a change in total visitors by 13.95% compared to February 2023.
- In FY23, the number of active Teams Room devices increased to 500,000 with 70% of the year-over-year growth rate.
- The collaborations between Teams and other third-party applications along with 10,000 users increased at a 40% of year over year growth rate.
- Compared to previous years, users with 1,000 rooms increase by 2X.
- Moreover, Microsoft Teams Statistics state that around 5 million PSTN seats got added to Teams Phone.
- As of today, Microsoft Teams has preferred more than 1 million businesses spread around the globe.
- An ongoing Teams meeting has the capacity to run continuously for at least 30 hours.
Microsoft Teams Statistics By Social Media Traffic
- Considering the total traffic sent by any social media network, Facebook has a high referral rate of 35.26% whereas YouTube has 18.66%.
- Facebook Messenger sends total traffic at 11.88%.
- WhatsApp and LinkedIn have a referral rate of 9.38% and 8.28% respectively.
- Other social media networks collectively make up 16.55% of referral traffic.
Microsoft Teams Statistics By Sources of Traffic
- teams.microsoft.com generates 79.84% of direct traffic, while 8.85% is referral traffic.
- Moreover, the platform has 8.80% of organic traffic and only 0.01% of paid search traffic.
- Other sources of traffic include traffic sent by social media networks (0.76%), Mail (1.67%), and Display (0.07%).
Microsoft Teams Statistics By Demographics
- There are 25% of female and 75% of male Microsoft Teams users globally.
By age
| Age | Percentage |
|---|---|
| 18-24 | 4% |
| 25-34 | 14% |
| 35-44 | 31% |
| 45-54 | 29% |
| 55+ | 20% |
(Source: usesignhouse.com)
- According to Microsoft Teams Statistics of demographics, the highest number of users belong to the age group of 35 to 44 years resulting in 31%.
- Whereas there are 4% of users between 18 to 24 years of age, while 14% belong to the 25 to 34 years of age group.
- There are 29% and 20% of the respective users from the age groups of 45 to 54 years and 55 years and above.
Microsoft Teams Statistics By Brand Awareness
- 43% of Americans can recognize the Microsoft Teams brand by its logo and written brand name.
- Out of 43% of Microsoft Teams users, 30% of them like the brand.
- 26% of Americans use this messaging platform regularly.
- Whereas 9% of the users in the United States of America said, they are likely to use this platform again.
- As of July 2022, 23% of the users of Microsoft Teams heard about the platform on social media, and other in other types of advertisements in the past three months.
Microsoft Teams Statistics By Country
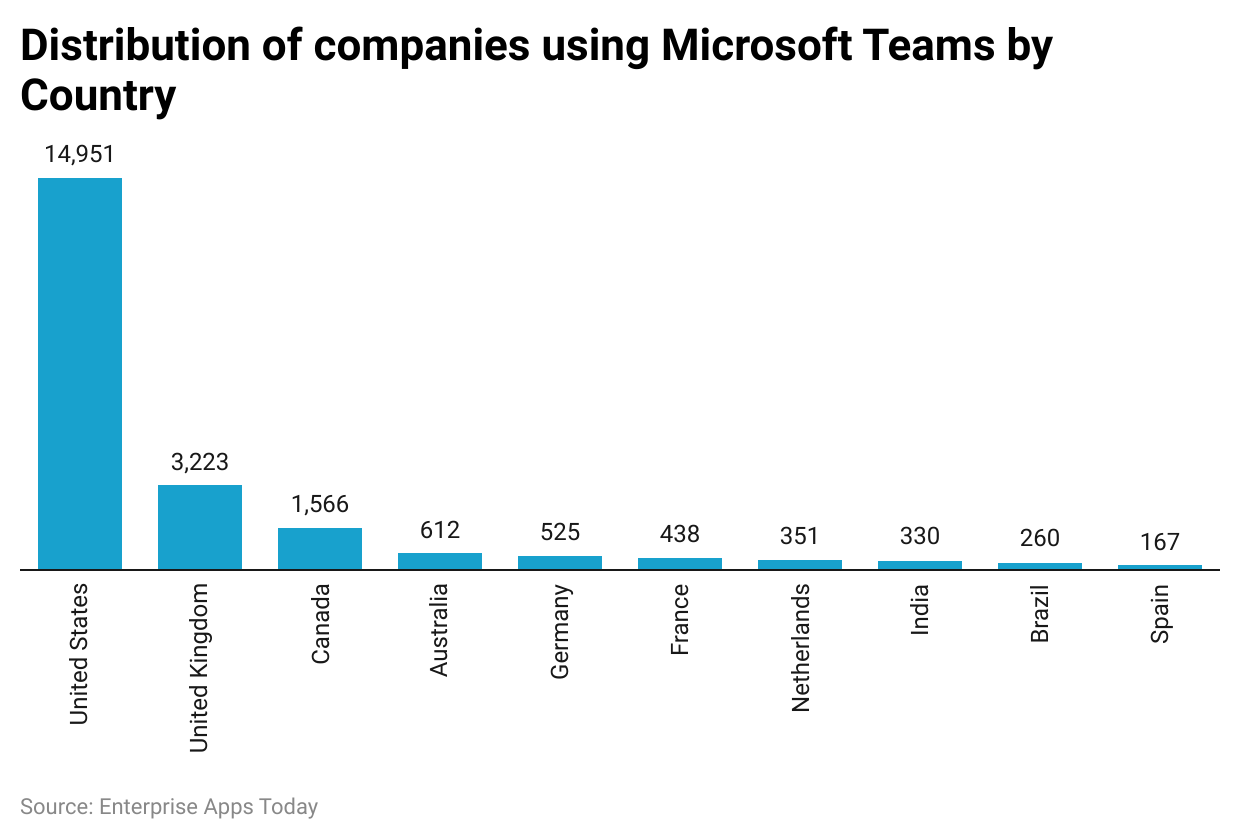
(Reference: enlyft.com)
- In the United States of America, there is the highest number of companies using Microsoft Teams resulting in 14,951.
- While other ranked countries in the United Kingdom and Canada have respective 3223 and 1,566 companies using similar messaging platforms.
- The count of total companies using Microsoft Teams in other countries is comparatively extremely low such as Australia (612), Germany (525), France (438), Netherlands (351), India (330), Brazil (260), and Spain (167).
By Contribution of Total Users
| Country | Percentage |
|---|---|
| United States | 17.85% |
| United Kingdom | 6.46% |
| India | 5.77% |
| Japan | 5.40% |
| Brazil | 4.69% |
| Other | 59.84% |
(Source: usesignhouse.com)
- In the United States of America, the total number of users contributes by 17.85% followed by the United Kingdom (6.46%) and India (5.77%).
- Japan and Brazil contribute by 5.40% and 4.69% respectively.
- Whereas other countries collectively make up around 59.84% of total users.
By Total Traffic
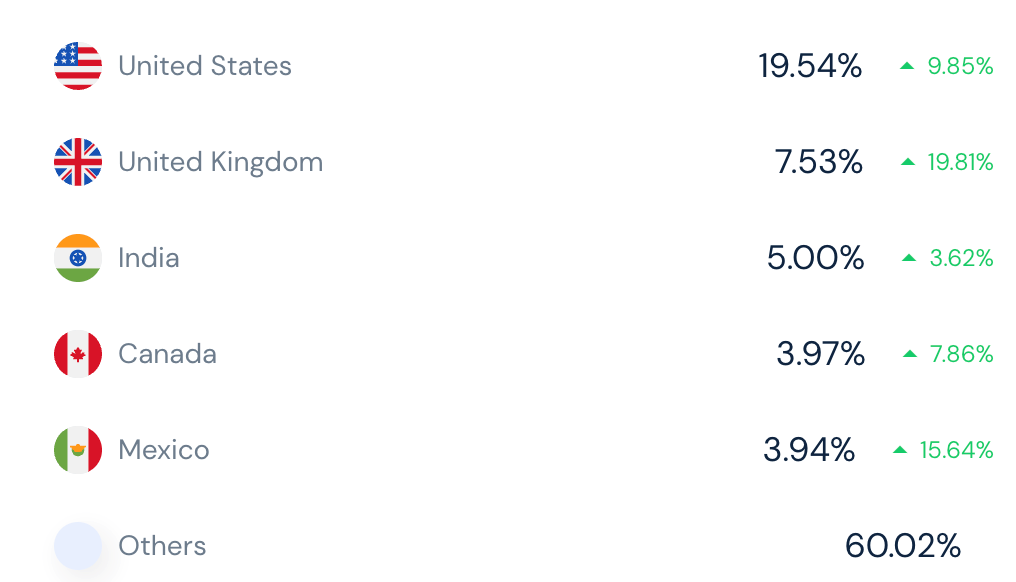
(Source: similarweb.com)
- Over the last 6 months, the United States of America has the highest share in total traffic towards Microsoft teams resulting in 19.54% with an increased rate of visitors by 9.85%.
- The United Kingdom and India contributed by 7.53% and 5% respectively with an increased rate of website traffic of 19.81% and 3.62%.
- With minor differences, Canada and Mexico have shown 3.97% and 3.94% of total traffic with respectively increased rates in website traffic by 7.86% and 15.64%.
- On the other hand, other countries collectively make up 60.02% of overall traffic toward Microsoft Teams.
Microsoft Teams Statistics By Total Users
By Total Number of Companies
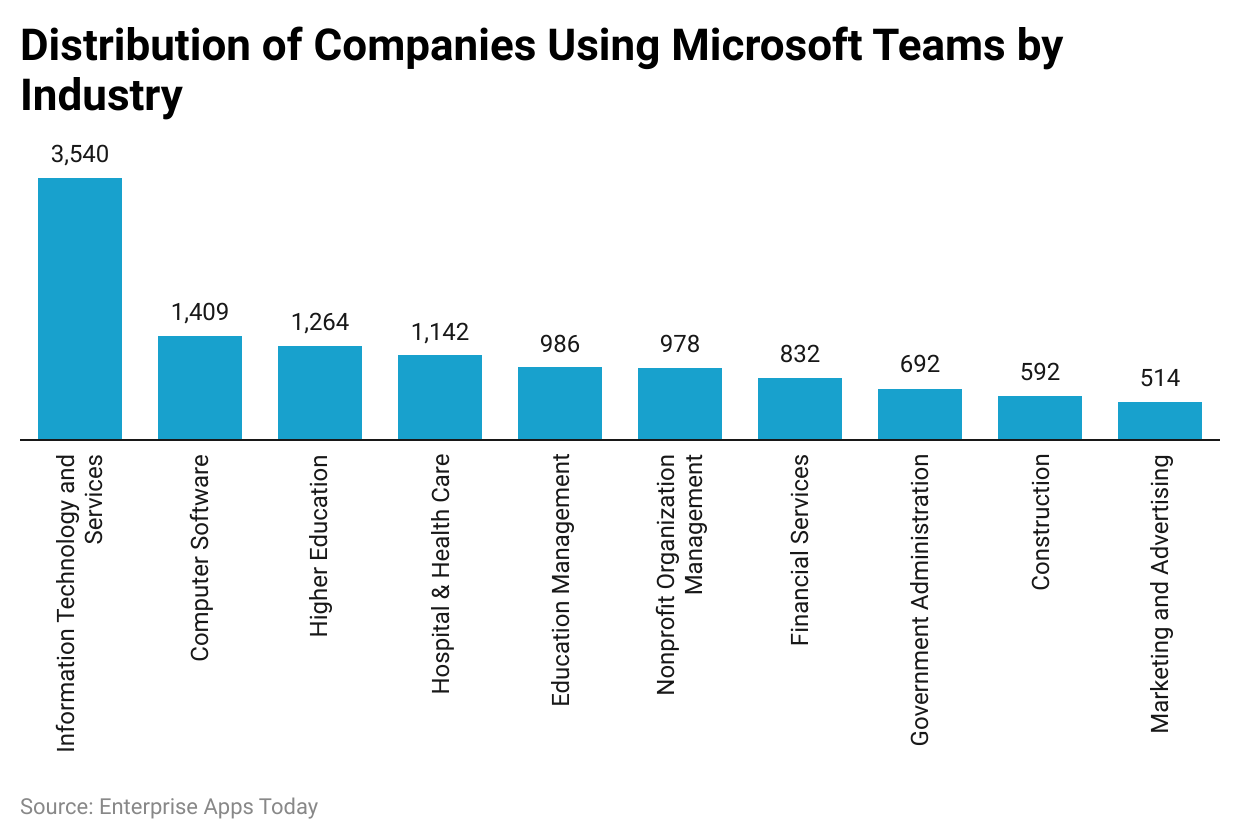
(Reference: enlyft.com)
- The highest number of Microsoft Teams users are from Information Technology and Services 3,540 while computer Software and Higher Education have 1,409 and 1,264 companies using a similar messaging platform.
- Other companies contributing to Microsoft Teams usage reports are Hospital and Health Care (1,142), Education Management (986), Non-Profit Organization Management (978), Financial Services (832), Government Administration (692), Construction (592) and Marketing and advertising (514).
By Industries
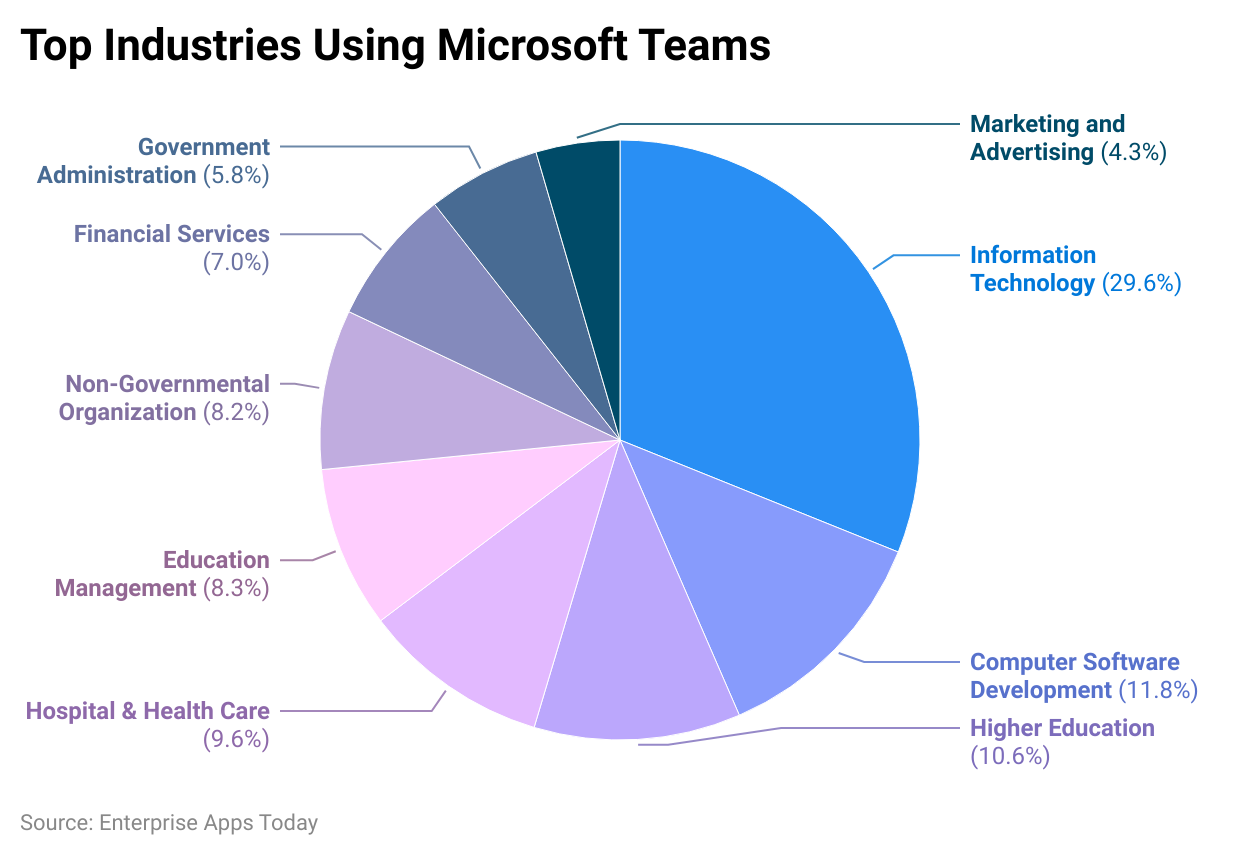
(Reference: usesignhouse.com)
- Information Technology Industry has the highest number of Microsoft Teams users resulting in 29.6%.
- The Computer Software Development industry and the Higher Education industry contribute to the top industries using Microsoft Teams by 11.8% and 10.6% respectively.
- Other industries in top Industries using Microsoft Teams include -Hospitals and Health Care (9.6%), Education Management (8.3%), Non-Governmental Organizations (8.2%), Financial Services (7%), Government administration (5.8%), and Marketing and Advertising (4.3%).
Microsoft Teams Statistics By Company Size
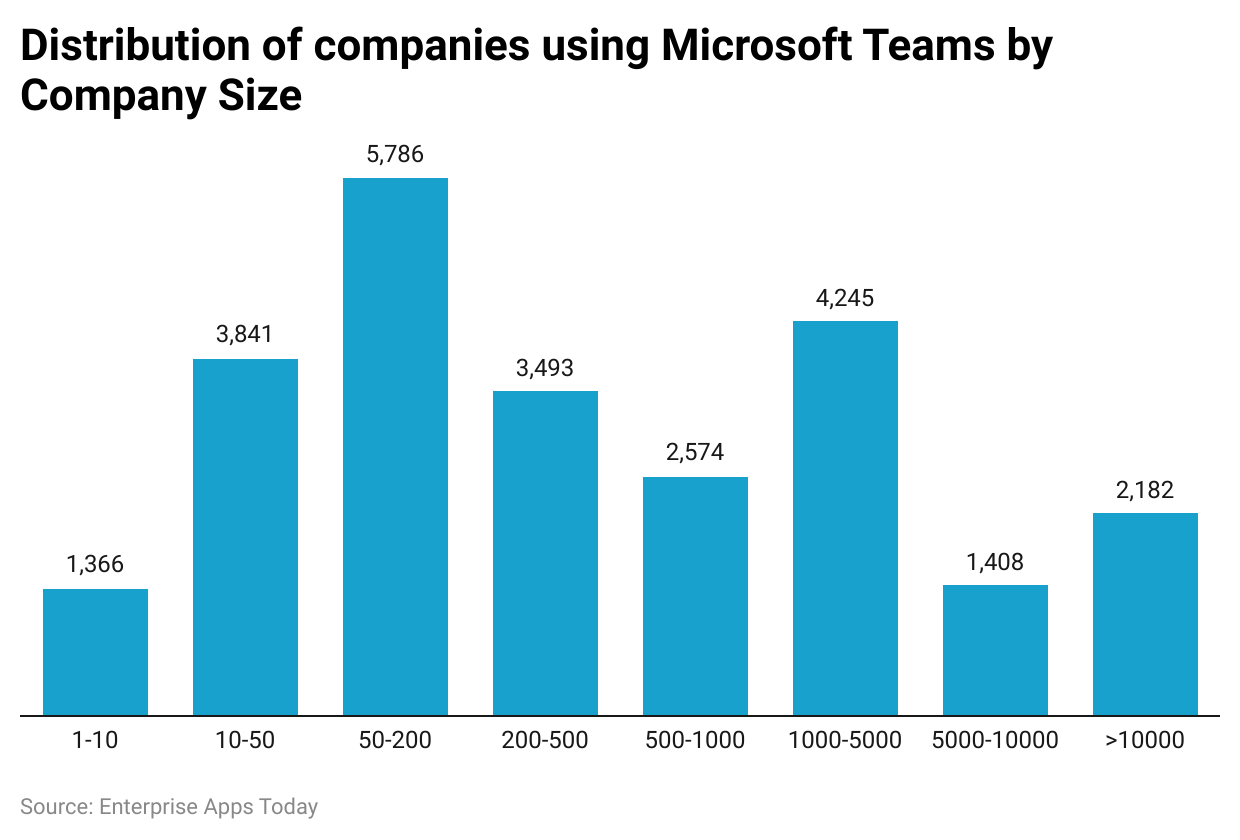
(Reference: enlyft.com)
- Observations made by Microsoft Teams Statistics are, the company with a 50 to 200 headcount has the highest number of usage reports resulting in 5,786 total companies.
- The lowest number of users reported has been observed by the company with a 1 to 10 headcount resulting in 1,366.
- Other total numbers of companies with a similar number of employees using Microsoft Teams are 10 to 50 (3,841), 200 to 500 (3,493), 500 to 1000 (2,574), 1000 to 5000 (4,245), 5000 to 10000 (1,408) and more than 10000 (2,182).
Microsoft Teams Statistics By Reasons for Usage
| Category | Share of Respondents |
|---|---|
| Productivity | 21.50% |
| Communication | 11.80% |
| Business | 10.90% |
| Tools | 9.00% |
(Source: demandsage.com)
- The highest number of users state that they use Microsoft Teams for Productivity resulting in 21.50%.
- Whereas 11.80% utilize it for communication purposes.
- 90% of the users use it for business purposes and 9% of the people use this messaging platform as a tool.
| Collaborative Software | Market Share |
|---|---|
| Microsoft Teams | 5.57% |
| Microsoft SharePoint | 24.86% |
| Slack | 17.49% |
| Workplace by Facebook | 7.47% |
| Others | 44.61% |
(Source: demandsage.com)
- Microsoft Team Statistics state that it has only captured 5.57% of the market share and has a long way to go.
- Other apps in the market such as Microsoft SharePoint has 24.86% of the market share, while Slack has 17.49%.
- Workplace by Facebook and other similar applications in the market have captured market share by 7.47% and 44.61% respectively.
Microsoft Teams Statistics By The Total Number of Chats
| Period | Number of Chats |
|---|---|
| In a 1 minute | 1,200 |
| In a 1 Hour | 72,000 |
| In one Day | 1,728,00 |
| In one Month | 51,840,000 |
| In a one year | 6.22 billion |
(Source: demandsage.com)
- In 60 seconds, Microsoft teams record 1,200 chats on average, while in 60 minutes it reaches 72,000 chats.
- On the other hand, 1,728,000 chats are generated in a span of 24 hours.
- Whereas this messaging platform reaches 51,840,000 and 6.2 billion chats in 30 days and in one year respectively.
Microsoft Teams Statistics By The Total Number of Conversations
| Period | Number of Conversation |
|---|---|
| In a 1 minute | 300 |
| In a 1 Hour | 18,000 |
| In one Day | 432,000 |
| In one Month | 12,960,000 |
| In a one year | 155,520,000 |
(Source: demandsage.com)
- Microsoft Team Statistics state that every 60 seconds there are 300 conversations recorded, while in 60 minutes, the total number of conversations reaches 18,000.
- In a span of 24 hours, the recorded total number of conversations is 432,000.
- Furthermore, total conversations generated on the platform are- in one month (12,960,000) and 365 days (155,520,000).
Microsoft Teams Statistics By Device Traffic
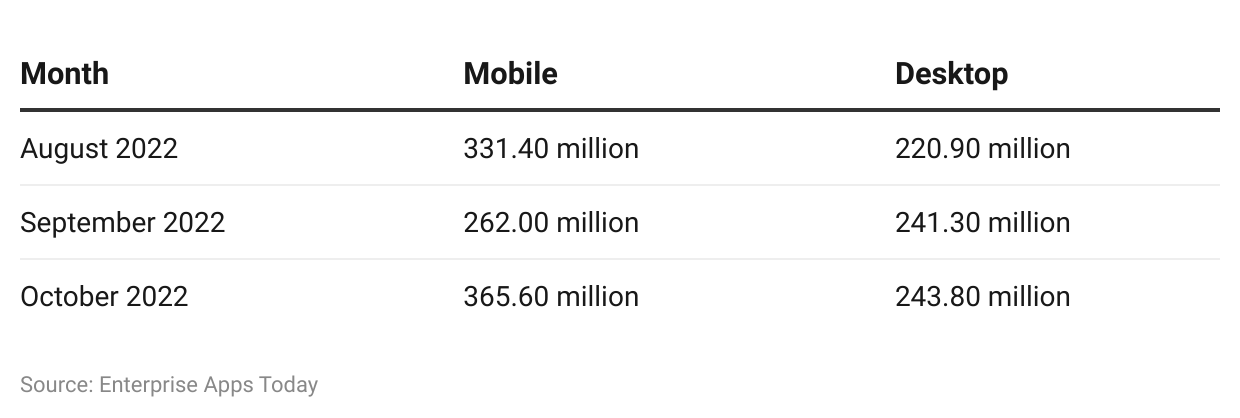
- Additional Microsoft Teams Statistics state the overall device traffic, in August 2022 was 331.40 million for mobile traffic and 220.90 million for desktop traffic.
- Whereas it was 262.00 million and 241.30 million mobile and desktop traffic in September 2022.
- And October 2022 recorded 365.60 million mobile and 243.80 million desktop traffic respectively.
Conclusion
While we work remotely today, we are connected due to technology with each other. Irrespective of the employee's location, employers can arrange a video conference within minutes. When everyone was locked inside their houses during COVID-19, schools, and universities didn’t let slip any single day without conducting live lectures. Just because of these, a positive change in exam pattern occurred that allowed students to submit assignments rather than give live exams. All things apart, looking at Microsoft Teams Statistics, the app has yet a long way to go compared to other similar applications in the market.
Sources
FAQ.
A user can create up to 250 Microsoft Teams.
The maximum number of allowed participants in a private chat is 2502.
While emailing a channel users can send 20 files at a time with the size of each file allowed less than 10 MB.
A 365 Microsoft group that can be converted to a team allows 10,0006 maximum members.

Barry is a lover of everything technology. Figuring out how the software works and creating content to shed more light on the value it offers users is his favorite pastime. When not evaluating apps or programs, he's busy trying out new healthy recipes, doing yoga, meditating, or taking nature walks with his little one.