
Soft Drink Sales Statistics 2023 Facts, Trend and Demand Analysis
Page Contents
Soft drink Sales statistics: This report shall present you with numbers researched using some tools to give you an insight into today’s soft drink sales statistics. Today, soft drinks are consumed by the majority of people. Be it at a party, office function, restaurant visit with friends or family, or just a stay-at-home day.
Soft drinks are mostly made with water and add some flavor with artificial sugar or natural sugar. Soft drinks are consumed worldwide with an increase in the rate of consumption day by day.
Editor’s Choice
- As of 2023, the revenue of the soft drinks industry is expected to reach by $0.85 trillion which has increased by 11.8% from last year.
- In 2023, global revenue earned by carbonated soft drinks and non-carbonated industry is expected to be $372.10 billion and $289.10 billion.
- Starting from 2023 to 2027 the annual market segment is going to reach 4.15% of CAGR.
- In 2023, per person revenue generated by the soft drinks segment is $111.10.
- In the same year, the soft drinks segment's average volume per person is expected to be 42.91 liters by the end of 2023.
- Whereas, in the United States revenue generated by the segment is expected to be $328.10 billion by 2023.
- By the end of 2027, the out-of-house consumption (in restaurants and bars) of soft drink segments volume is 13% and total spending resulted in 44%.
- On the other hand, by 2027 the volume of this segment is expected to be 348.20 billion litters and volume growth is going to increase by 2% by the end of 2024.
Current Trend
After the pandemic days, people became more curious about health. Therefore, they turned their preferences to more healthy products like fruit and organic juices. The demand for healthy drinks even increased when different flavors were introduced into the market. Apart from this, the following chart shows you the current trend of which drink is preferred by the consumers over the others, as per the data received from Brandirectory.
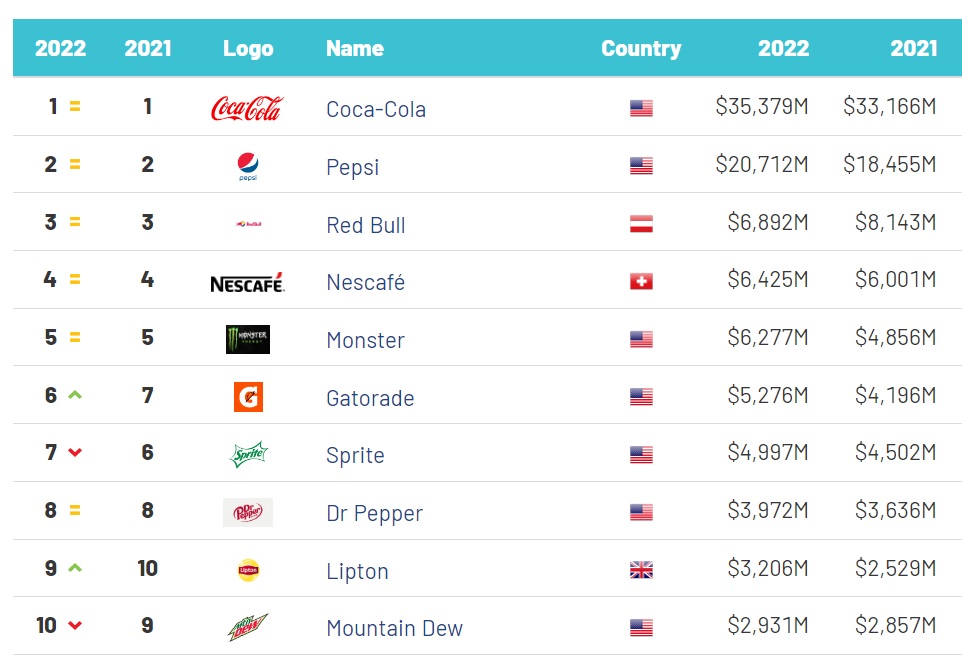
(Source: Brandirectory.com)
The above-shown chart presents the current ranking of non-alcoholic drinks.
- As of 2023, each ranking has an enormous profit resulting in$3,468 million starting from Coca-Cola.
- For Pepi and Redbull, the profit ratio stands at $18,335 million and $6,962 million.
- Monster managed an annual profit of $6,788 million, and $6,005 million for Nescafé.
- For Gatorade, Dr. Pepper, Sprite, Nongfu Spring, and Lipton the annual profit stands at, $4,916 million, $4,401 million, $4,166 million, $4,113 million, and $3,021 million
As stated in the above ranking, Coca-Cola is still preferred mostly by people all over the world followed by other drinks.
Demand Analysis
Demand analysis from previous years to the current situation in India in Comparison to Worldwide consumption
Analysis (All the Numbers Represent the Sale in Indian Territory)
- The rate of consumption per head in India is expected to reach 4.89 L in the year 2023.
- By the year 2023, the soft drink segment is supposed to increase at a rate of 2.4%.
- Considering the year 2026, the segment will have a 6,255.2 ml growth.
- By the year 2026, the outside-based consumption like bars and restaurants will increase to 2% in volume consumption and to 7% of spending.
- Considering the global consumption US tops the list in soft drink segmentation.
- The soft drink market is expected to increase at a 4.18% CAGR considering the years 2022-2026
India’s Soft Drink Sales Statistics
Total Revenue By Type (India)
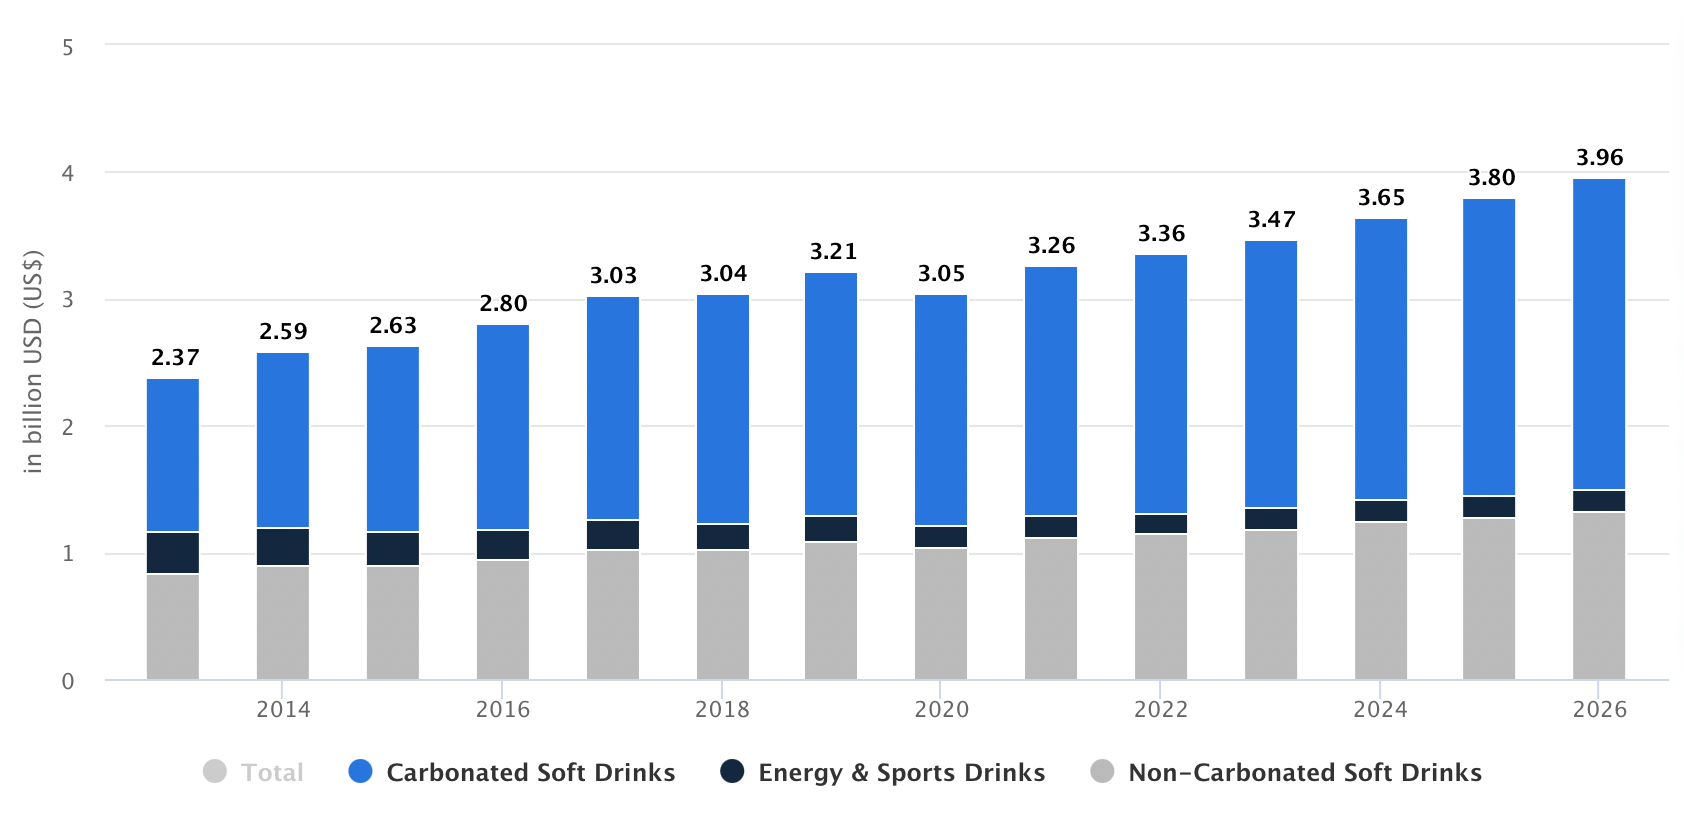
Explanation
- Considering the above comparison, carbonated soft drinks have more demand than energy and sports drink & non-carbonated soft drinks.
- By the end of 2023, revenue generated by the segment of soft drinks segment in India is expected to be $8.85 billion and by the end of 2027, the annual CAGR is going to be 5.39%.
- Revenue generated per person in 2023 is going to be $6.23.
- By 2027, the out-of-house consumption of soft drink segments volume is 4% and total spending resulted in 22%.
- The volume of this segment is expected to be 7.82 billion liters by the end of 2027 and volume growth is going to increase by 3.9% by 2024.
- In 2023, the average volume per person in the soft drinks segments is expected to be 4.89 liters.
- Whereas, from the year carbonated soft drinks segment rose to more than 3% and is expected to reach nearly 4% of the revenue.
Total Users By Income (India)
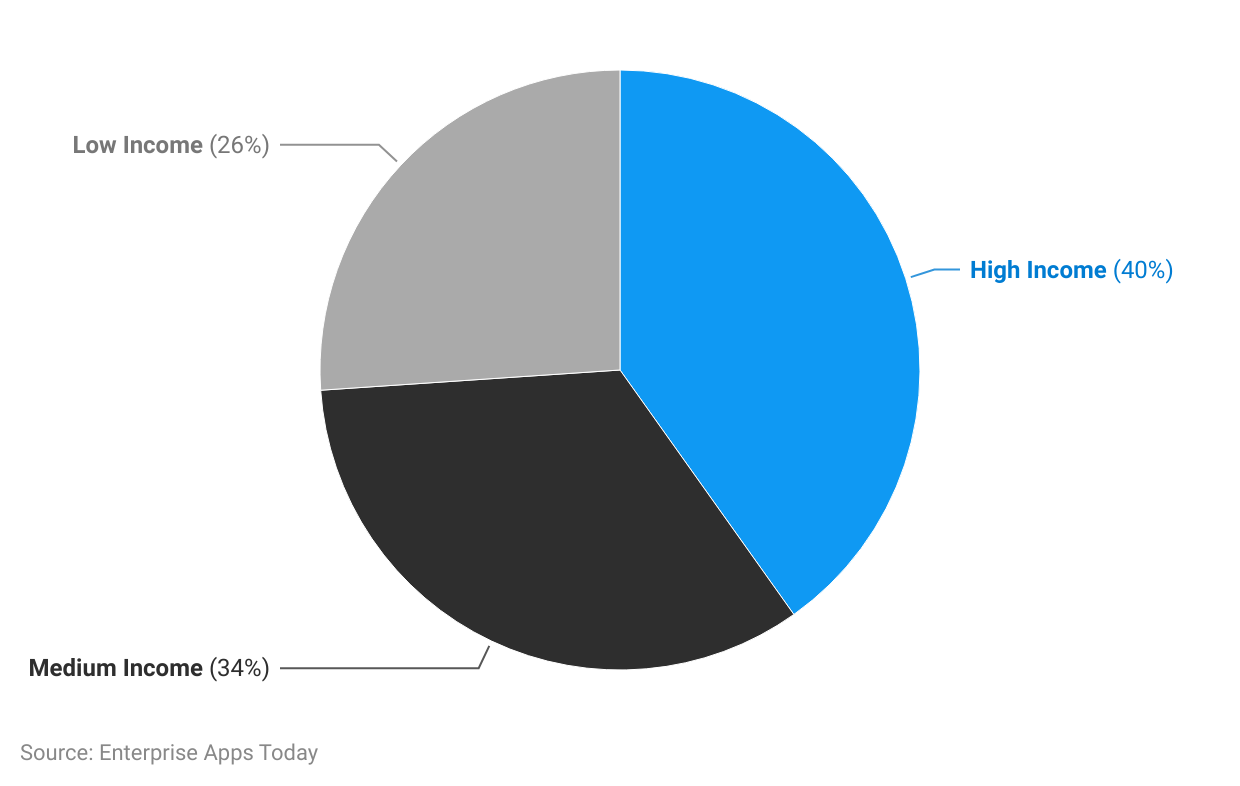
(Source: Statista.com)
Analysis
- In India, consumers with a high rate of income prefer more carbonated soft drinks than other segments standing at 40.2% nearly reaching half of the total.
- The percentage for carbonated soft drinks stands at 33.8% and 26.1% for medium-income consumers and low-income consumers respectively.
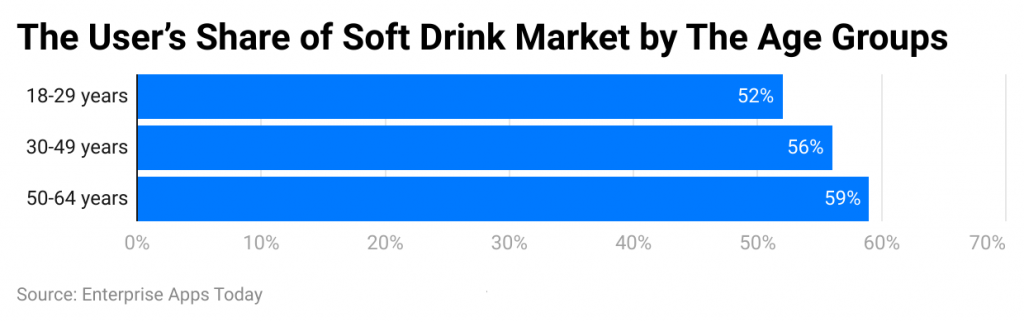
Total Users by Gender (United States)
 (Source: Statista.com)
- As of 2023, in the United States, the user’s share of the soft drink market is 59% by the age groups of 50 years to 64 years.
- Other user’s statistics are followed by 30 years to 49 years (56%), and 18 years to 29 years (52%).
Worldwide Soft Drink Sale Statistics
- By 2023, the United States of America stand number one for the sale of soft drink in carbonated soft drinks with annual revenue expected to be $149.60 billion which will increase by 11.6% from last year.
- Similarly, in the nation revenue earned in the non-carbonates soft drinks industry is expected to be $70.79 billion.
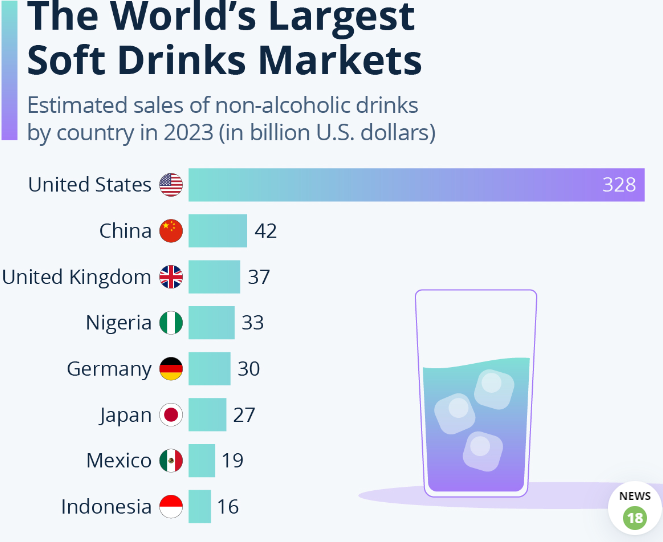
(Source: Statista Market Insights)
- Around the world, the most soft drinks sales experienced by the United States in 2023 with sales of $328 billion.
- The next position of maximum sales is secured by China with $42 billion a long way behind the U.S.
- Other country's soft drinks sales share is followed by the United Kingdom ($37 billion), Nigeria ($33 billion), Germany ($30 billion), Japan ($27 billion), Mexic0 ($19 billion), and Indonesia ($16 billion).
- In 2022, the Soft Drinks segment will generate US$0.85 trillion in revenue. Market growth is anticipated to be CAGR 6.95% annually (2022-2026).
- Out–of–home consumption (e.g. bars and restaurants) will make up 44% and 14%, respectively, of Soft Drinks' volume consumption by 2026.
- Volume in the Soft Drinks segment is expected to reach 384,033.4ML in 2026. In 2023, the Soft Drinks segment will experience a 5.8% increase in volume.
- In 2022, the average volume per person in Soft Drinks will be 45.11 L.
Most demanded soft drink in India (2023)
- Maaza is the best seller in India for the time being. It has a 29.7% share in the market followed by Bisleri.
- As per the report out of 12,000 crores sealed juice market, 75% of dominated by mango-flavored drinks.
- In FY 21, Maaza earned about 2,826 crores by observing the pandemic situation.
- Maaza revenue is expected to reach more than 4,500-5,000 crores as heat season approaches over the world. Coca-Cola in January 2023.
- Coca-Cola is the best seller in India for the time being. It has a 71% share in the market in 2023 across the world. As of July 2023, net operating revenue resulted in $11.97 billion.
- The next most demanded soft drinks brand in India is Pepsi with an 8% market share.
- By 2024, the market share of Sprite is going to be 20%.
- During the pandemic year, Coca-Cola focused its strategy on e-business to increase online sales and expand its digital marketing investment.
Summary
As of today, after analyzing the current situation, the world facing going through a pandemic situation, hitting a lot of businesses. As seen in the report Maaza became the top brand in soft drinks where it dropped its number extremely below the top 10 as the name vanished from the list in 2022. The best-seller worldwide rank was replaced by Coca-Cola again by gaining popularity during the initial phase of the pandemic year
Conclusion
As per the above market research, Coca-Cola will lead the market as it has already introduced a zero-coke flavored carbonated soft drink. People today, prefer no-sugar-added products or sugar-less products. Therefore, the step taken by Coca-Cola will help them to increase their revenue worldwide.
Sources

Barry is a lover of everything technology. Figuring out how the software works and creating content to shed more light on the value it offers users is his favorite pastime. When not evaluating apps or programs, he's busy trying out new healthy recipes, doing yoga, meditating, or taking nature walks with his little one.