
Website Statistics By Website Holders, Screen Region, Website Traffic, Per Time Visit, Country and Demographics

Page Contents
- Introduction
- Editor’s Choice
- Facts About Websites
- Challenges Faced by Website Holders
- General Website Statistics
- Website Traffic Statistics in the United States
- Web Design Statistics
- Pixels Fixations Statistics by Screen Region
- Website Builders Market Statistics by Region
- Mobile Device Statistics by Website Traffic
- Worldwide Popular Websites Statistics by Per Time Visit
- Conservative and Far-Right Websites Statistics by No. of Visitors
- News Websites Statistics of USA by Social Media Traffic
- Website Statistics by User Experience
- Google Website Statistics by Country
- Google Website Statistics by Demographics
- Top 5 Worldwide Website Statistics by Total Visit, Bounce Rate, Pages Per Visit, and Average Visit Duration
- Conclusion
Introduction
Website Statistics: The report says that till February 2023, there were more than 2 billion websites over the world of which only 400 million websites are presently active and 81% were deactivated. Websites are basically termed as the digital face of business organizations and companies which needs to be perfect because this is an important factor in marketing statistics. For creating website statistics it is necessary first to evaluate the customer’s trend and web design trends in recent days.
These Website Statistics include insights from various important aspects that will enable light on the importance of a website for every brand today.
Editor’s Choice
- In the 1st quarter of 2023, the most visited websites across the world were Google with 97 billion and YouTube with 80.5 billion.
- According to Statista, mobile devices have generated 59.16% of website traffic by the end of 2022.
- The most popular website type is e-commerce and which is having more than 20 million websites in total.
- As of 2023, for designing a basic website by using tools and themes the average cost stands out to be $2000 to $3200.
- In 2022, worldwide customers by 83% expected that websites must not take more than 3 seconds to load but the websites in mobile takes almost 7 seconds to load visual content.
- CTA commonly known as ‘calls to action’ is an important element of every website's homepages and in 2022, 70% of small businesses were not having CTA.
- On average online users spends almost 5.95 seconds viewing images on the main websites.
- A seamless performance has been experienced by 83% of users across all devices such as desktops, laptops, tablets, and Smartphones.
- As of 2023, the annual salary of an average website designer is $63,842.
Facts About Websites
- People left out many websites because of poor navigation systems agreed to 37% of users around the world in 2022.
- Websites with effective visuals with proper trends and topics allow them in evolving faster in recent days.
- By the end of 2022, the top web design trends are Memphis design, typographic hero image, retro revolution, visible borders, engaging interactive, neo-brutalism, moving type, creative scrolling experiences, and handmade graphics.
- Designing a basic feature on a website for providing a hassle-free and easy process for users takes almost 2 months on average.
- According to Behavioral and Information Technology, for creating opinions about the websites as well as the business, users took only 0.05 seconds of time.
- Designing a proper website is an essential factor because this directly impacts the reputation of brands, which has been agreed by half of the worldwide internet users.
- Colorful websites always remained more attractive and 39% of website users in 2022 have also preferred more color visual elements on websites which enhances the interest rate of users.
Challenges Faced by Website Holders
- In 2022 the biggest problem faced across the world was generating traffic and leads by 61%.
- The other challenges are followed by proving ROI (39%), securing budget (27%), managing websites designs (25%), getting the right tech (24%), Training (23%), hiring (22%), intellectual audiences (20%), and Finding executive sponsors (8%).
General Website Statistics
- The top priority of website users was to gather contact information and 64% of website users said that contact detail of a particular brand must be found out easily and should be readily available on every website.
- Website elements that annoy users to leave websites permanently are lack of message 46%, no valid contact information by 44%, animated ads by 42%, long loading time 39%, poor navigation system and design 37%, automated audio, and video by 33%, intrusive live chat by 30%, sliders by 17%, tiny text by 15%, and stock photos by 3%.
- Across the world, 25% of websites on the internet are made by blogs.
- Long loading times of websites in 2022 created a loss of costs for companies of around $2.6 billion.
- Around 47% of website users expected that websites must open within less than 2 seconds.
- Websites that include videos in their content5 are more user-friendly and thus website users spend more than 88% of their time by the end of 2022.
- After visiting websites and receiving personalized content in 2022, almost 1/3 of users planned to purchase and video content convinced around 73% of visitors to make a purchase.
Website Traffic Statistics in the United States
- In the 2nd quarter of 2022, the most viewed websites/month in the news and media publication were yahoo.com, cnn.com, nytimes.com, mns.com, and foxnews.com with visits of 3.3 billion, 62.7 million, 579.6 million, 733.9 million, and 298.6 million respectively.
- The most visited websites available in the e-commerce and shopping sectors were amazon.com (2.3 billion), ebay.com (694.7 million), walmart.com (392.6 million), etsy.com (450.9 million), and craigslist.org (206.8 million) visits.
- In the travel and tourism sector, the stats of the most visited website with no. of monthly visits were tripadvisor.com with 188.8 million, expedia.com (102 million), airbnb.com (108.9 million), booking.com (614.1 million), and southwest.com (68.2 million).
- In the Art and Entertainment sectors, the most visited website stats with no. of visits/month were 32.7 billion on youtube.com, 1.4 billion on Netflix.com, 723.9 million on fandom.com, 191.5 million on worldstar.com, and 499.5 million in imdb.com.
- The no. of visits to the finance sector websites was 195.5 million on chase.com, 434.5 million on paypal.com, 123.1 million on wellsfargo.com, 117.2 million on capitalone.com, and 114.7 million on bankofamerica.com.
- Based on the monthly visit, popular websites of real estate websites are Zillow.com (60 million), Realtor.com (41.39 million), Trulia (20.76 million), Redfin (10.19 million), Movoto (7 million), Homes (6.01 million), Remax (5.96 million), Point2Homes (4.62 million), Century21 (3.11 million), ColdwellBankerHome (2.34 million), ZipRealty (1.6 million), Apartments (1.5 million), Rent (1.4 million), Auction (1.3 million), and ForRent (1.2 million)
Web Design Statistics
- The credibility of the business depends on the design of a website which is termed as the top factor by 48% of people over the world in 2022.
- Customers' first impression is primarily based on businesses' website designs by 94%. As most new visitors first click on the website for going through basic information about the business thus making a good first impression is mandatory.
- As of reports in 2022, after having the worst experience on the first website visit almost 88% of online customers are less likely to return.
- Whereas, because of the unattractive layout structure 38% of customers stop engaging with the website again.
- The credibility percentage of a website depends on the design and patterns that need to be 75 out of 100.
- Users spend time watching the image on a particular website an average of 5.94 seconds and watching written content an average of 5.59 seconds by the end of 2022.
- As of the survey report, 67% of users preferred reading content from well-designed websites rather than a planned page.
- In 2022, almost 73% of worldwide companies have invested in website design for enhancing views against other competitors.
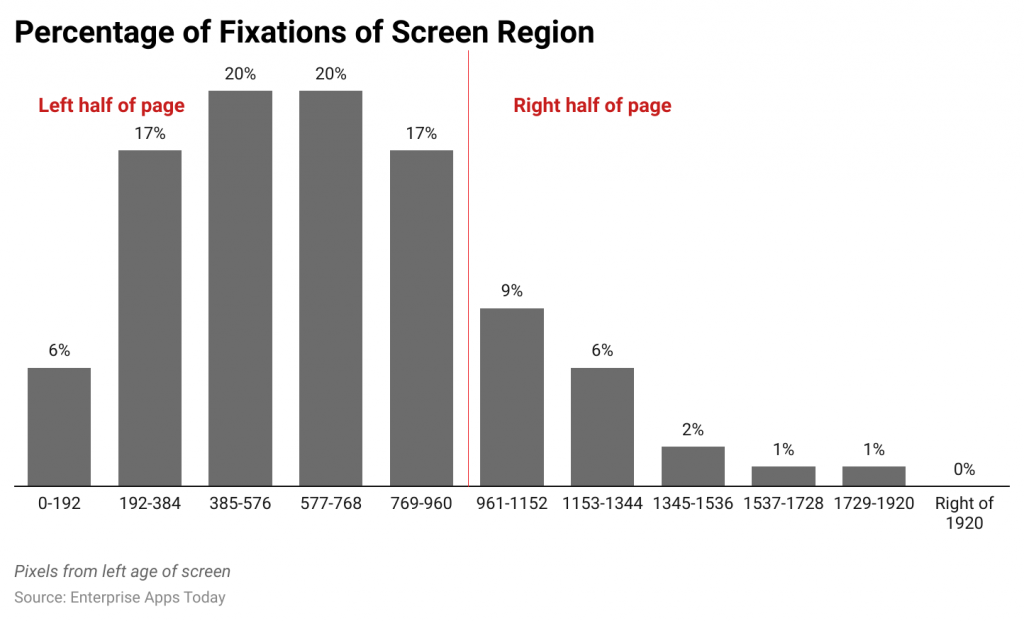
Pixels Fixations Statistics by Screen Region
 (Source: bloggingwizard.com)
- In 2022, 80% of the time was spent by website viewers looking at the left half of the pages.
- Left half of the page: 0-192 pixels covered 6% time, 19 3-384 pixels = 17%, 385-576 pixels = 20%, 577-768 pixels = 20%, and 769-960 pixels = 17%.
- On the other side, the right half of the page: 961-1152 pixels covered 9%, 1153-1344 pixels =6%, 1345-1536 pixels = 2%, 1537-1728 pixels = 1%, and 1729-1920 pixels = 1%
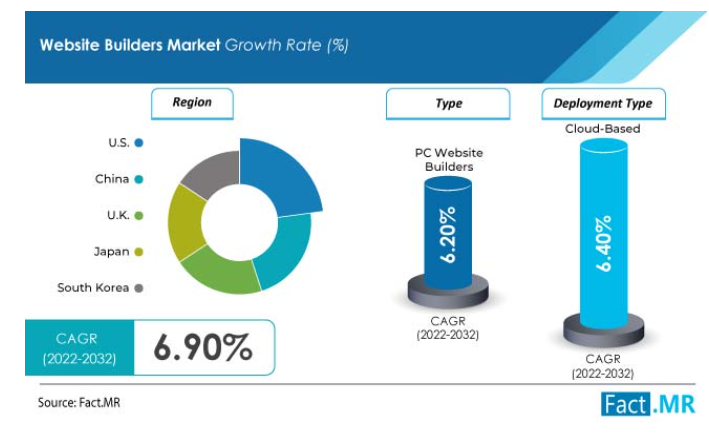
Website Builders Market Statistics by Region
 (Source: factmr.com)
- In 2022 the global website market value resulted in $1.8 billion which is a 6% growth from last year.
- On the other side, the global growth rate is going to enhance by 6.9% of CAGR, and in the United States it is expected to be 6.4%, the U.K (5.8%), China (6.2%), Japan (5.2%), and South Korea (4.4%) starting from 2022 to 2032.
- The key providers of website builders were Wix, Squarespace, GoDaddy, Mono Solutions, Web.com, Shopify, Ecwid, and WordPress.com
- The market value of website builders in the U.S. is going to be $1.2 billion, in China ($254.6 million), and Japan (205. million) by the end of 2032.
 (Source: forbes.com)
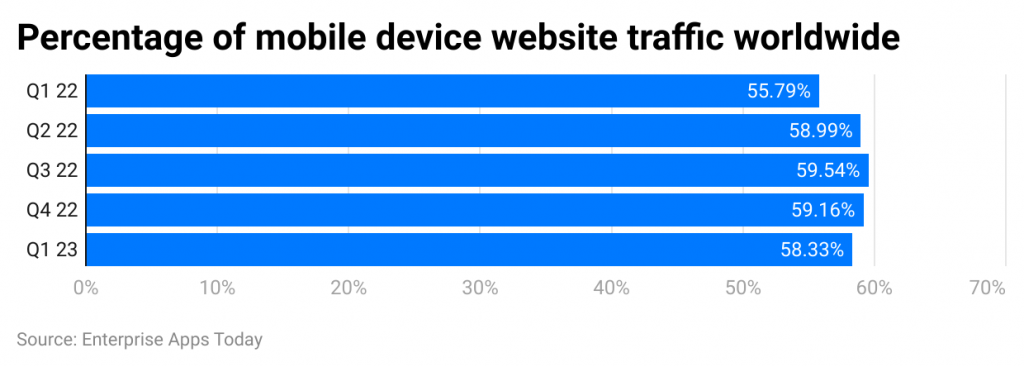
Mobile Device Statistics by Website Traffic
 (Source: statista.com)
- As of 2022, in the 1st quarter global website traffic was 55.79% by mobile device, by the end of the 2nd quarter it was 58.99%, in the 3rd quarter it was 59.54%, and in the 4th quarter it was 59.16%.
- Whereas, in the 1st quarter of 2023 the percentage of traffic has reduced from last year which has resulted in 58.33%.
- As of 2023, websites accessed by mobile devices has been increased in North America resulting in 51.2% of web traffic. Website visitors on Google 85.1 billion, YouTube (33 billion), Facebook (17.8 billion), Twitter (6.8 billion), and Instagram (6.18 billion).
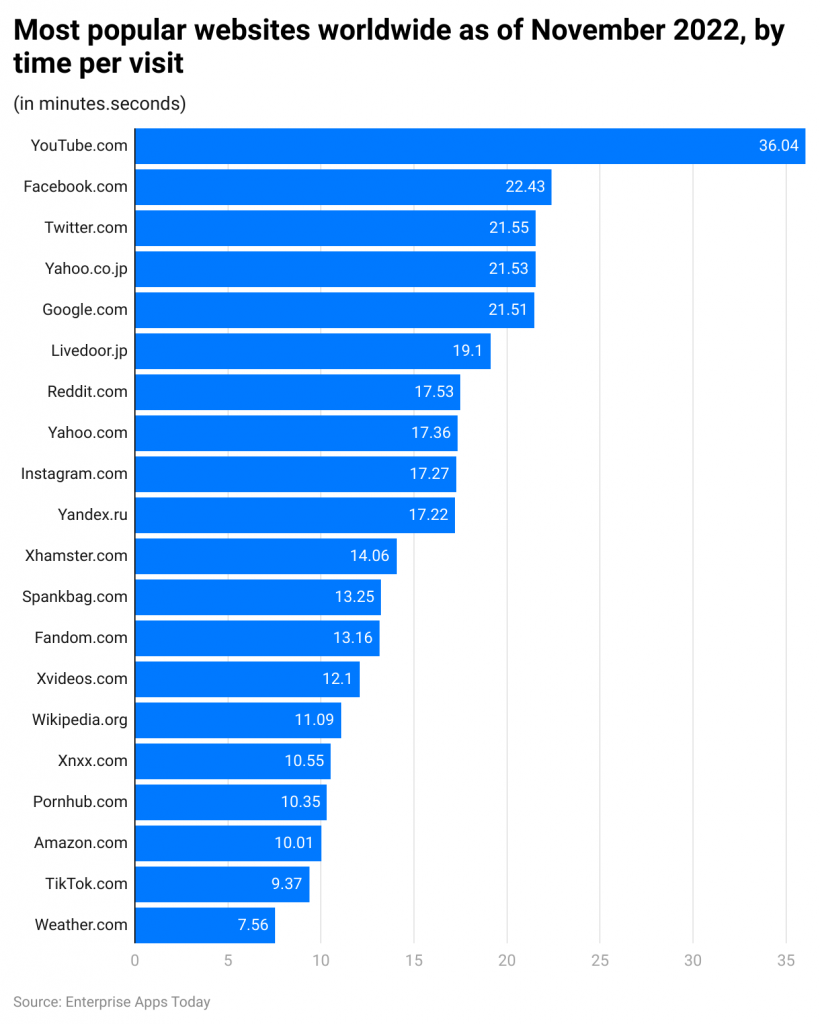
Worldwide Popular Websites Statistics by Per Time Visit
 (Source: statista.com)
- In the period between January to November 2022, the top most popular website was YouTube.com with 36 minutes and 04 seconds, followed by Facebook.com, Twitter.com, Yahoo.co.jp, and Google.com was 22.43, 21.55, 21.52, 21.51 (minutes. seconds) respectively.
- Other websites recorded the following time contribution in (minutes. seconds) were Liverdoor.jp (19.1), Reddit.com (17.53), Yahoo.com (17.36), Instagram.com (17.27), Yandex.ru (17.22), Xhamster.com (14.06), Spankbang.com (13.25), Fandom.com (13.16), Xvideos.com (12.1), Wikipedia.org (11.09), Xnxx.com (10.55), Pornhub.com (10.35), Amazon.com (10.01), Tiktok.com (9.37), and Weather.com (7.56).
Conservative and Far-Right Websites Statistics by No. of Visitors
 (Source: statista.com)
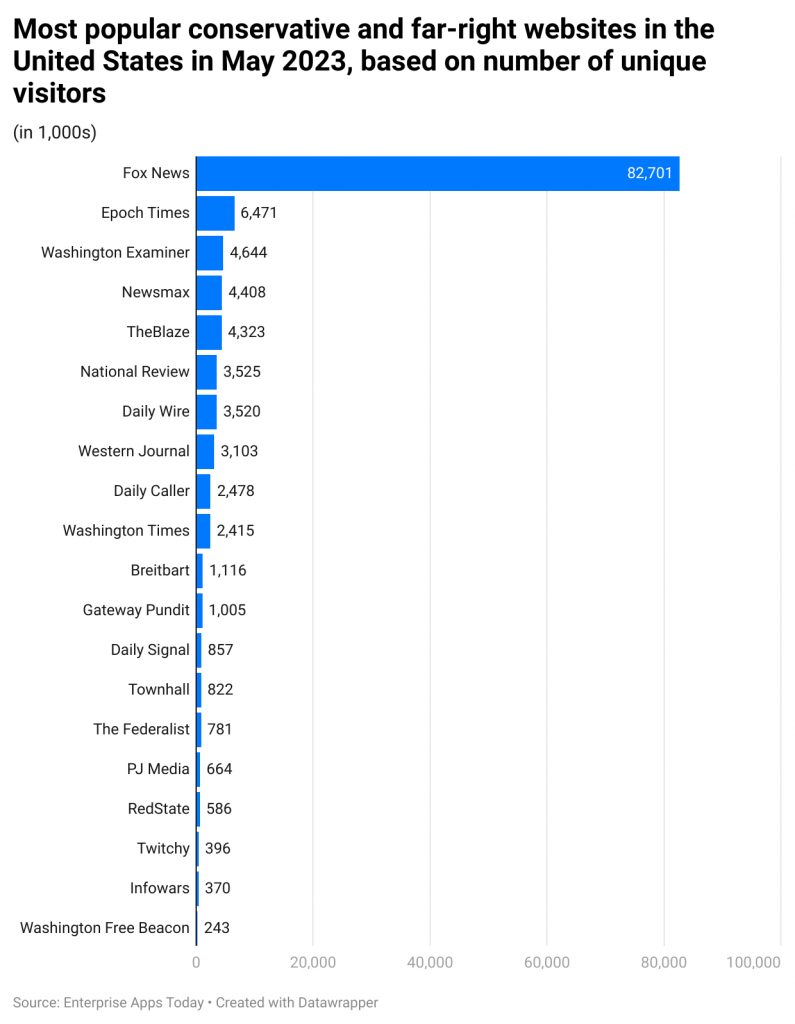
- As of May 2023, the most popular conservative and far-right websites in the United States.
- On the other side, it is followed by Fox News with 82.7 million visitors, which is followed by Epoch Times (6.4 million), Washington Examiner (4.6 million), Newsmax (4.4 million), The Blaze (4.3 million), National Review (3.5 million), Daily Wire (3.5 million), Western Journal (3.1 million), Daily Caller (2.4 million), Washington Times (2.4 million), Breitbart (1.1 million), and Gateway Pundit (1.05 million).
- The least popular conservative and far-right websites are Daily Signal (8.5K), The Federalist (7.8K), PJ Media (6.6K), RedState (5.8K), Twitchy (3.9K), Infowars (3.7K), and Washington Free Beacon (2.4K).
News Websites Statistics of USA by Social Media Traffic
- CNN website named ‘us.cnn.com’ was having followers with 34.7 million on Facebook, 61.5 million on Twitter, and 10 million on Instagram. The post frequency of this website is 5 posts/ quarter.
- The New York Times website named ‘nytimes.com’ has followers with 18.2 million on Facebook, and 55.1 million on Twitter and the post frequency stands out to be 21 posts/day.
- The Huffington Post website is named ‘huffpost.com’ which has followers of 12 million on Facebook, and 2.4 million on Instagram and the post frequency is 19 posts/ day.
- Fox News website named ‘foxnews.com’ has followers with 19.1 million on Facebook, 23.9 million on Twitter, and 4.3 million on Instagram, and post frequency was 30 posts/ day.
- USA Today's website named ‘usatoday.com’ has followers with 8.5 million on Facebook, 5 million on Twitter, and 1.6 million on Instagram, and the post frequency was 11 posts/ day.
- Politico’s website is named ‘politico.com’ which has followers with 2 million on Facebook, 4.6 million on Twitter, and 1.9 million on Instagram. Whereas the post frequency of this website is around 14 posts/day.
Website Statistics by User Experience
- Due to poor user experience around 90% of users have switched to other competitor websites for getting better potential.
- Even after facing a poor experience with websites, 88% of consumers still tend to revisit the same website.
- The bad UX is a weakness for website potential visitors or customers which is believed by 77% of accounts for user activity.
- Websites content that took long loading hours or long display time is not preferred by 79% of external users.
Google Website Statistics by Country
(Source: trends.builtwith.com)
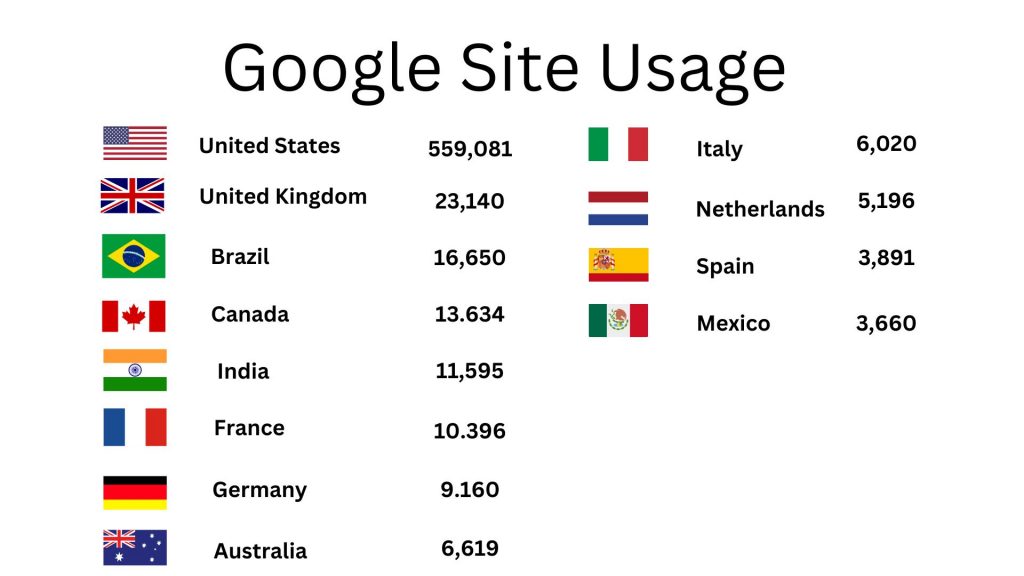
- Across every category of websites, Google's website was having the largest share with almost 794,725 sites by June 2023.
- The top country of Google's website is the United States with 559,081 sites in total.
- Other following countries' stats by no. of sites are the United Kingdom (23,140), brazil (16,650), Canada (13,634), India (11,595), France (10,396), Germany (9,160), Australia (6,619), Italy (6,020), Netherlands (5,196), Spain (3,891), and Mexico (3,660).
Google Website Statistics by Demographics
- Google.com users aged between 18 – 24 years used the website 24.90%, (25 – 34 years) used 29.99%, (35 – 44 years) used 19.07%, (45 – 54 years) used 12.55%, (55 – 64 years) used 8.23%, and (65+ years) used 5.25%.
- Whereas, male users dominated the website by 58.79% and females by 41.21%.
Top 5 Worldwide Website Statistics by Total Visit, Bounce Rate, Pages Per Visit, and Average Visit Duration
(Source: similarweb.com)
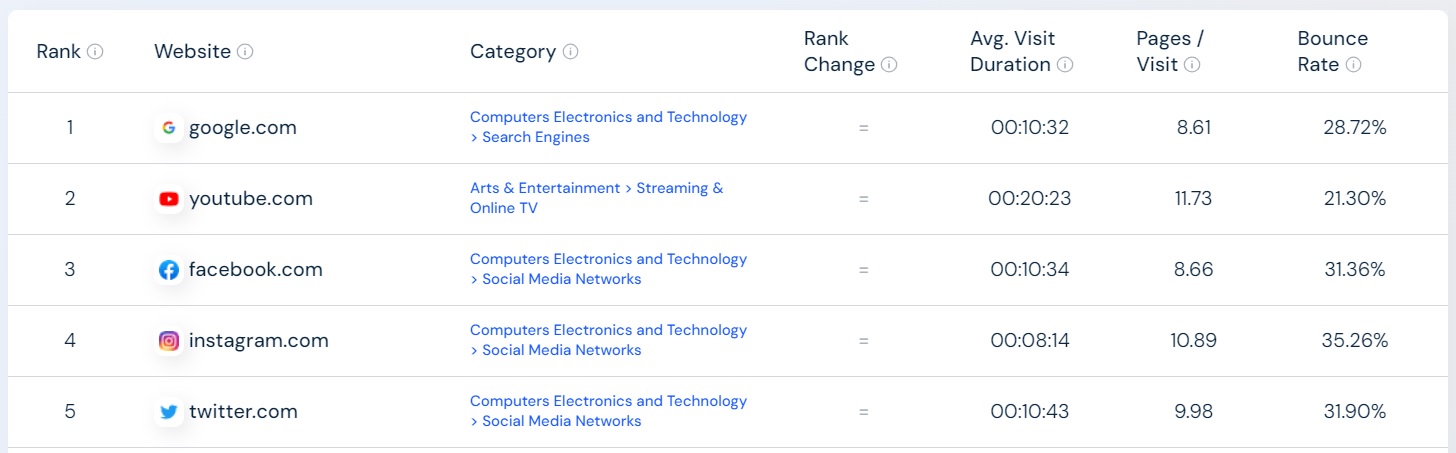
- Top-ranked website in the world is google.com and by June 2023 the total visit resulted in 84.6 billion, the bounce rate was 28.46%, 8.66 pages/ per visit, and the average visit duration was 10 minutes and 38 seconds.
- 2nd ranked website is youtube.com with total visits (32.7 billion), Bounce rate (21.31%), Pages per visit (11.56), and Average visit duration (20 minutes and 25 seconds).
- 3rd ranked website is facebook.com with total visits (16.8 billion), Bounce rate (30.83%), Pages per visit (8.68), and Average visit duration (10 minutes and 43 seconds).
- 4th ranked website is Instagram.com with total visits (6.5 billion), Bounce rate (34.61%), Pages per visit (10.81), and Average visit duration (08 minutes and 22 seconds).
- 5th ranked website is twitter.com with total visits (6.5 billion), Bounce rate (32.46%), Pages per visit (10.19), and Average visit duration (10 minutes and 47 seconds).
Conclusion
As of now after completing the article on Website Statistics it can be easily concluded that websites with proper designs and layouts allow in attracting more users. Websites are known to be the crucial platform for every company as they allow for gaining legitimacy. The effective roles of enhancing the power of websites are user preference and web designer’s suggestion which allow the company to become more successful. This article includes many important stats over the globe which will allow us in understanding better the importance of websites.
Sources
FAQ.
As of the reports of 2022 and few of 2023 it can be said that websites are still relevant. Websites are easily accessible by almost every device and mostly mobile-friendly websites allow approximately 67% of users to make purchases.
Over the world, almost the credibility of a company is judged through websites, and to date it is done by 75% of website users. Websites allow users to know about a company’s business, mission, logo, products, and statements.
A business maintained by websites means business via an online platform. Over the world, online businesses are growing enormously and to date it is around 18% and in America, online business has grown by 29.7%.

Barry is a lover of everything technology. Figuring out how the software works and creating content to shed more light on the value it offers users is his favorite pastime. When not evaluating apps or programs, he's busy trying out new healthy recipes, doing yoga, meditating, or taking nature walks with his little one.