
Black Friday Statistics 2023 – That Will Blow Your Mind
Page Contents
- The History of Black Friday
- Exploring Historical Black Friday Statistics
- Black Friday Statistics 2023
- Black Friday Online Sales Statistics
- Black Friday 2022- 2023 – Highlights
- Most Re-Prized Black Friday Products
- Black Friday Statistics By Shoppers
- Key Tips for Black Friday Statistics
- Black Thanksgiving Discount Statistics
- Conversion Rate, and the Black Friday Statistics on Cart Abandonment
- Black Friday Popular Industries And Items Statistics
- Conclusion
Black Friday Statistics: Black Friday is the biggest shopping day of the year for retailers all over the world. Online and offline, people line up until the early hours of the morning for deals at the door. Billions and billions of dollars are spent by both consumers as well as retail marketers. It's hard to locate a single retail store that does not participate in.
In the constantly evolving world of global commerce, few events have the same power as Black Friday. The modest post-Thanksgiving sale back in the 1950s has grown into a massive shopping event that influences consumer behavior and business strategies around the world. As November's fourth Friday draws near businesses get ready to announce a series of sales and discounts that will entice shoppers.
In this piece, we look into the depths of this huge shopping day with a variety of Black Friday statistics.
The History of Black Friday
Although Black Friday's chaotic shopping and jaw-dropping discounts are familiar to a lot of people, the roots of the phenomenon are from a different time. The phrase “Black Friday” was first coined in the 1960s, describing the day following Thanksgiving, in which Philadelphia retailers faced a lot of crowds and chaos in their shopping.
This created a striking perception of “black” with a flurry of business activities.
In the course of time, Black Friday evolved from being a local event to becoming an international phenomenon, characterized by early bird discounts as well as midnight store openings, and a zealous bargain-hunting spirit.
Presently, Black Friday stands as an annual shopping event that reflects the ever-changing technological landscape, the business environment, and consumer behavior.
It's a testimony to the longevity of sales and the joy of finding that perfect bargain that it is a pillar of the Christmas shopping season.
Exploring Historical Black Friday Statistics
Analyzing the development that has occurred during Black Friday reveals a dynamic change in consumer and retail behavior. From its humble beginnings to its rise to become a global phenomenon Let's look at some of the most notable Black Friday statistics that showcase the ways in which shopping habits, spending patterns, and strategies for retail have changed over time in line with the wider social and economic shifts, from bricks and mortar to online shops.
- In the year 2022, Black Friday's online retail sales increased 3.5% to $65.3 billion worldwide.
- The amount of Thanksgiving shoppers increased significantly by a significant amount from 174.6 million at the time of 2017. It climbed to 189.6 million in 2019. and the amount of internet-based Black Friday shoppers reached the 100 million mark for the first time in history.
- Black Friday spending was $9.12 billion by 2022. That's 2.3% higher than 2021.
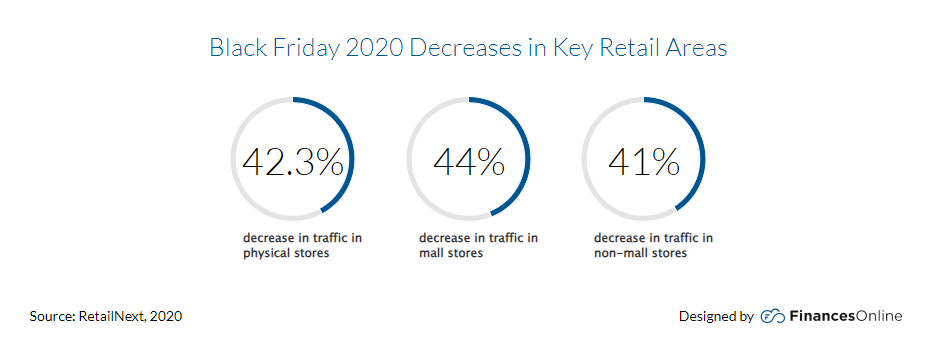
- Black Friday 2020 witnessed significant decreases in traffic because of the COVID-19 virus outbreak, however, there was a significant increase in the average value of transactions.
- Black Friday 2023 is expected to be more popular than ever before, with a record-breaking $9.12 billion being spent online within the US in 2022.
- In the year 2019, Black Friday online sales totaled $65.3 billion across the globe, which indicates an increased preference for online shopping.
- In 1939, president F.D. Roosevelt attempted to alter the Thanksgiving time to boost the economy prolonging the shopping season for the holidays.
- Black Friday continues to be the most popular annual shopping event across the United States, influenced by things like the rise in inflation, disruptions to supply chains, and pandemic-related practices.
Black Friday Statistics 2023
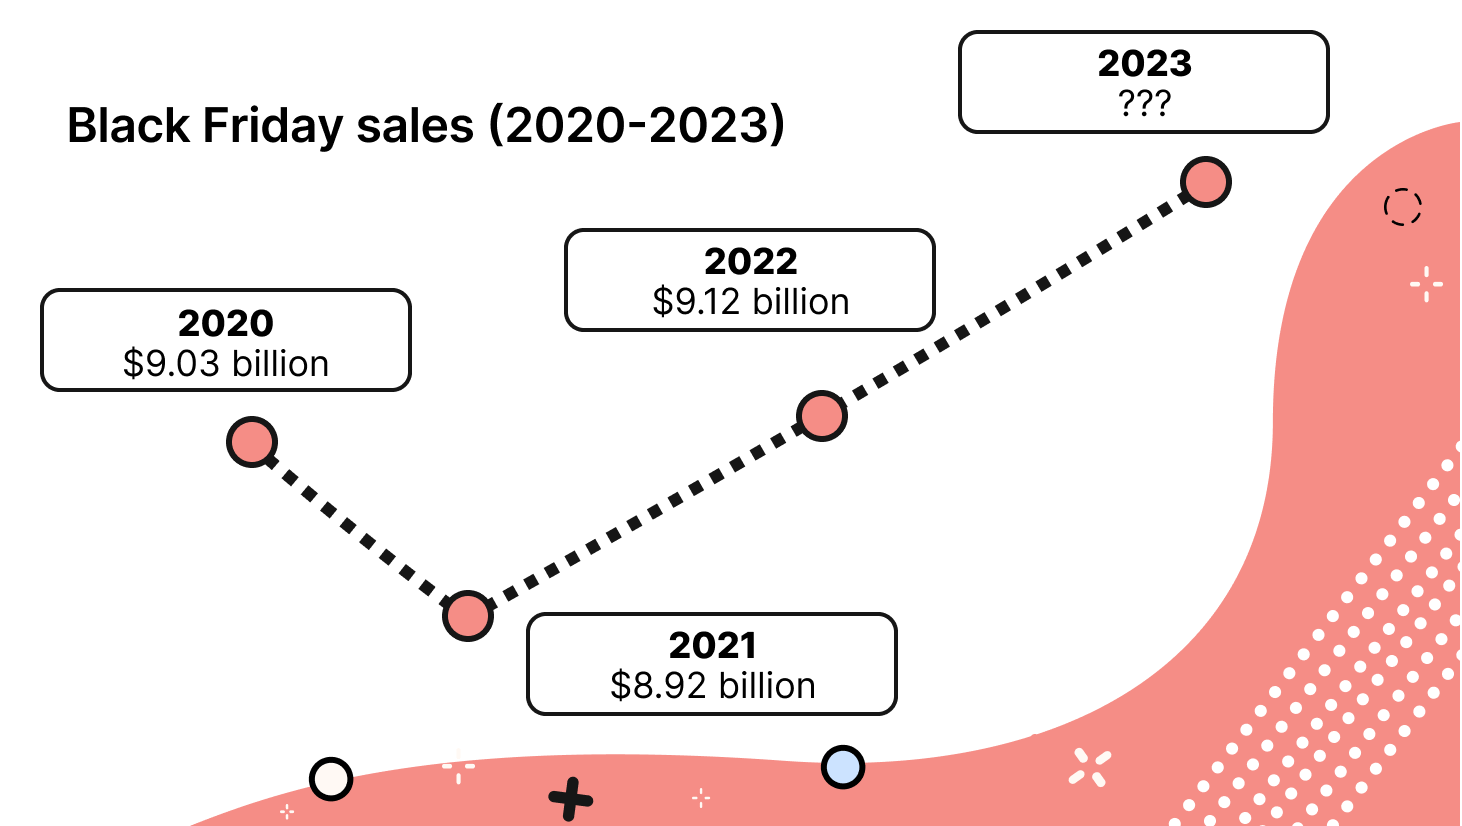
- Black Friday 2023 Bigger and better than ever –The numbers suggest the fact that Black Friday 2023 is poised to be more significant than any other time. In the year 2020, due to the aforementioned pandemic, many people chose to remain at home and shop on the Internet, and US e-commerce sales reached $9.03 billion. However, in 2021, as people were more willing to venture out, sales dipped slightly to $8.92 billion, according to Adobe Analytics. The growth rate in 2022 was astonishing in record time, with an all-time high of $9.12 billion that was spent on online shopping across the US. Since shopping patterns are stabilizing and a steady increase in online shopping, we could see another record-breaking year for online retailers in 2023.
- Black Friday and Cyber Monday Go Global – Black Friday and Cyber Monday which were previously solely American phenomenon, now transcend the borders. Though they began in the US their popularity now is a global phenomenon. According to London adds itself to the top of BFCM cities around the globe which is a part of the spotlight along with cities such as Los Angeles and New York City.
- Mobile takes center stage in Black Friday- Mobile commerce has been the center of attention during BFCM. Based on Shopify, the year 2022 will see more than 73% of all sales to sellers on the platform took place through mobile devices, up from 71% the year prior. This pattern underscores the increasing importance of mobile devices within the purchasing process and is expected to continue through 2023.
- Buy Now Pay Later (BNPL) How to Get Higher Conversions – Buy Now Pay Later (BNPL) services are gaining popularity in popularity, and customers are taking to the services enthusiastically. Based on Adobe, BNPL utilization saw an increase of 85% when BFCM was launched in 2022, as compared to the previous week, and was accompanied by an astonishing 88% rise in BNPL revenues. According to RBC Capital Markets, BNPL has proven to be a highly effective converter, boosting the conversion rate by 20 to 30%.
- The rise in toy sales is due to a 285% increase – 2022 was a difficult year for toy businesses, as they struggled with rising inflation as well as lingering concerns about pandemics. Yet, Black Friday acted as an emergency, providing the most impressive 285% rise in sales when compared with normal daily sales in the month of October. Although it didn't completely alter their financial situation it surely gave them an impressive boost. It wasn't just games that benefited; electronics were also booming. The entire industry witnessed a rise of 19% in sales, with household electronic devices leading the pack by a whopping 200% rise compared with the typical October day.
- Shipping Costs Influence Shoppers Choices (49%) – Costs for shipping have an enormous influence on consumers make their choices. A study by Finances Online discovered that more than 50% of buyers (49%) at 2022's Black Friday sales were primarily affected by the cost of shipping. These shoppers were lured by the lure of free shipping. This underscores the importance of a clear shipping policy.
- Paid Search Rules to be a Top Digital Marketing Strategy – According to Adobe research, paid search was ranked as the most effective digital marketing technique, accounting for 28% of all online sales in Cyber Week. In addition, owned channels including SMS and emails were a major factor and brands were able to send an average of 68% more SMS during Black Friday, resulting in an astounding 57% growth in the number of orders.
- SMS marketing's 2000% return on investment during Black Friday – With the world SMS market expected to reach $78 billion by 2022 it's an industry that is increasing. The thing that is what makes SMS marketing an outstanding method is its astounding 98% rate of opening. Many eCommerce companies are jumping on the SMS trend and with great reason. A new study conducted by Omni the sender has revealed that certain SMS campaigns have yielded an astounding 2000% ROI of investment in this Black Friday shopping frenzy. This strategy is smart and will boost the effectiveness of your Black Friday marketing efforts.
- Cart abandonment campaigns are more successful during BFCM – Campaigns to abandon carts have a significant role to play in the festive season. They boast an impressive 34% rate of open as well as a 95 click-through rate they are a potent instrument to regain the interest of prospective buyers who abandoned products in their online shopping carts.
- The benefits of personalization are evident when it comes to email – Personalization is key to getting shoppers' attention. Black Friday emails with personalization have a 155 higher opening rate as compared to generic unpersonalized emails. The customers appreciate the personalized approach within their mailboxes.
- The desktop has a higher conversion Ratio over mobile (5.65 against. 3.3%) – Mobile devices generate sales, figures from Statista indicate that desktop has a better conversion rate of 5.65 compared with mobile devices that have a 3.3% conversion rate. It is evident that consumers are more likely to buy desktops.
- The global spending total was $1.14 Trillion – The global impact of the holidays on spending online is huge. Consumers spent more than $1.14 trillion on the internet during the festive period. This number emphasizes the significance of business during the shopping season during the holidays.
- consumers spent 23% of their Christmas budget by the end of October 2022 – According to a Deloitte study by the end of October 2022, U.S. consumers had already paid 23% of their Christmas budgets according to the aforementioned average. The early trend in spending suggests that people are keen to begin their shopping for the holidays.
- Increase in the use of credit cards by 48% – according to Deloitte credit cards gained popularity with shoppers during the U.S. Cyber Week shoppers in 2022. In fact, 48% are planning to make purchases using them which is up from 35% in 2021. The shift in the preference for payment highlights the significance of a variety of choices for payment methods used by eCommerce companies.
- Chatbot growth 57% Growth in Chatbot messages on Black Friday – Chatbot messages worldwide were up by 57% during Black Friday year over year. This increase is the result of the widespread adoption of AI-driven support systems for customers when there is a lot of traffic.
Black Friday Online Sales Statistics
The owners of online stores noticed a spike in the number of online shoppers in the year 2020. How has it changed in the past few years? Let's see:
(Source: moosend.com)
Below are the top significant sales figures for online that you should be aware of:
- The year 2022 saw Black Friday spending reach $9.12 billion, 2.3% more than in 2021. – Adobe
Based on Shopify Store owners, their average purchase total for Black Friday/Cyber Week for the year 2022 stood at $102.10 just a bit more than the 2021 average the average is $100.70. The Shopify store is a part of the Shopify - The Christmas shopping season of 2020 was the largest in the history of Amazon. – Amazon
- In 2022 there will be there will be more than 122.7 million customers going to US brick-and-mortar shops during this Black Friday weekend, an increase of 17% over the previous year. The National Retail Federation (NRF)
- In 2021 59% of people between 18 and 44 wished to shop on the internet. Sitecore – Sitecore
25% of American consumers prefer shopping online because they believe they'll get more attractive Black Friday deals. – DriveResearch - The year 2022 saw 87.2 million U.S. customers shop online, approximately the same as the 2021 year. – National Retail Federation
- Black Friday's sales have been anticipated to surpass $9.8 billion by 2023. That's $680 million more than in 2022, which was when sales totaled $9.12 billion.
- About 196.7 million American shoppers shopped during the 2022 Black Friday sales.
- The average discount for shoppers was 25% discount in last season's Black Friday and Cyber Monday sales.
- The rate of conversion on the e-commerce platform grew to 50% during Black Friday 2022
- About four-fifths of online sales made during Black Friday were made on smartphones.
The use of ‘Buy Now Pay Later' increased by 78% in 2022s when compared with the previous year. The use of this feature is anticipated to rise even more throughout 2023's sales.
| Year | Total Sales |
| 2022 | $9.12 billion |
| 2021 | $8.92 billion |
| 2020 | $9.03 billion |
| 2019 | $7.4 billion |
| 2018 | $6.2 billion |
| 2017 | $5 billion |
(Source: demandsage.com)
Black Friday 2022- 2023 – Highlights
- For September 2023 71% of the survey respondents indicated that they'd purchase online during Black Friday and Cyber Monday 2023 (Adobe 2023c).
- The deepest Black Friday discounts on televisions are anticipated to exceed 20%, surpassing previous records (Adobe 2023c, 2023c).
- On the day of Black Friday 2022, conversion rates were 13% higher than Black Friday 2021 (Impact, 2022).
- In 2022 the year 2022, 81% of potential U.S. Black Friday and Cyber Monday customers said that getting the most value for money was their top priority (Google 2022).
- In 2023, 74 %of U.S. consumers indicated they were concerned about the environmental impacts of the products they purchase (PDI 2023).
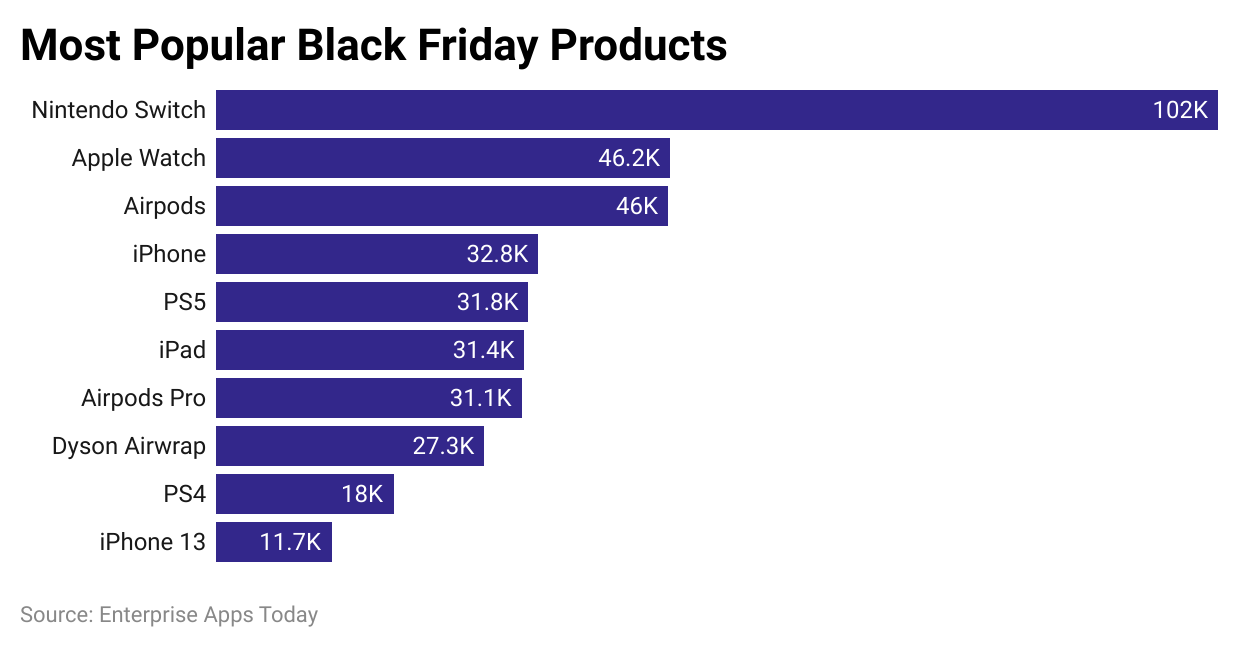
Most Re-Prized Black Friday Products
Picture this: amid the craze of shopping, there are certain items that draw attention as if they were on red carpets.
We're revealing the most popular products that are in the spotlight on Black Friday, and influencing the figures for black Friday.
It is here that we can unravel the industries that experience an increase in sales and look into the secret ingredient that creates a certain product appealing.
(Source: doofinder.com)
- No matter what industry tech products have the largest demand, resulting in Black Friday sales numbers.
- Nintendo Switch was the most well-liked Black Friday 2020 product, overtaking PS4. – Statista
- Amazon's top five most-loved products on Black Friday and Cyber Monday included all items that were technology-related. The most popular item was House Beautiful. House Beautiful
- Consumers spent more money on clothing, accessories, shoes, Electronics, and Toys. – NielsenIQ
- On Cyber Monday 2022, electronics was the most popular purchased product, followed by Clothing/Accessories. – Nielsen IQ
- Clothing was not among the top categories of merchandise for women in 2022. — Statista
- According to Adobe Analytics, the most well-liked items for Black Friday 2022 were: the Xbox Series X, Bluey, Call of Duty, Drones, and MacBook. – Adobe Analytics.
Black Friday Statistics By Shoppers
- 62% of shoppers believe that Black Friday is a scam.
Additionally, 81% believe there is an excessive amount of consumption that is related to Black Friday, likely contributing to the number of people who believe it's fraudulent. But, that doesn't stop people from taking part in the holiday, since 80% of those planning to buy something in 2022. It's a case of cognitive dissonance.
- 80% of customers look at discounts prior to purchasing the item they want on Black Friday.
Since so many people think that Black Friday is a scam and that there are many websites and stores that are available, it's not surprising to observe nearly 9/10 of people Comparing prices. For instance, the customer may look over the same item for sale on Amazon, Walmart, and Wayfair to figure out which offers the most attractive Black Friday deal.
(Source: zippia.com)
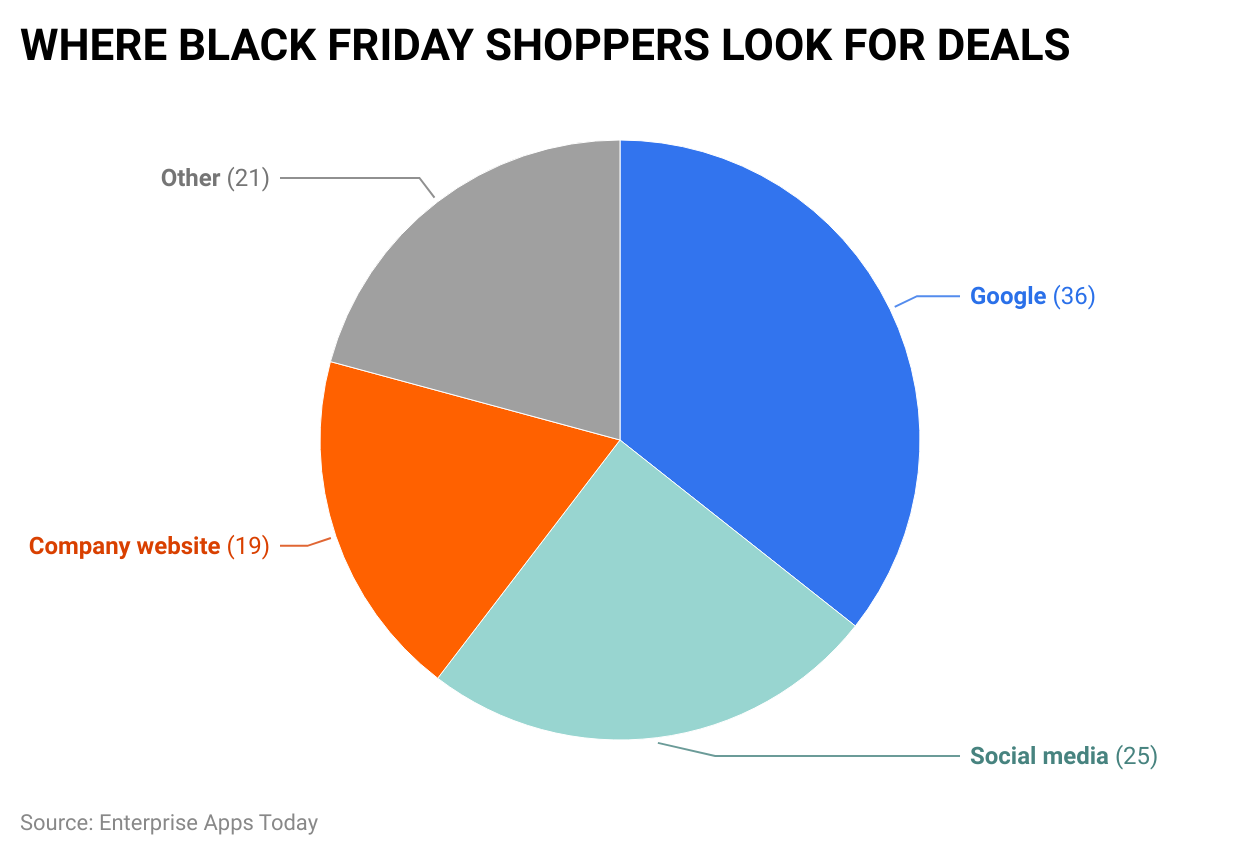
- 36% of Black Friday shoppers will look for bargains through Google.
This is followed by 25% of people who search for offers on social media and 19% who visit the site of the company.
- 122.7 Million Americans were shopping during Black Friday in 2022.
The data covers both in-person as well as online customers. When you consider that, as of the 2020 U.S. Census, there were 258.3 million people living in the nation, this is to demonstrate the magnitude of the appeal of Black Friday.
- The average person is spending $430 for Black Friday.
Not only do a lot of people buy at a high volume on Black Friday, but they spend a lot. People can't help but take advantage of the numerous discounts that boost the amount they spend.
- 58 A majority of shoppers search to shop for Black Friday sales.
Unsurprisingly, more than half of Americans are looking for deals on Black Friday. This increases the amount of people shopping.
- A little bit more men are planning to buy during Black Friday than women.
According to estimates, 77% of males intend to shop for Black Friday, while only 71% of women intend to shop. However, what's clear is that almost three-quarters of both genders are actively shopping.
- Adults aged between 35 and 44 constitute the majority of people shopping during Black Friday.
The table below illustrates, 33.6% of people who are between the ages of 35 and 44 go shopping during Black Friday, followed closely by younger adults between 18-24.
| Age Range | Percent |
| 18-24 | 32.6% |
| 25-34 | 24.2% |
| 35-44 | 33.6% |
| 45-54 | 29.2% |
| 55-64 | 24.6% |
| 65+ | 24.4% |
- 42% of shoppers regret buying at least one thing during Black Friday.
With all the savings Sometimes it's difficult to say no. And some shoppers realize that certain purchases were not as they should have been.
Key Tips for Black Friday Statistics
31% of Black Friday shoppers start early
The timing of your visit can make all the difference. One-in-four shoppers go to the shops between 5 and 10 am on the 24th of November, Friday. In 2022 31% of shoppers began the Black Friday spree on Thursday and 15% planned to shop for gifts in the hours between 5 and midnight. am on Friday. In this context, it's important to plan with your mail marketing or your social media campaigns for these times of high activity to draw shoppers in and increase your sales.
Smartphones dominate, with 76% of Cyber Week e-commerce traffic
Social media has certainly become an important factor in how people shop on Black Friday shopping experience. A survey by Salesforce showed that by 2022 mobile devices accounted for an astounding 76% of Cyber Week eCommerce traffic. In addition, social media was the primary factor in driving nearly 10% of referrals which is an increase of 22% year-over-year and setting a new record in referral rates during the Christmas season.
With these trends expected to continue until the 2023 year and even beyond, it's more crucial than ever before to take advantage of social marketing via media. Be proactive in sharing attractive promotions, suggesting must-have items, and engaging with your customers.
SMS can be described as a method that is on the rise and has seen a 34% rise in messages that were sent out over this Black Friday weekend.
Dot Digital has delivered 11,377,565 SMS over the Black Friday to Cyber Monday (BFCM) weekend in 2022. We're anticipating even more volume this year. With a rate of delivery of 99.51% that's an important option to consider, particularly when timing is crucial. The months of November and December are characterized by an increase in SMS-based messages each year because the holiday season kicks off, which makes it an important option to integrate into the Black Friday strategy.
Amazingly, during the same time frame, SMS also saw a massive increase of 34% in messages that were sent during the Black Friday weekend. In addition, the volume of SMS messages saw an increase of 14.8% increase compared to the week prior. This astounding growth highlights the importance of including SMS in your overall marketing plan during the Christmas season.
Black Thanksgiving Discount Statistics
Black Friday is associated with the season's most significant discounts at the retail store.
Here's a look at the typical discount rates across various industries and how these discounts impact shopping habits and shopping habits, both in shops and on the internet.
- Black Friday discounts are currently averaging Around 50% increasing the popularity of the occasion and boosting consumers to spend more.
- The average price for men is on an annual average of $724.46 in comparison with $610.71 on females for women on Black Friday, indicating an inverse gender difference in the way people spend their money.
- Mobile was responsible for 60% of the global Black Friday sales, showing the growing importance of mobile commerce in driving sales during the Black Friday event.
- In 2022 the e-commerce market accounted for around 20% of all global total retail revenue, marking a 50% growth from pre-pandemic levels highlighting the increasing influence of e-commerce in Black Friday sales.
- SMS Marketing can result in as high as 2000% ROI on Black Friday, showcasing the efficacy of SMS marketing in generating sales during the holiday.
Conversion Rate, and the Black Friday Statistics on Cart Abandonment
(Source: financesonline.com)
The majority of consumers want to make their purchases prior to the time that Black Friday promotions end or the products are no longer available. It is an excellent possibility for retailers to grow the sales of their products and improve overall performance. As the numbers indicate, the abandonment rates and conversion rates look positive, yet they don't meet the expectations about Black Friday.
- The conversion rate averaged higher by 3.8% in 2020 when to 2019. (Retail Next via Forbes, 2020)
- The percentage of revenue generated through devices is 39% in the case of smartphones. This can be estimated at $74.6 billion. Laptops as well as other gadgets are 61% and have an amount that is around $133.6 billion. (Adobe, 2020)
- The rate of conversion for mobiles by Cyber Monday was 3.31%. (Adobe, 2020)
- The rate of conversion for laptops, tablets, and other gadgets through Cyber Monday was 7.27%. (Adobe, 2020)
- From November 1 through the 31st of December, 2020 there were 25 days out of 61 days with three billion or more of revenues. (Adobe, 2020)
- 37% of the total Cyber Monday sales come via mobile devices. (Adobe via Forbes, 2020)
30% rise in the curbside pickups YoY during Cyber Monday. (Adobe via Forbes, 2020) - The worldwide abandonment of shopping carts frequency is 77.79%. (Barilliance, 2020)
- The abandonment rate of carts within the US in the US during Black Friday reached 79.83%. (Barilliance, 2020)
- In the US there is total percentage of conversion is 2.29%. (Barilliance, 2020)
Based on these figures you can see that conversion rates do not seem to be impressive. Furthermore, the rate of abandonment of the Black Friday shopping frenzy is frightening. However, lower abandonment rates suggest that the retailers are changing their ways around. The slow-paced pace implies that more work needs to be done in order to get the maximum benefit from this brief shopping time. It is a good idea to understand the basics of a shopping cart program and implement a system that optimizes the conversion.</p>
Black Friday Popular Industries And Items Statistics
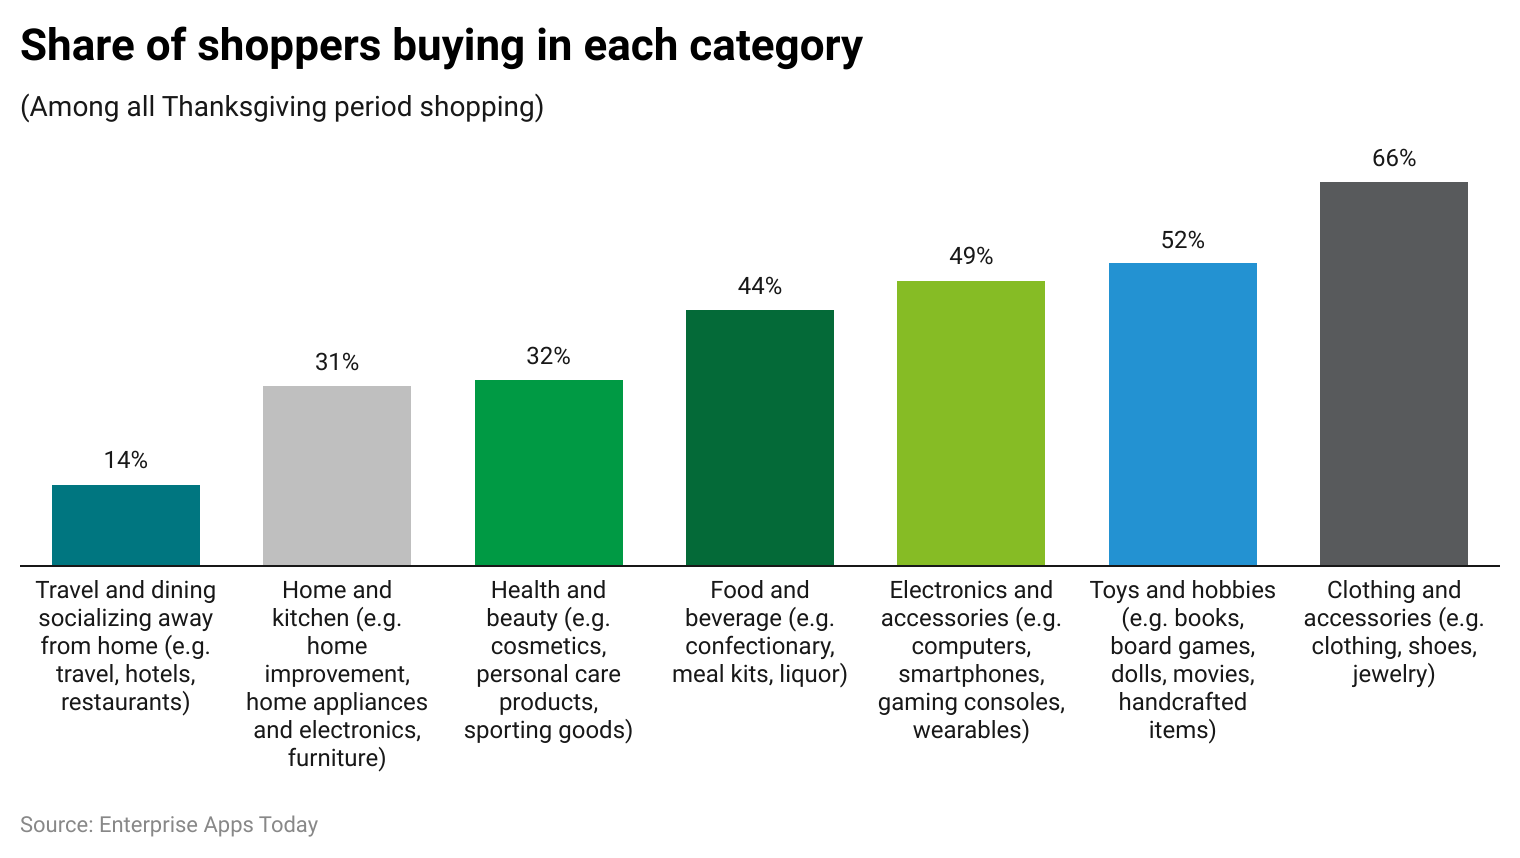
- When it comes to shopping for the holidays The most sought-after segment is clothing and accessories which is 66% of the total, followed by toys accounting for 52% of the sales, and electronic gadgets at 49%.
(Source: siteefy.com)
- Actually, people typically browse clothing the largest of all categories, and are able to browse 8.54 merchandise around 17.97 times per hour on average.
- Apparel can also be the most effective in being able to re-engage customers, resulting in 5.96% of repeat buyers who purchased earlier this year.
- Additionally, there were three top trending items of Black Friday 2021 the Switch, Barbie, and Oculus although the popular brands will likely change by 2022.
Conclusion
It's not a secret, Black Friday is a huge deal, and the data and figures below are proof of this. If you're hoping to improve sales or bring in leads, Black Friday can be the ideal time to achieve your objectives.
Black Friday, along with Thanksgiving is the most well-known method of kicking off the shopping season for Christmas. According to the Black Friday statistics, the tendency to shop online during the holiday season is increasing because of the digitalization process. Each day, consumers purchase items, but Black Friday offers special and massive discounts, therefore the information gathered from this trend is helpful to the nation's economy. There are numerous other e-commerce sites that are accessible 24/7 and all year round like Amazon, Best Buy, and Etsy. they promote shopping all day long providing businesses with the opportunity to grow their sales.
We hope you'll find that the Black Friday statistics above helped to make you aware of this amazing shopping holiday.
Sources
FAQ.
The term originated in 1869, when investors Jay Gould and Jim Fisk bought heaps of gold and drove its price up. As a result, the stock market decreased by 20%, and farmers had to deal with a 50% lower profit. It wasn’t until the 1950s that Philadelphia police officers used “Black Friday” to describe the day after Thanksgiving, when crowds of people were doing holiday shopping sprees and the officers had to work long hours to control and secure them. Despite attempts to change it to “Big Friday,” the name Black Friday caught on. In business, being “in the black” means generating profit — and that’s what all retailers do on this day.
To an untrained eye, it might look like companies are losing money on shopping holidays, including Black Friday. Of course, that’s far from the truth. As is valid all year round, deals and discounts are carefully curated and promoted so that companies always turn a profit.In 2020, companies made a total of $9 billion in online sales alone. This is 21.6% more than they made on the same day in 2019. Black Friday 2020 gave companies impressive sales boosts — a whopping 573% to large and 545% to small and medium businesses.
Consumers’ personal Black Friday spending varies, but an average in-store shopper spends about $128. Looking at online purchases alone, an average consumer spent $27.6 per transaction on Black Friday 2020. While that doesn’t seem like much, it’s also worth noting that US Black Friday shoppers spent an impressive $6.3 million per minute in 2020.
Whether you’ll save money and the amount you’ll end up saving will depend on a range of factors. It should be noted that many stores purposefully inflate their prices ahead of the shopping season. Come Black Friday, they can then boast about offering massive discounts when the real savings are much lower. For inexperienced and excitement-driven consumers, it’s safe to conclude they’re less likely to save substantial amounts on Black Friday.But those consumers who follow retail — especially particular product categories — and are staying on top of new information are more likely to make a smart purchase and save big.
Technically speaking, Black Friday is a single day in November. But in the context of the shopping season, deals and discounts already start pouring in at the beginning of the month. Stores then gradually increase discounts, which end up peaking on the day of the event.
For obvious reasons, things were a little different in 2020. Black Friday stats reveal stores had skipped the gradual increase of discounts and opted for a sudden hit of deals to attract more customers. In recent years, many retailers started launching their Black Friday sales on Thanksgiving afternoon. But in 2020, some did it as early as October — not only to lure in customers but also to boost their revenue in a year full of financial hardships.

Barry is a lover of everything technology. Figuring out how the software works and creating content to shed more light on the value it offers users is his favorite pastime. When not evaluating apps or programs, he's busy trying out new healthy recipes, doing yoga, meditating, or taking nature walks with his little one.