
Board Game Statistics 2023 by Users, Revenue, Monthly Visit, Buying Habit and Referral

Page Contents
- Introduction
- Editor’s Choice
- Facts About Board Games
- What You Can do in Board Games?
- General Board Games Statistics
- Board Games Revenue Statistics
- Top Board Games Sites Statistics by Monthly Visit
- Board Games Playing Frequency Statistics
- Board Games Statistics by Gamers' Buying Habit
- Board Gamer's Age Statistics
- Buying Board Games Statistics
- Board Games Popularity Statistics by Generation
- Playing Habit Statistics
- Board Games Statistics by Referral
- Board Games Market Size Statistics
- Board Games Statistics by Demographics
- Spending Per Year on Board Games
- Playing Board Games Statistics by Reasons
- Board Games Statistics by Traffic Source
- Game Board Market Segment Statistics
- Board Game Statistics by Types
- Board Game Downloads Statistics by Continent
- Board Game Fan Statistics
- Popular Board Games in Major Cities of The United States
- Top Countries with Daily Active Players of Board Games in Q4 2022
- Conclusion
Introduction
Board Game Statistics: The report says that the revenue of the Board Games Industry is expected to reach $4.84 billion by the year 2027 which represents an annual growth of 9.31% CAGR starting from 2022-27. A board game is a game those are played with some moving pieces on a board, for example, Chess, Checkers Carrom, Ticket to Ride, Scrabble, etc. As the world is developing technologically along with gaming-oriented laptops and PCs mobile devices have become more compatible and easy with many board games facilities today across the world. Some important statistics from various aspects will shed light on why and how Board Games are becoming so trending.
Editor’s Choice
- As of 2022, the total revenue projected in Board Games Industry around the world was $2.93 billion and alone the United States has generated $1.89 billion
- In 2023, the market value of board games is supposed to reach above $12 billion with revenue of $3.63 billion.
- The board game app market is segmented into two In-app purchases and Paid app purchases, in which the revenue of In-app purchases in 2022 was $1,788 million and Paid app revenue turned out to be $50.47 million.
- In 2022 the total board game downloads had reached 4.85 billion in number across the world and 321 million in the United States.
- As of 2023, per download of board games, the average revenue earned is expected to be $0.60.
- Over the industry of board games, the revenue earned by advertising was $1,087 million across the world and $708 million in the U.S., in 2022.
Facts About Board Games
- In the United States Chess remained the best-selling board game in 2022-23 with 3 million annual sales.
- The board games were mainly popular among Gen Z 38% which is the age group of 25 – 54 years old people.
- In between 2023 to 2030 the fastest board gaming market is going to be North America with a CAGR growth of 12.29%.
- In 2022, the prominent share of the board game industry was also North America holding a market growth of 28.88%.
- In 2022, the market of board games in the Asia Pacific was around $5.38 billion.
- On the Board Game Geek website, there were approximately 140,000 games available.
- The annual market volume of board games is going to reach $4.84 billion across the globe but $2.87 billion in the United States by the end of 2027.
- The popularity of board games mainly increased from the time of the pandemic and post-pandemic.
- In tabletop gaming, a gamer spends around 1 – 3 playing hours per week.
What You Can do in Board Games?
- There are different varieties of board games and playing such games brings people closer across regions.
- Board Games allow players to increase their brain functions, allow enhance essential cognitive skills such as problem-solving capabilities, strategic thinking, and decision-making processes.
- If people have less patience, then can go with board games because to win in such games players need to implement proper strategy, creativity, and patience.
- If feeling unhappy, then board games keep players stress-free and happy.
General Board Games Statistics
- Every year newly produced board games around the world are approximately 3500 and it number will continue to rise in the coming days.
- The overall board game market by the end of 2030 will reach $37.82 billion.
- As of the survey, a single person plays almost 1 to 25 board games on average.
- Over the world in 2022 the largest board games market was the United States because the revenue generated by the single nation was $1.75 billion.
- The revenue change of the industry will be 16% in 2023.
- As of 2023, the variations of board games are tabletop, collectible, card and dice, miniature, and role-playing games.
- American people mostly preferred tabletop board games which are in more demand for the European style.
- On a yearly basis, around 41% of overall gamers buy 5 to 10 games by the end of 2022.
- It is expected that in 2025 the market of board games in the Asia Pacific will turn out to be $ 4 billion.
- Strategy board games have covered the largest market share by 69% which includes Chess, Catan, and Monopoly.
Board Games Revenue Statistics
- Global board game revenue stood at $3.13 billion in 2022.
- The market witnessed an increase to $3.63 billion in revenue in 2023.
- Projections for 2024 indicate a further rise to $4.07 billion.
- By 2025, revenues are expected to reach $4.40 billion.
- The upward trend is predicted to continue, with 2026 revenues forecasted at $4.67 billion.

(Source: trinity-core.com)
Top Board Games Sites Statistics by Monthly Visit
- U.gg leads with the highest monthly visits at 31 million.
- Kickstarter.com follows with 21.4 million monthly visits.
- Boardgamegeek.com attracts 14.8 million visits a month.
- Dndbeyond.com receives 14.5 million visits each month.
- Humblebundle.com has a monthly visitation figure of 11.1 million.
- Dnd5e.wikidot.com sees 7.2 million visitors monthly.
- Dropout.tv garners 5.1 million visits per month.
- Tabletop.events is frequented by 318,600 visitors each month.
- Shutupandsitdown.com has a monthly visit count of 153,000.
- Boardgame-online.com rounds out the list with 79,600 monthly visits.
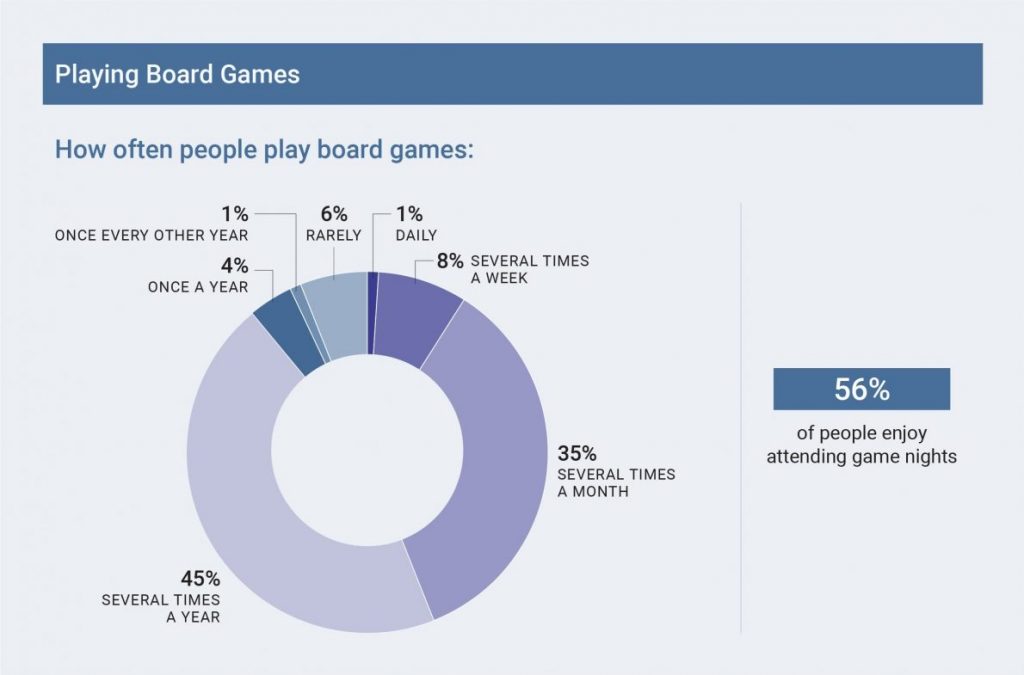
Board Games Playing Frequency Statistics
- 6% of board game players engage in playing daily.
- A weekly play frequency is reported by 25% of players.
- The highest frequency noted is a few times a week, constituting 43%.
- Playing once a month is noted by 6% of the player base.
- Twice a month playing frequency is reported by 17% of players.
- Those playing less frequently, less than twice a month, make up 3%.
Board Games Statistics by Gamers' Buying Habit
- 9% of gamers report purchasing between 76 to 100 games.
- 22% of gamers buy between 26 to 50 games.
- A segment constituting 24% of gamers acquire more than 11 games.
- A slightly larger group, 27%, buy more than 30 games.
- The largest single group, 35% of gamers, buy 4 games or less.
- 41% of gamers tend to purchase between 5 to 10 games.
- The majority, at 57%, buy between 1 to 25 card and board games.
Board Gamer's Age Statistics
- As of 2022, in the United States, high school diploma = 27.9%
- Completed college without degree = 14.9%
- Without a high school diploma or equivalent degree = 8.9%
Buying Board Games Statistics
- 88.44% of board game purchases occur at local game stores.
- Amazon accounts for 59.3% of board game sales.
- Kickstarter is the platform of choice for 41% of consumers buying board games.
Board Games Popularity Statistics by Generation
- Millennials, aged 27 to 42 years, show a 76% popularity rate for board games.
- Gen X, individuals aged 43 to 58 years, have a 68% affinity for board games.
- Baby Boomers, between the ages of 59 and 68 years, reflect a 70% popularity figure for board games.
- Gen Z, the youngest demographic group aged 11 to 26 years, leads in popularity with an 82% rate.
- The Silent Generation, those aged 77 to 95 years, also show a significant preference for board games at 67%.
Playing Habit Statistics
- 40% of board game players typically play from home.
- Playing at game stores is preferred by 33% of players.
- 25% of players engage in board games at restaurants.
- A notable 55% of board game players have played while consuming alcohol.
 (Source: printninja.com)
 (Source: solitairebliss.com)
Board Games Statistics by Referral
 (Source: similarweb.com)
- YouTube leads in social media referrals for board games with a rate of 57.51%.
- Facebook follows as a referral source at 15.63%.
- Reddit contributes 8.14% to board game referrals.
- WhatsApp accounts for 4.28% of social referrals.
- VKontakte is close behind with a 4.27% referral rate.
- Referrals from other platforms make up 10.17% of the total.
Board Games Market Size Statistics
 (Source: technavio.com)
- The market size of global board games was estimated to grow by 7.55% of CAGR from 2022 to 2027.
- In 2023 the year-over-year growth rate of the board games market increased by 7% from the previous year.
- The annual market size of the board games by 2027 is going to be $342.69 million.
Board Games Statistics by Demographics
Engagement Level by Gender:
- 38% of female players reported enjoying board games the most.
- A higher percentage of male players, at 72%, enjoyed board games the most.
- For those who enjoyed board games to a certain extent, females made up 42%, while males accounted for 46%.
Preference by Generation:
- Millennials and Gen Z are very fond of board games, both at 38%.
- Gen X shows a substantial interest at 34%.
- Baby Boomers also enjoy board games, with 29% being very fond of them.
Spending Per Year on Board Games
- 22% of players spend $1000 or more annually on board games.
- 21% of players' annual spending falls between $600 to $1000.
- The $200 – $399 spending range includes 19% of players.
- 16% of players spend between $400 to $599 each year.
- 15% allocate $100 to $199 on board games yearly.
- A smaller group, 6% of players, spend less than $100.
- Only 1% of players reported never spending on board games.
Playing Board Games Statistics by Reasons
- 70% play board games to spend quality time with family.
- 65% play to enjoy time with friends.
- The mental challenge attracts 56% of players.
- Competitive aspects of board games are enjoyed by 49% of players.
- 45% find board games to be great fun on a budget.
- Playing board games provides relaxation for 43% of players.
- 42% use board games as a way to spend quality time with significant others.
- Interaction with new people is a reason for 18% of players.
- 14% enjoy playing board games during power cuts.
Board Games Statistics by Traffic Source
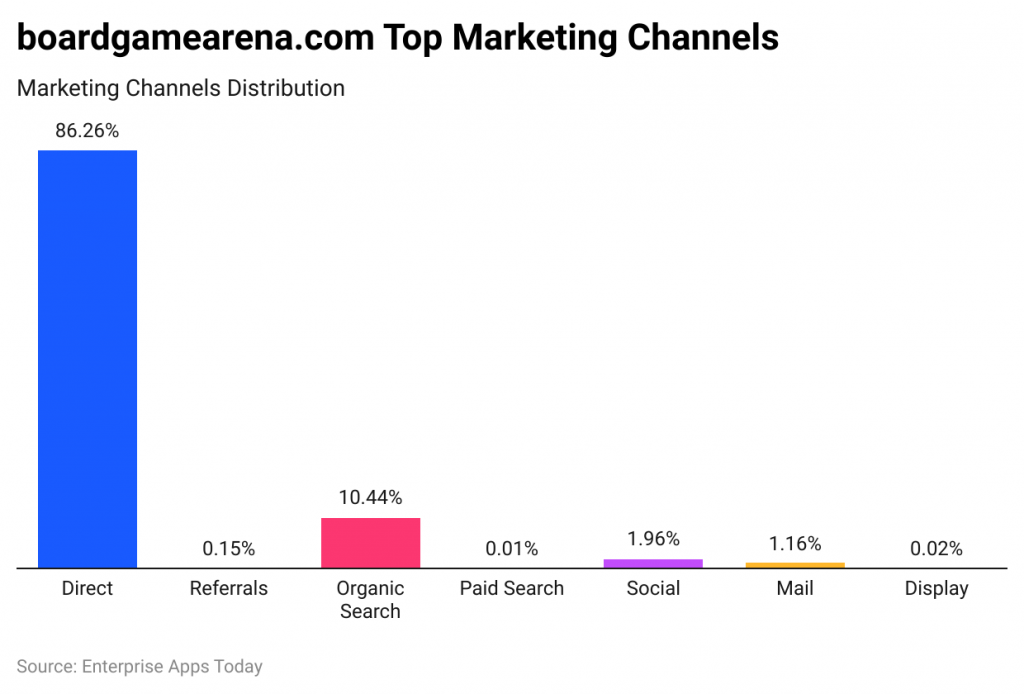 (Source: similarweb.com)
- The boardgamearena.com is the number 1 platform for online board games as of 2023
- As per Board Games statistics, the rate of traffic towards boardgamearena.com is by organic search resulting in 10.44%.
- 26% is direct traffic while 0.15% is from referrals of social media.
- On the other side, traffic sources are paid search (0.01%), Social (1.96%), Mail (1.16%), and Display (0.02%).
Game Board Market Segment Statistics
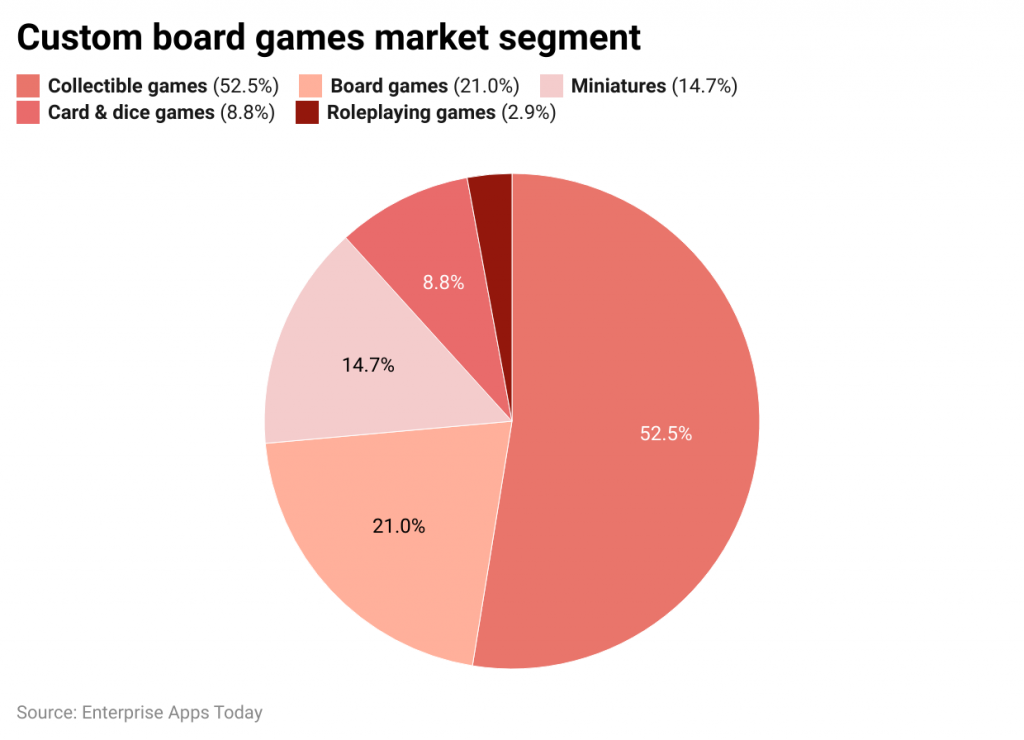 (Reference: marketsplash.com)
- The overall market size for board games globally reached $15.1 billion.
- Collectible games held the largest market segment at 52.5%.
- Miniatures constituted 14.7% of the market.
- Traditional board games accounted for 21% of the market share.
- Card and dice games represented 8.8% of the market.
- Role-playing games made up a smaller portion, at 2.9%.
Board Game Statistics by Types
- In 2022 across the global board games industry the largest game type was puzzle games which generated nearly $6.9 billion in revenue.
- The educational board games segment with 41% market share.
- 26% market share was captured by the strategy and war board game theme segment.
- The tabletop games which were holding a market share of 23%.
- From the offline global board games top revenue earners have captured 54% of market share by the end of 2022 and the rest from online.
Board Game Downloads Statistics by Continent
- Africa saw 34.49 million board game downloads.
- The American continent reached a significant 0.81 billion downloads.
- Asia led with a substantial 3.53 billion downloads.
- Australia and Oceania had 19.72 million downloads.
- The Caribbean region accounted for 10.68 million downloads.
- Central and Western Europe tallied 200.10 million downloads.
- Eastern Africa was on the lower end with 0.58 million downloads.
- Eastern Asia had a high number of downloads at 2.34 billion.
- Eastern Europe reported 81.50 million downloads.
- Europe overall achieved 0.45 billion downloads.
- North America contributed a significant 0.44 billion downloads.
- Northern Africa had 20.82 million downloads.
- Northern Europe accounted for 18.32 million downloads.
- South America had 359.40 million downloads.
- Southeast Asia saw 165.20 million downloads.
- Southern Africa had a lower download count at 10.43 million.
- Southern Asia recorded 0.97 billion downloads.
- Southern Europe had 151 million downloads.
- Western Africa reported 2.67 million downloads.
- Western Asia saw 56.94 million downloads.
Board Game Fan Statistics
- In 2022, 10.9% of American gamers owned more than 100 board games.
- Board games remained very enjoyable for 34% of people in the U.S.
- A further 44% found them somewhat enjoyable.
- A smaller group, 11%, didn’t find board games very enjoyable.
- 7% did not enjoy board games at all.
- A minority of 4% had no opinion on the enjoyability of board games.
Popular Board Games in Major Cities of The United States
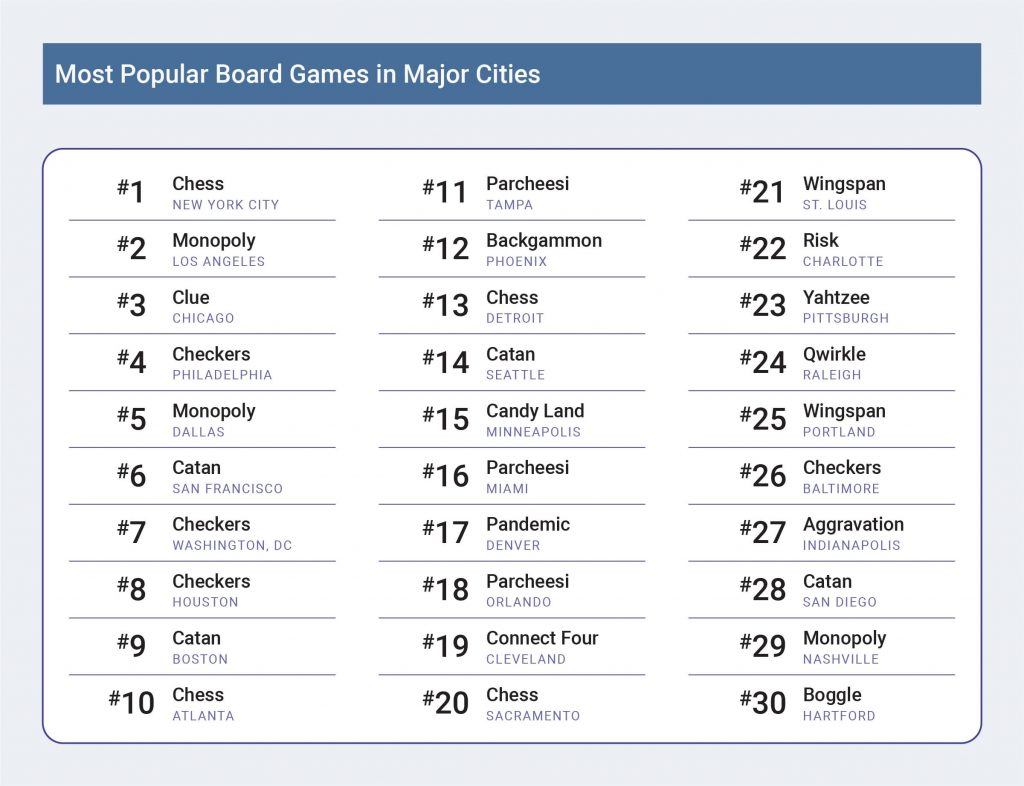 (Source: solitairebliss.com)
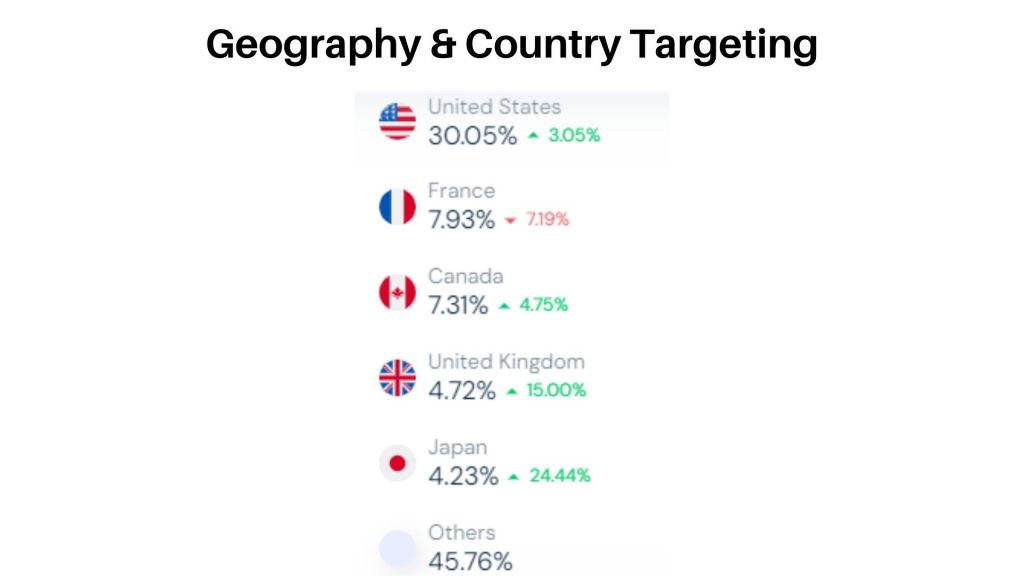
Top Countries with Daily Active Players of Board Games in Q4 2022
 (Source: similarweb.com)
- The United States of America led with 30.05% of total traffic and experienced a growth of 3.05% in website visitors.
- France contributed 7.39% to total traffic, witnessing a decline of 7.19%.
- Canada accounted for 7.31% of total traffic, with an increase of 4.75%.
- The United Kingdom held a 4.72% share, with a substantial rise of 15%.
- Japan represented 4.23% of traffic, with a notable increase of 24.44%.
- Combined traffic from other countries equaled 57.74%.
Conclusion
As of now after completing the article on Board Games statistics, it is clear that the popularity of Board Games is spread across every continent. During the days of the pandemic, people got more connected with these games and become and currently have millions of active users. Online board games have started earning billions of revenue in the previous 2 years than offline games, which was possible because of enhanced technological support within the gaming industry.
Hopefully, the above-provided statistics will help in understanding the article better.
Sources
FAQ.
According to Board Game Statistics, the United States buys the most board games worth $4.4 billion is the largest nation across the world, and also generates the highest revenue by $1,754 million by the end of 2022.
Travelers’ Tour was a simple map movement game that was the oldest board game in America and was played since 1822. On the other side in 2023, the most popular board game played are Dungeons & Dragons, Chess, Backgammon, and Codenames.
Roll-and-moves, Snakes & Ladders, Goose game, Pachisi, etc.
The popular games in 2022 are Monopoly, Chess, Pandemic, Carcassonne, Catan, 7 Wonders, and Dominion.
Yes, you can play Board Games offline, but some games require an internet connection.

Barry is a lover of everything technology. Figuring out how the software works and creating content to shed more light on the value it offers users is his favorite pastime. When not evaluating apps or programs, he's busy trying out new healthy recipes, doing yoga, meditating, or taking nature walks with his little one.