
Business Intelligence Statistics – By Intelligence Industry, Vendors, Concerns, Importance, Sectors using BI

Page Contents
- Introduction
- Editor’s Choice
- What is Business Intelligence?
- Types of Business Intelligence Tools and Applications
- Benefits of Using Business Intelligence
- General Business Intelligence Statistics
- Business Intelligence Statistics by Intelligence Industry
- Business Intelligence Statistics by Vendors
- Business Intelligence Statistics by concerns
- Business Intelligence Statistics by Importance
- Business Intelligence Statistics by Sectors Using BI
- Conclusion
Introduction
Business Intelligence Statistics: Globalization has made companies stretch their legs to international boundaries. Altogether their overall business has increased making it manually difficult to perform some of the marketing as well as business-related activities. Be it a small-scale or large-scale business, the data is a must to understand the overall business environment and its standing in the market. The raw data is extremely large that it is impossible to pick out the exact needed information and land on decision. This is when Business Intelligence (BI) comes into play. Today, more than 50% of companies are using this technology as identified in Business Intelligence Statistics.
Editor’s Choice
- By 2028, it is estimated that the mobile business intelligence market will reach $34.2 billion at a CAGR of 19.57%, whereas the software market will touch $17.4 billion at a CAGR of 17.4% by 2027.
- 90% of the R and D units regard business intelligence as critical for future business activities.
- Companies that have supporting data-driven decisions by CEOs are 77% more likely to succeed in business.
- As of 2023, the global business intelligence market is valued at $29.42 billion and it is expected to grow to reach $54.27 billion at a CAGR of 9.1% by 2030.
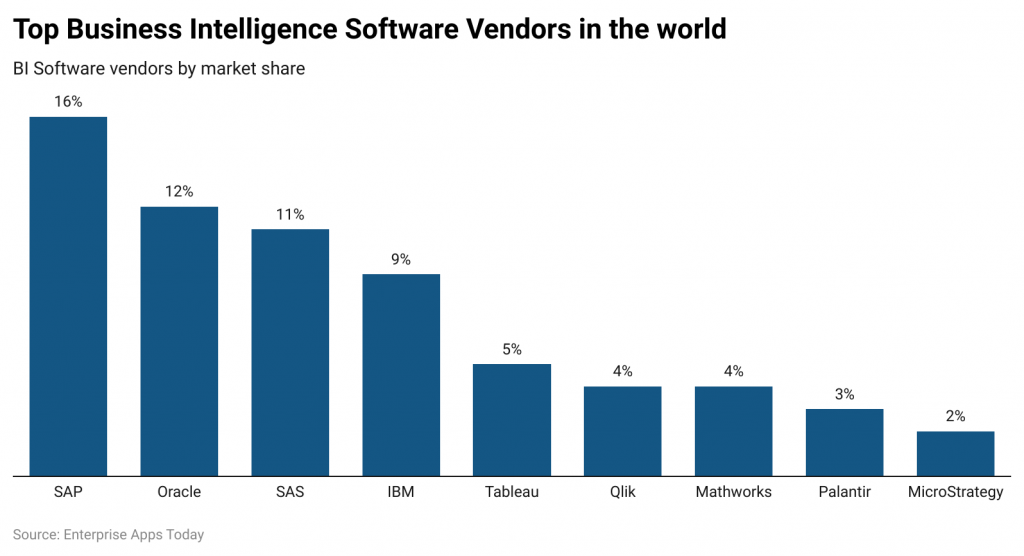
- As of 2022, the top three Business Intelligence Software vendors were SAP, Oracle, and SAS which captured a respective market share of 16%, 12%, and 11%.
- 6% of Fortune 1000 companies are considering increasing their investments in big data and AI concepts.
- United States of America has the world’s highest BI tools adoption rate resulting in 30.9% while being the most significant source for BI revenue with a prediction of $13.15 billion in 2023.
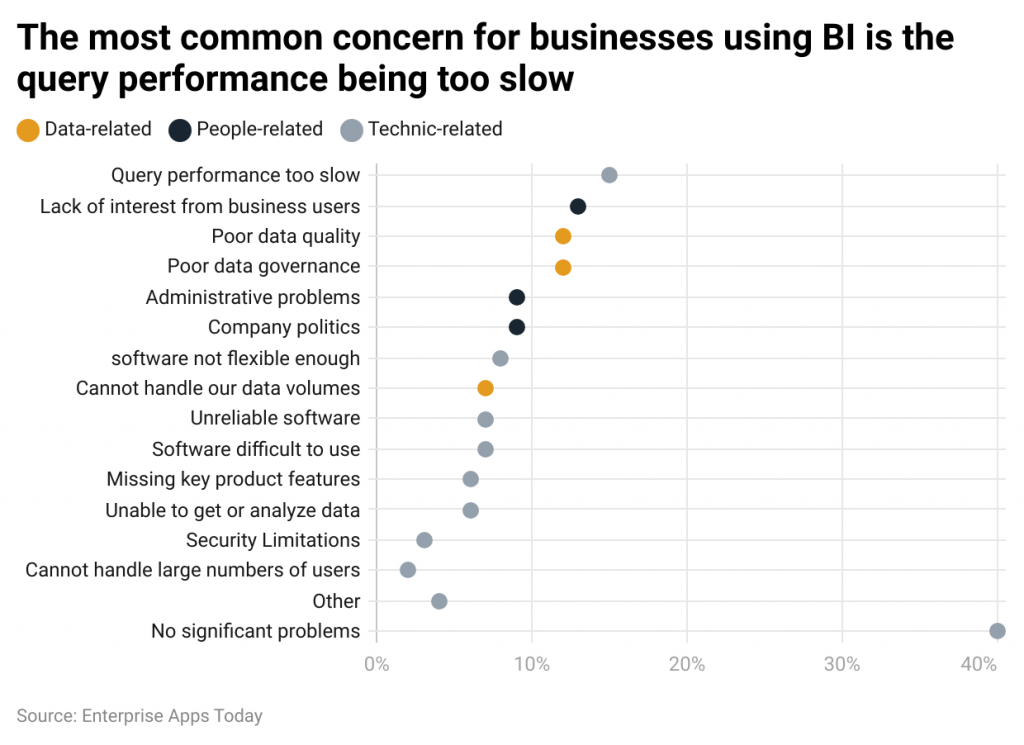
- The topmost concern related to technical BI stated by businesses is extremely slow query performance.
- By 2023, according to Business Intelligence Statistics, 40% of the enterprise workloads will be uploaded to the cloud.
- 4% of the companies stated BI adoption is challenging, while 37.8% said they have managed to create a data-driven business added by 26.8% of companies to successfully build a data culture.
What is Business Intelligence?
In simple terms, business intelligence is crucial data that is gathered and used to make decisions about the company to lead the product. In earlier days, collection, analysis, and turning of the information into graphics and charts were manually performed. However, since the development of software, once the raw information is given to the BI it comes out as final data, thus increasing the speed of decision-making. This provides accurate results and maps out the hidden trends in the market as well. Some of the elements of BI include:
- Data Mining: Analysing large quantities of data to understand patterns and trends to increase the market value of the business.
- Performance benchmarking: Compares the performance of the company’s product to its competitors. Aids in making data-driven decisions.
- Business Process Analysis: Understand the company’s performance as well as pinpoint its actions where improvement is lacking.
- Descriptive Analysis: Rather than analyzing entire quantitative data it only focuses on specific elements.
Types of Business Intelligence Tools and Applications
- Location Intelligence (LI) – This type of tool allows users to analyze the geospatial data as well as location which features map-based visualization functionality. This study helps companies to understand the location and further decision-making in logistic management, and site selection for corporate facilities and retail stores.
- Embedded BI – These tools allow users to understand the functionality of business applications. This analyzes the data within the applications being used by the employees to perform their job activities.
- Collaborative BI – As the name suggests, it is the combination of BI applications and collaboration tools that allows various users to work together for data analysis as well as share the information or findings with one another, such as adding comments, highlighting, questions, and using discussion tools or online chat.
- Real-time BI – Real-time BI is useful for understanding the current state of customer behavior, business operations, the financial market, and much more. This tool provides up-to-date and processed information in the form of streamed data, for example, targeted promotional offers, credit scores, etc.
- Operational Intelligence (OI) – OI is also known as operational BI, and it aids in faster decision-making. This tool is used to aid frontline managers. For example, call center agents.
- Open Source BI (OSBI) – This tool includes two types such as subscription-based support and free-of-charge service based on community edition.
- Software as a Service BI – SaaS-based BI applications are hosted by sellers on cloud computing systems. It is also known as cloud BI, and Sofware as a Service BI enables multi-cloud support.
- Ad hoc Analysis – One of the basic elements of modern BI applications is known as Ad hoc analysis or hoc querying. It offers self-service BI tools. It is aided in writing and running queries to analyze a particular business issue. These queries run regularly and show up on dashboards and reports.
- Online Analytical Processing (OLAP) – Online Analytical Processing is one of the early Business Intelligence technologies. This application is useful for analyzing multiple dimensions of the given data. It is widely suited for complex calculations and queries.
- Mobile BI – Mobile BI is used to create applications and dashboards suitable for tablets and smartphones. These are always created with easy-to-use options.
Benefits of Using Business Intelligence
- Improved and faster business decision-making
- Accurate reports and findings
- Enhanced customer satisfaction
- Improved employee productivity
- Flexibility in business processes
- Market trends recognition
- Exploration of new markets
- Identification of extra revenue sources
- Forecast of future performance
- Competitor analysis
General Business Intelligence Statistics
- As of 2023, the global business intelligence market is valued at $29.42 billion and it is expected to grow to reach $54.27 billion at a CAGR of 9.1% by 2030.
- Companies that use business intelligence are 5 times more likely to land faster decisions as compared to those that do not.
- Poorly analyzed data can lead total American businesses to losses valued at more than $109 billion every year while it comes to $3.1 trillion for the US economy.
- Companies that have supporting data-driven decisions by CEOs are 77% more likely to succeed in business.
- According to Business Intelligence, 74% of them are either unhappy or overwhelmed while working with data.
- By the end of 2023, more than 33% will adopt decision intelligence for designing, modeling, composing, aligning, executing, monitoring, and applying decision models and processes.
- Around the world, 2 out of 3 employees have access to business intelligence tools resulting in 75% of general usage of data analytics software.
- On average, companies use 4 or more various business intelligence tools.
- 90% of the R and D units regard business intelligence as critical for future business activities.
- More than half of the software companies around the world use BI tools, while the percentage results in 52% for finance companies.
- In 2023, one of the fastest-growing BI segments is could cloud-based business intelligence market.
- 70% of companies around the world believe that data discovery and visualization are crucial for business growth.
- 47% of the IT managers stated that they have their data warehouses in the public cloud.
- By 2028, it is estimated that the mobile business intelligence market will reach $34.2 billion at a CAGR of 19.57%, whereas the software market will touch $17.4 billion at a CAGR of 17.4% by 2027.
- Furthermore, the embedded analytics market is projected to reach $77.52 billion by 2026.
- 55% of small-scale companies use data to improve efficiency while 47% use it for customer interactions and 47% of businesses use it for predicting business decision outcomes.
- The global BI adoption rate has reached 26%.
- 4% of the companies stated BI adoption is challenging, while 37.8% said they have managed to create a data-driven business added by 26.8% of companies to successfully build a data culture.
- 88% of the employees who work with data are still working with spreadsheets to manage data activities.
- 6% of Fortune 1000 companies are considering increasing their investments in big data and AI concepts.
- Once ERP systems are implemented in businesses, they can observe a 40 to 60% improvement in their process efficiency.
- 95% of enterprise software sellers believe that cloud BI is essential.
- United States of America has the world’s highest BI tools adoption rate resulting in 30.9% while being the most significant source for BI revenue with a prediction at $13.15 billion in 2023.
- Moreover, BI Statistics state that, as of today, 66% of US healthcare providers have embraced predictive analytics in Business Intelligence.
- Around the world, the adoption of BI Predictive Analytics in the healthcare industry in various countries is predicted as follows: Singapore (93%), China (79%), USA and Brazil (66%), Germany (54%) and South Africa (33%).
- Around the world, 70% of the data created by companies goes unused.
- By 2023, according to Business Intelligence Statistics, 40% of the enterprise workloads will be uploaded to the cloud.
- The average spend on every employee in 2023 for Business Intelligence Software is estimated at $7.39.
- As of 2022, North America was the leading BI market with a share of 30.9%.
Business Intelligence Statistics by Intelligence Industry
- Manufacturing industries are said to be the highest shifting companies toward cloud BI solutions at a rate of 58%.
- Financial institutions including retail and education institutions are the top record-keeping organizations that are adopting business intelligence.
- The most benefited industries from BI tools are HR, fashion, retail, marketing, and telecommunications.
- By the end of 2023, 87% of airports around the world will explore BI.
- By 2026, it is expected that the Healthcare BI will reach $22.1 billion at a CAGR of 24.5%.
- Between 2021 and 2026, the real-time analytics and streaming data processing in BI is expected to grow at a CAGR of 23.2%.
- Furthermore, the data governance market is expected to reach $6.8 billion by 2026 at a CAGR of 21.3%.
- The natural Language Query (NLQ) is projected to reach $4.5 billion at a CAGR of 23.7% by 2026.
Business Intelligence Statistics by Vendors
 (Source: financesonline.com)
As of 2022, the top three Business Intelligence Software vendors were SAP, Oracle, and SAS which captured a respective market share of 16%, 12%, and 11%. Other vendors that tailed the list were IBM (9%), Tableau (5%), Qlik and Mathworks (4%), Palantir (3%), and MicroStrategy (2%).
Business Intelligence Statistics by concerns
 (Source: founderjar.com)
The topmost concern related to technical stated by businesses is extremely slow query performance. While it is a lack of interest from business users related to human resources concerns, and data-related concerns for poor data quality.
Business Intelligence Statistics by Importance
 (Source: techreport.com)
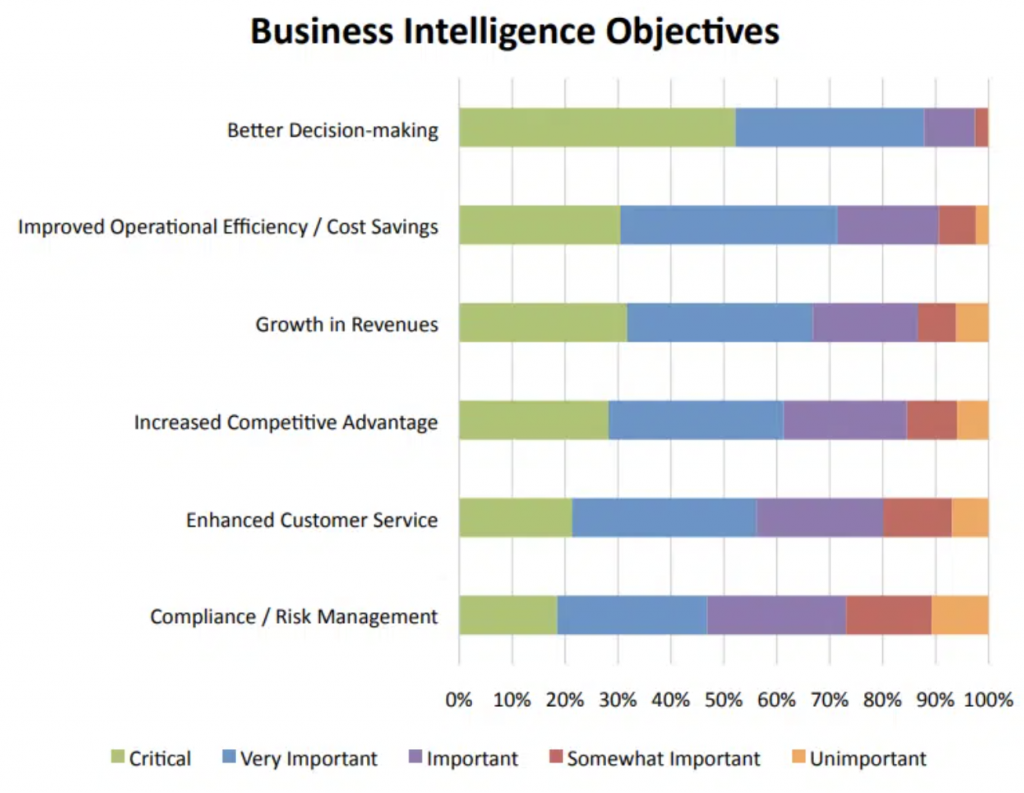
As of 2023, majority of the businesses give importance to Business Intelligence in the sense of better decision-making, growth in revenues, cost savings, enhanced customer service, increased competitive advantage, and risk management. The most crucial factor that has gained importance by more than 50% of companies is better decision-making, followed by growth in revenues and cost savings.
Business Intelligence Statistics by Sectors Using BI
![]() (Source: vpnalert.com)
(Source: vpnalert.com)
As of 2023, the top three sectors where BI is always utilized are Operations (30%), Executive Management (27%), and Finance (27%). Whereas R and D, Human Resources and Manufacturing reported it only at 9%, 2% and 8 % respectively.
Conclusion
Manual work has been replaced by technology. Since the launch of ChatGPT, there have been multiple positions that are at risk. Giving data to ChatGPT can help you in making decisions. However, this is possible only for small-scale companies. Considering that large-scale companies have multiple data sets and n number of calculations. In such cases, Business Intelligence comes to the rescue and aids in faster decision-making. In short, BI can be aided in Reporting, Analysis, Monitoring, Predicting and Forecasting, and Predictive Modeling. Concluding, looking at Business Intelligence Statistics, how this technology is shaping the world has come to light.
Sources
FAQ.
Data Sourcing, Data Engineering and Analysis, Situation Awareness, decision making, and decision support, in other words, it is simply, Reporting, Analysis, Monitoring, Predicting and Forecasting, and Predictive Modeling.
Some of the top BI Tools to use in 2023 are Power BI, Oracle Analytics Cloud, Qlik, Spotfire, Domo, Dundas BI, and Tableau.
Trends in Business Intelligence observed in 2023 are Collaborative BI, Cloud connection, Data governance, and Augmented analytics.
The main purpose of business intelligence is to improve the company’s business operations utilizing relevant data. Considering a large amount of data, BI Tools helps in selecting the right datasets, analysis, prediction, and decision-making.
Business Intelligence is software that analyzes the data that has been collected by the user and further divides it into reports, dashboards, charts, and graphics. It helps in discovering market trends and landing on decisions speedily.

Barry is a lover of everything technology. Figuring out how the software works and creating content to shed more light on the value it offers users is his favorite pastime. When not evaluating apps or programs, he's busy trying out new healthy recipes, doing yoga, meditating, or taking nature walks with his little one.