
[2023 Updated] Customer Service Statistics, Facts And Trends
![[2023 Updated] Customer Service Statistics, Facts And Trends](https://www.enterpriseappstoday.com/wp-content/uploads/2022/07/Heading.jpg)
Page Contents
- Introduction
- Top Customer Service Statistic
- Statistics on Expectations of Customers
- Customer Success Statistics
- Good Customer Service Statistics
- Bad Customer Service Statistics
- Communication and Customer Statistics
- Service Channels
- Consumer Behaviour
- Customer Feedback
- Companies Strategies
- Customer Representative Statistics
- Miscellaneous Statistics
- Conclusion
Introduction
Customer Service Statistics: The importance of customer service in this fast-paced and digital world cannot be focused on enough. As competition is very high in this industry. So, to provide a solid experience for the clients is more essential than ever. Fortunately, there are various relevant customer service statistics that can help to understand the customer’s needs in a better way. A customer service to offer help to the customers before and after they buy something. This means that it applies to prospective customers to think about the purchase.
Good customer service is essential to grow the business. The following customer service statistics will depict the importance of customer services as part of brand image. It also includes marketing and sales. The mixture of all these aspects refers to one single poor customer service experience that can lead to loss of brand loyalty, customers, and sales.
Top Customer Service Statistic
- Support requests from customers have increased by 14% over the previous year.
- 81% of consumers say having good customer care will make them more likely to buy another product.
- 70% of a buying experience depends on the way the buyer is handled.
- Over 60% of consumers now trust companies to fulfill all of their demands.
- 61% of customers will switch to a competitor following having one unpleasant customer experience.
- Sixty-four percent of companies say they are able to see sales rise because of good customer service.
- 90 percent of customers will spend more if companies offer individualized customer support.
Statistics on Expectations of Customers
The customer will be conscious of the company's name. This is the beginning of the journey for customers. To keep customers loyal the business must be aware of their needs and that they are met.
Take a look at these retention statistics for customers to get a clear understanding of the needs of customers-
- A rise of 88% of consumers today are more optimistic than they ever have.
- About half (49 percent) of customers believe they're likely to be a frequent buyer after having a personalized shopping experience
- Around 80percent of business, executives claim that their customers spend more (34 percent more on average) when they experience an individual experience
- A substantial proportion (64 percent) of Baby Boomers are expecting customer support to be informed of information about the progress of their latest purchase
- Seventy-six percent of respondents expect uniform interactions between departments, but 54% of respondents believe marketing, sales, or customer service departments don't share details
- A staggering 70% of clients would like businesses to be aware of their specific desires and needs.
- A substantial number (76 percent) of customers would like to talk with a representative right away upon their first contact with a business
- Every industry fails to meet customer expectations by 38%.
- Expectations of the customer for ease grew from 11 percent to 90
- If a client has an issue, they'll expect
- An explanation of the reason why the issue arose (43 percent of customers)
- The money is returned (35 percent of customers)
- Repair or replacement of the product (31 percent of customers)
Customer Success Statistics
The success of the company is contingent on the success of its customers. Check out some of the customer satisfaction statistics to learn more about the success of the customer program and ways to improve it.
- Around 72% of companies have established strategies for customer success.
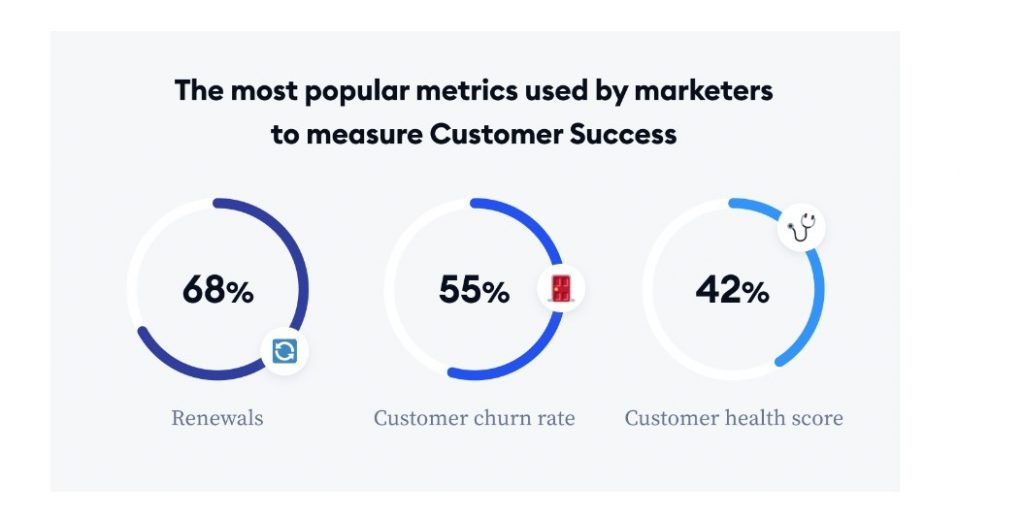
- The most well-known metrics used by marketers to assess customer satisfaction are the renewals of 68 percent of marketers, the customer churn percentage for 55% of marketers, and the health score for customers for 42% of marketers.
- Lifetime value is two less well-known ways to measure the effectiveness of customers.
- Around 57% percent of marketing professionals believe managing expectations from customers and assessing
- customer satisfaction is the most difficult challenge to overcome.
- Sixty-seven percent of marketing professionals agree that businesses are looking for predictive analytics for customer-success programs the most
- 87% of businesses think that the programs for customer success helped customers to adopt the services and products.
- The majority of marketers provide regular updates to customers as a part of their customer satisfaction program.
- A warm, friendly service is the key to success in the business for 48 percent of U.S. consumers
 (Source: tidio.com)
Good Customer Service Statistics
The excellent customer service statistics aid in determining the objectives. In order to implement the strategy
- Around 62% of B2B customers purchase more after positive customer service.
- In the case of 69% of customers, the speed at the point at which they were able to resolve their issue determines if the customer service was excellent
- Customer service that is good will change purchasing behavior for 87 percent of customers. This improves the long-term revenue that the company earns from them
- 92 percent of consumers are likely to make another purchase following having a positive experience
- A majority of customers (38 percent) declare that they'll purchase from a company they've had positive experiences with regardless of whether there are alternatives
- The top three industries that provide the highest quality services are Hospitality, Financial, and Food Services.
- Some of the most important factors in ensuring the quality of customer service include being treated as valued customers (for 65.2 percent of consumers) Agents who have a high level of knowledge or skills (55.3 percent of consumers) Quick service response (for 53.5 percent of consumers)
- Nearly half (49 percent) of U.S. consumers say companies have great customer service
- Customer satisfaction improves when companies include non-monetary solutions in addition in addition to relief from financial stress.
- 43% of respondents were content that a business only utilized the financial options
- 60% of respondents were happy when both non-monetary and financial solutions were utilized.
(Source: tidio.com)
Bad Customer Service Statistics
There can be a bad customer experience also. It can cause some adverse consequences for the business. To prevent it, you need to look at the statistics-
- About 96% of customers leave a brand due to bad customer experience.
- 60% of the customers stop purchasing from the brand due to unfriendly services.
- 66% of customers stop buying from a brand due to poor customer service experience.
- 79% of high-income people avoid brands for two years after a bad experience.
- To explain a problem to several people makes customer experience interaction bad for 72% of customers.
- 61% switch to the company’s competitors if a mistake is committed after receiving excellent service.
- Factors that influence poor customer service About 49% of customers are rude representatives which impacts poor customer service. 42% of the customers say not being treated like valued customers impacts the company’s bad customer service.
- 46% of customers stop doing business with a brand if employees do not have knowledge about the brand.
Communication and Customer Statistics
The companies are required to communicate with customers using the right channels at the appropriate frequency. Below are a few data to support this –
- The website is visited by 42% of the customers who browse the site
- 34% have made a purchase (40 percent of Millennials have purchased the product because of being able to communicate in the manner they like)
- 31% had a more favorable impression of the company.
- 17% of people referred the business to others.
- 15% have left an overall positive review
- 70% of customers have slapped a company because of the incorrect frequency or channel.
- 40% of clients who have not signed up
- 30 percent of consumers did not like the business.
- 19% of consumers quit doing business with the firm.
- 83 percent of consumers prefer using email for communications with businesses, however, for urgent messages, text messaging is more popular 2.5 times more
- Most people immediately want to receive communications related to a change of their plan (63%), delivery notifications (56%), and appointment reminders/confirmations (54%)
- The most crucial aspect to consider is the way customers interact with a company. About 54% can easily choose to not receive the message. Around 52% of them want to select the way they get messages.
- 94 percent of consumers are annoyed by the way businesses communicate with their customers.
- 41 percent of customers don't recall the moment they opted in.
- 7 in 10 people prefer to receive promotional messages every week or more
- Customers prefer to hear from businesses after lunch (39 percent of clients) while in the morning (32 percent)
(Source: tidio.com)
Service Channels
- Customers utilize various ways to seek assistance. Here are some stats to learn about customer satisfaction statistics-
- 98% of clients utilize FAQ, help center, or any other self-service online resource
- 74% of clients utilize different channels to complete an order
- The most convenient method of communicating for the majority of customers who are under 40 is via texting
- In the case of 66% of people older than 40, the simplest method to communicate is via phone and email.
- The majority of customers prefer email (88 percent) and telephone (80 percent) as their primary channels of engagement
- Social media (12 percent of consumers) and websites (10 percent of clients) are among the least popular customer engagement channels
- Companies are more likely to use email (88 percent of businesses) and telephone (80 percent of businesses) to communicate with current customers.
- Live chat and telephone support are the most popular customer service ratings (91 percent and 91% and 85% respectively) beating out help centers (83 percent) along with email service (82 percent)
- Computers or agent consoles are utilized to handle the majority (54 percent) of customer calls.
- 69% of users say they'd use an agent for issues that are simple which represents a rise of 23% from the previous year.
- Over 70% of clients want conversations with customer service when they contact companies.
- Over two-thirds of the people over 40 expect to engage in conversation with companies.
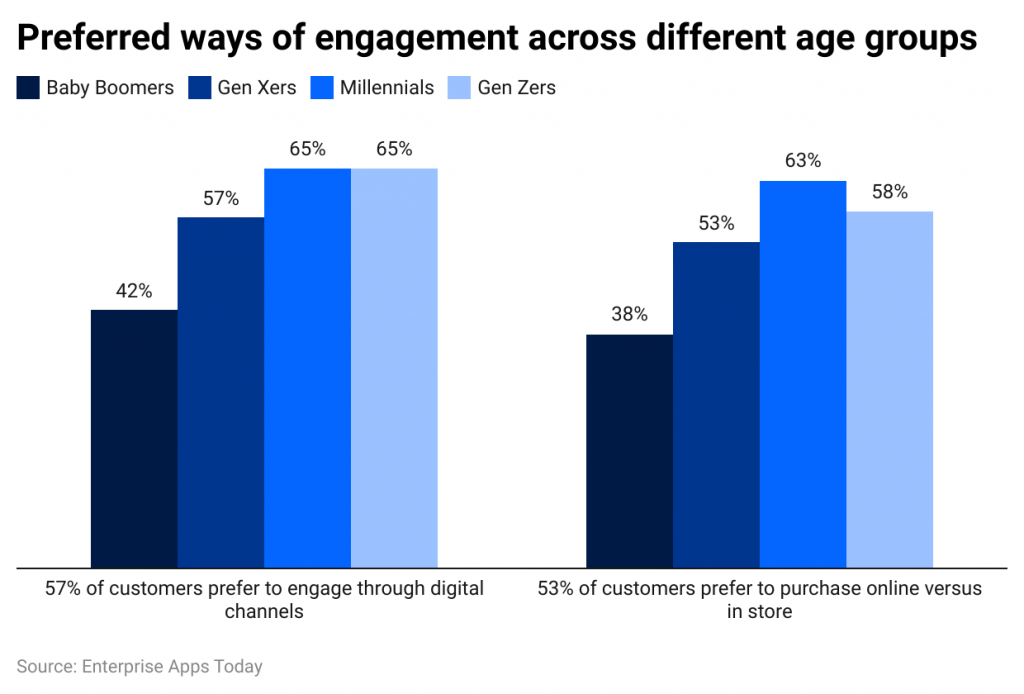
- 57 percent of customers would prefer interaction via digital channels, and 53% prefer buying products online rather than online. in-store
Consumer Behaviour
These are crucial statistics which will give you information on the behavior of consumers
- A majority of households encountered issues with customer service.
- 84% of buyers are likely to purchase from salespeople who know their needs.
- 34% of consumers decide to stop purchasing from a company whose service or product quality is declining.
- In 2022 59% of the customers were confident in the brands they worked with this is an increase of 2% when to the 2020 survey.
- The experience of one industry can influence the expectations of others for 62 percent of customers.
- A discount that is offered within an hour of having a conversation with a brand builds loyalty among 63 percent of customers.
- The reliability and durability of a product are reasons for loyalty in 92 percent of customers.
(Source: tidio.com)
Customer Feedback
People are willing to offer feedback to companies that are relevant to interact with. To receive customer feedback is essential to help enhance retention and provide the best experience possible for the clients. Some customer feedback with customer experience stats-
- 58% of customers felt like their complaint was ignored
- 30% of companies respond to customer feedback 59% of companies provide surveys Online customer service reviews influenced 88% of customers when making a buying decision
- 95% of customers share a bad experience with others (95%), and 87% share a good customer service experience
- 58% of customers are more willing to tell others about customer service experiences now than they were five years ago
- 85% of service professionals believe that customers are willing to share positive and negative experiences with others more than ever
- 48% of customers check reviews on social media when deciding on a product purchase
- 67% of customers recommend products or services to others after a great customer experience
- 73% of consumers only pay attention to reviews written in the last month
- 20% of customers expect a response within a day after writing a review or customers to get their feedback
Companies Strategies
What is the goal? It's always an excellent idea to research the best companies in the field. See how other companies spend money on customer support, to help improve your strategy.
- Companies that make use of APIs (Application Programming Interfaces) are 21% more efficient in solving customer problems.
- Companies using APIs have to spend 35% less time waiting around for answers
- Large companies are 42 percent more likely to provide training for customer service
- The top three business goals are to decrease the rate of churn to 66 percent, increase the use of the product by 65 percent, and boost renewal rates by 57 percent.
- Sixty-one percent of businesses don't reward customers for referring friends.
- Around 79% of businesses invest in the education of support personnel.
- 88% of people believe that businesses should employ people that reflect their communities.
- 75 percent of mobile workers believe the field operation should be connected with the core services of businesses.
- 40% of companies view customer service as an expense and a potential
- 37 percent are in the process of the introduction of conversational customer service.
- 34% of them have already implemented customer service via conversation as well and 14% preparing to introduce it in the coming year.
- 8 percent aren't interested in implementing a conversational customer service
Customer Representative Statistics
What should you do about customer service representatives is much more crucial. Look up the most important statistics on the subject to learn about the opinions of the people, their values, and desires to know.
- 97% of the employees who consider their businesses to be cool believe that they're transparent, but only 64% of customers who view their company as transparent see them as cool.
- 80 percent of customer service agents appreciate the mission of their company 88% of them believe their work is essential.
- Quality and speed are equally important to 68% of service reps.
- 77% of businesses view service agents as advocates for their customers.
- Based on 89% of service reps they will be utilized for customer service. In fact, 76 percent of service representatives use the phone to handle complex cases.
- Sixty-eight percent of the agents are more content when they assist clients with difficult issues.
- The three essential qualities required by staff of customer service and support include listening communicating, as well as knowledge of the product.
- Just 10% of service workers would like to quit their service jobs in the next 5 years.
- 43 percent of agents and 51% of high-growth and low-growth firms reported that their greatest challenge is a lack of time to work.
- The top priorities for service teams in terms of customer experience tools are
- Automated ticketing systems to remove the need to filter
- Chatbots, knowledge bases, and other tools that can assist clients in answering questions
- CRM software can help simplify the management of customers
Miscellaneous Statistics
- 67 percent of the customer support team is proactive in reaching out to the customers.
- Generation Z as well as millennials are the ones who buy new products.
- A higher retention rate for customers leads to a 25% rise in profit.
- The average customer who is a repeat buyer is 67% higher than the number of months of their relationship over the first-time purchasers.
- 30% of customers quit websites when they are unable to locate what they are looking for, and they also leave shopping carts.
- The majority of businesses think they provide top services, but less than 8% of businesses have customers who are in agreement.
- Support and customer service is 49 percent market research is 37%, and marketing is 35 percent. These are the most effective areas for taking action in relation to customer service.
- In the case of 71% of clients, employees play a major impact on the experience of customers.
- 88% of service teams have common goals and goals with sales teams.
Conclusion
In light of the latest customer service stats, it is clear that customer expectations include various important changes. It also imposes challenges for various businesses to keep up the pace. There is clear data also backed up. A multi-layered effect is there that provides excellent customer service. Efforts and resources need to be put into recruitment, development, and training of the customer service staff to run a successful business. It will result in much more happy customers.
Sources
FAQ.
We can improve it by building a user-friendly customer support service, use of advanced technology to remember the customer details, to give priority to complaints and pre-sale actions.
The investment in customer experience is important to retain customers and drive growth
The key trends include AI integration, personalized services, self-service options, and the rise of messaging applications.
Yes, awesome customer service leads to customer satisfaction. This further increases customer loyalty.

Barry is a lover of everything technology. Figuring out how the software works and creating content to shed more light on the value it offers users is his favorite pastime. When not evaluating apps or programs, he's busy trying out new healthy recipes, doing yoga, meditating, or taking nature walks with his little one.