
30+ Most Shocking Employment Discrimination Statistics For 2023: The Employment Discrimination Situation In The United States
Page Contents
Employment Discrimination Statistics: From receiving lower pay to harassment, marginalized groups frequently experience employment discrimination within the workplace. However, these practices are now more punishable and less acceptable. It is now possible to take legal action against workplace discrimination.
Employment discrimination stats help workers understand what is happening within the workplace across the globe. The more knowledge you have, the better you can make judgments regarding your future. Be aware that you are not the only one facing difficulties if you think you may have a case for workplace discrimination. This article will discuss the most important employment discrimination facts and statistics.
Let's get into some of the recent employment discrimination statistics.
Surprising Employment Discrimination Statistics (Editor's Choice)
- Discrimination based on disability, sex, race, or retaliation approximates over 30% of all charges.
- Retaliation is one of the most prevalent discrimination claims, with nearly 37,632 cases filed in 2020.
- The least common type of claim is the genetic information claim, with roughly 440 complaints in 2020.
- 61% of workers in the United States have witnessed or experienced workplace discrimination.
- In 2020, the EEOC filed around 93 discrimination claims and solved nearly 165 merits cases.
- Around 22.1% of equal-pay complaints result in a resolution, which is higher than the other types of discrimination cases filed.
- Employers paid approximately $484 million in case settlements to discrimination victims in 2021.
- The success rate for racial discrimination claims is the lowest, at only 15%.
- The most prevalent type of discrimination claim is retaliation, which accounts for 56% of all types of claims.
- According to Employment Discrimination Statistics, 66% of employees aged 45 years and above are more likely to experience discrimination.
- 61% of the Gen Z employees stated that they would engage in company activities and be more productive if the company addressed social issues.
- In terms of the income gap, women in the hospitality industry earn 79 cents for every dollar earned by men.
- Furthermore, as shown by Employment Discrimination Statistics candidates with disability are 25% less likely to receive any job offer.
- 75% of the black background respondents in a survey experienced discrimination in their workplaces.
- The highest level of gender discrimination is faced by C-Suite level positions resulting in 31%, followed by director (26%) and manager (23%).
By Type Of Discrimination
Employees can be discriminated against for many reasons. The range of claims and cases can include discrimination based on age, race, or another factor. Generally, when talking about different kinds of discrimination, our research demonstrates that:
#1. Discrimination based on disability, sex, race, or retaliation approximates over 30% of all charges.
The most prevalent type of discrimination claim is retaliation, which accounts for 56% of all types of claims. The other 3 are also common: sex at 31.7%, race at 32.7%, and disability at 36.1%.
#2. Retaliation is one of the most prevalent discrimination claims, with nearly 37,632 cases filed in 2020.
The most prevalent kind of workplace discrimination is retaliation, which occurs when an employer punishes a worker for engaging in legally protected action.
For example, if a worker participated in a legitimate workplace investigation and their company fired or demoted them, this would be considered retaliation.
The 2nd and 3rd most prevalent discrimination claims are race claims with nearly 22,064 charges filed and disability claims with roughly 24,324 charges filed.
DISCRIMINATION CLAIMS In The United States By Type 2019-2020
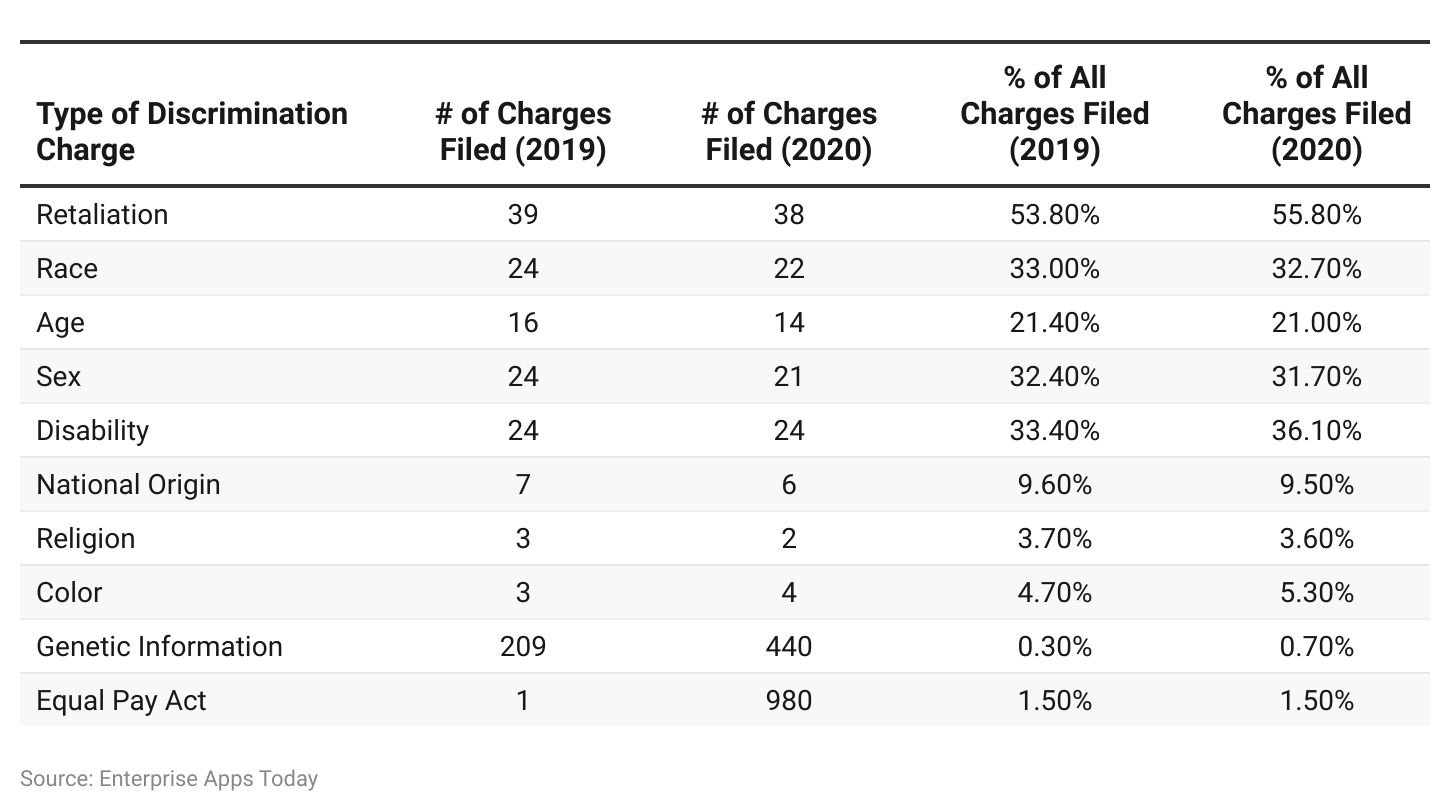
#3. Equal pay discrimination accounts for just 1.5% of the charges filed.
Even while equal pay is a topic that is most of the time discussed, the actual number of complaints is a tiny portion of the total complaints. This may be partly attributed to businesses' lack of candid or transparent policies regarding workers sharing details about their salary.
#4. The least common type of claim is the genetic information claim, with roughly 440 complaints in 2020.
This kind of discrimination happens when workers are treated unfairly by their employers due to the presence of a gene mutation that could increase or cause the risk of inherited illness. Employers frequently engage in this discrimination because they do not want to take the risk associated with providing workers with adequate health insurance.
Equal Pay Act claims, with around 980 charges filed, and religion claims with nearly 2,404 charges filed, are the second and third most common forms of discrimination.
By Worker Experience
Even though most workplace prejudice occurs behind closed doors, many workers have seen it firsthand. When these workers do not disclose what they have seen, it can have a negative impact on both the victim of the discrimination and the overall environment at the workplace. These are the facts:
(Source: zippia.com)
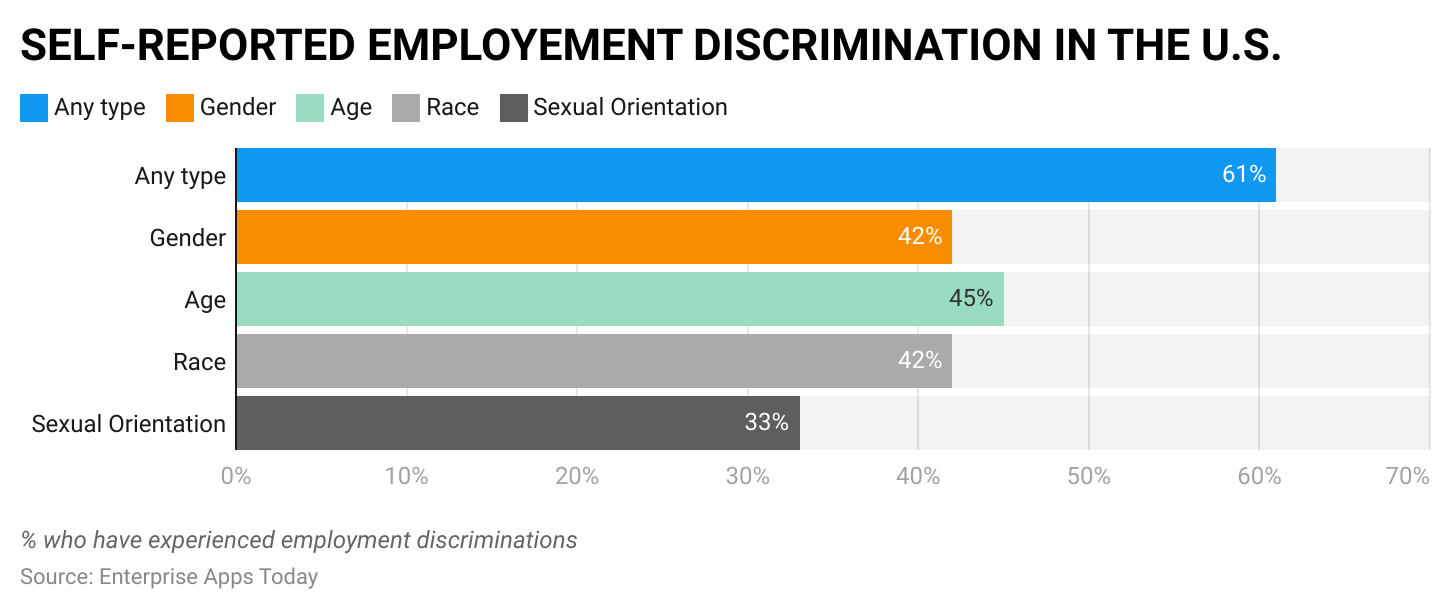
#5. Around 33% of employees in the United States have experienced discrimination due to their sexual orientation.
This is a smaller percentage than the worker who has faced discrimination based on their sex, race, or age. However, it is essential to note that approximately 7% of workers in the United States identify as LGBTQ+, which means that the number of employees discriminated against because of sexual orientation may be higher than it initially appears.
#6. The majority of Americans (45%) have experienced age discrimination, making it the most prevalent type of prejudice in the United States.
In general, younger workers notice that older, more experienced employees discriminate against them, and older workers are also discriminated against. Harassment of younger employees is one way to do this by denying more senior employees opportunities.
It should be noted that other types of prejudice are also common. Additionally, 42% of Americans claim to have been the victim of discrimination based on gender or race.
#7. 61% of workers in the United States have witnessed or experienced workplace discrimination.
This is significantly higher than in countries like Germany and France, where only 37% and 43% of employees have encountered workplace discrimination.
By The Success Rate Of Complaints
Unfortunately, in the U.S., the success rates for worker discrimination cases and complaints are low. Numerous grievances are resolved outside of court, and several are never turned into formal complaints. Our analysis shows that:
#8. In 2020, the EEOC filed around 93 discrimination claims and solved nearly 165 merits cases.
Although $106 million was recovered for victims through this method, this number represents a tiny portion of the claims and calls the EEOC typically handles. For instance, the agency took more than 470,000 calls about discrimination that came into its toll-free number.
#9. The average compensation for employment discrimination is $40,000.00.
However, depending on the company's size, this can vary greatly. For example, if the company has between 15 to 100 employees, the court may give up to $50,000 to the worker, $100,000 for 200 to 500 employees, $200,000 for 201 to 500 workers, and $300,000 if the company has more than 500 employees.
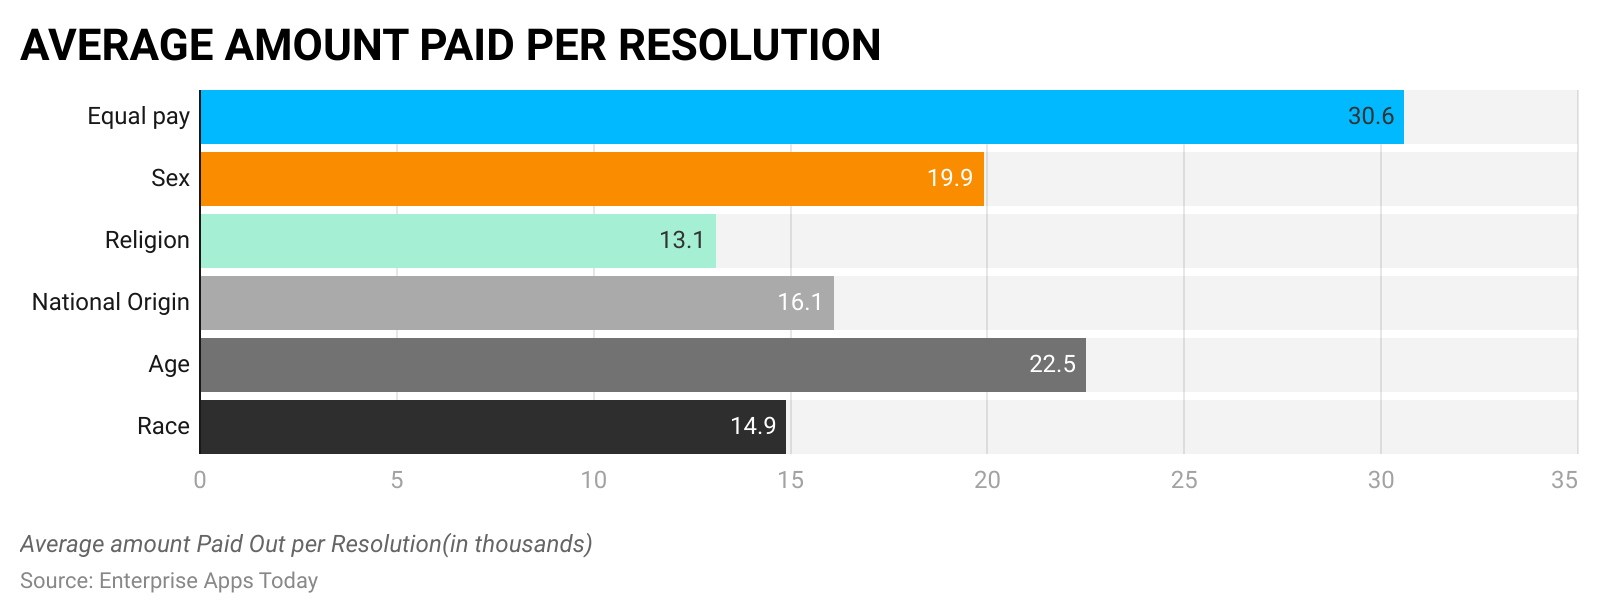
#10. The average settlement for religious discrimination claims is the most minuscule, just $13,100.
That amount is 43% less than the average equal pay lawsuit payout. Other lower paid amount case types include national origin accusations, with a nearly $16,100 payout, and race discrimination, which averages a $14,900 payout.
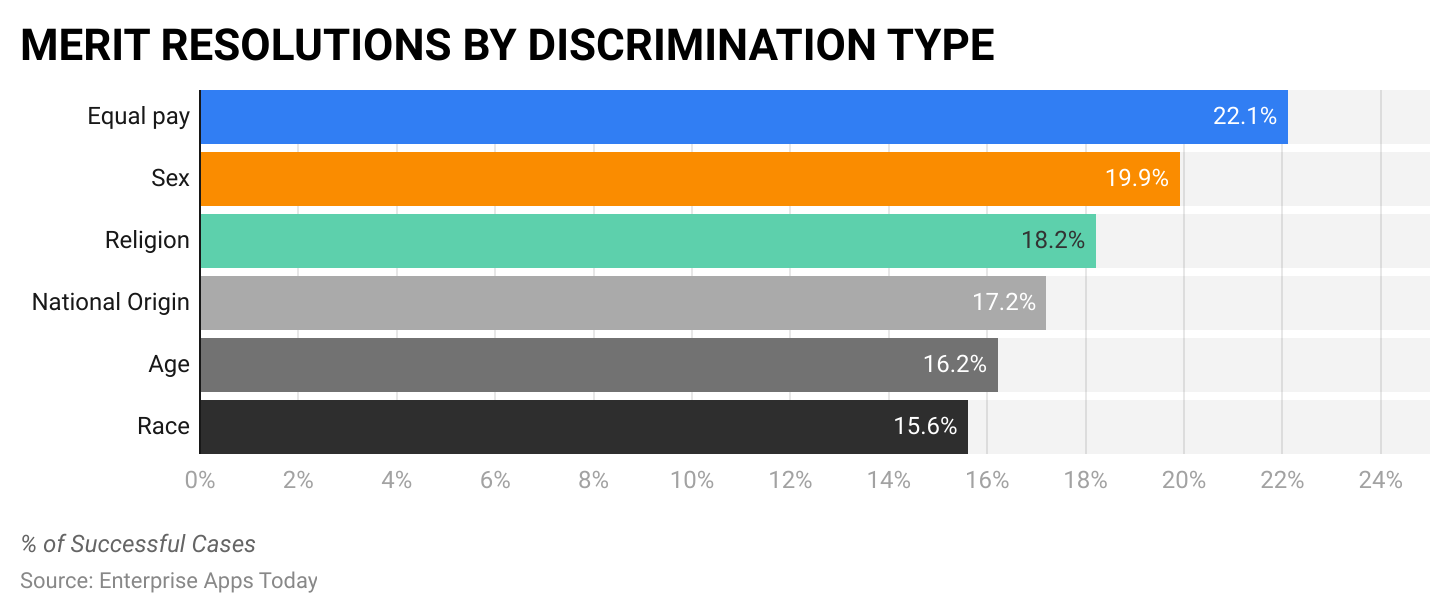
#11. Around 22.1% of equal-pay complaints result in a resolution, which is higher than the other types of discrimination cases filed.
Equal pay complaints are the most successful discrimination cases, with an average payout of $30,600. Sex discrimination charges are the runner-up with a 19.9% success rate but the lower average payout of $19,900.
(Source: zippia.com)
#12. Roughly 17.4% of the EEOC's closed workplace discrimination complaints were resolved for a client.
Roughly 15% of complaints result in actual litigation; therefore, the percentage of victims getting justice is alarmingly low. The only bright spot is that 2020 was a decrease in cases compared to 2019 when just 15.6% of cases were solved in a resolution for the clients.
(Source: zippia.com)
#13. Since 1997, there have been 123,665 resolutions against sex discrimination.
Sex-related charges are much more common, even though the payouts for these complaints are lesser than those for equal pay. There have been 118,870 resolutions on charges of racial discrimination.
By Region
The United States is a large country, which means workers may face less or more discrimination based on their location. Regrettably, some regions have histories that can exacerbate some types of discrimination. In light of this, the following are some facts about job discrimination by region:
#14. Around 33 states have legal protection laws in place in order to protect LGBTQ+ employees.
There are now just 17 states that lack these protections. Generally, the midwest and south parts of the U.S. have fewer legal protections, while the west coast and northeast areas have the most legal protections.
#15. New Mexico has the highest rate of discrimination claims based on national origin, at 5 for every 100,000 persons.
Despite this number being more significant than any other state, New Mexico's number of national origin-based discrimination claims declined by -68.9% from 2009 to 2018.
Florida (3.1) and Colorado (3.1) are the states with the 2snd and 3rd highest number of complaints. Immigrants are typically the ones that experience this discrimination the most.
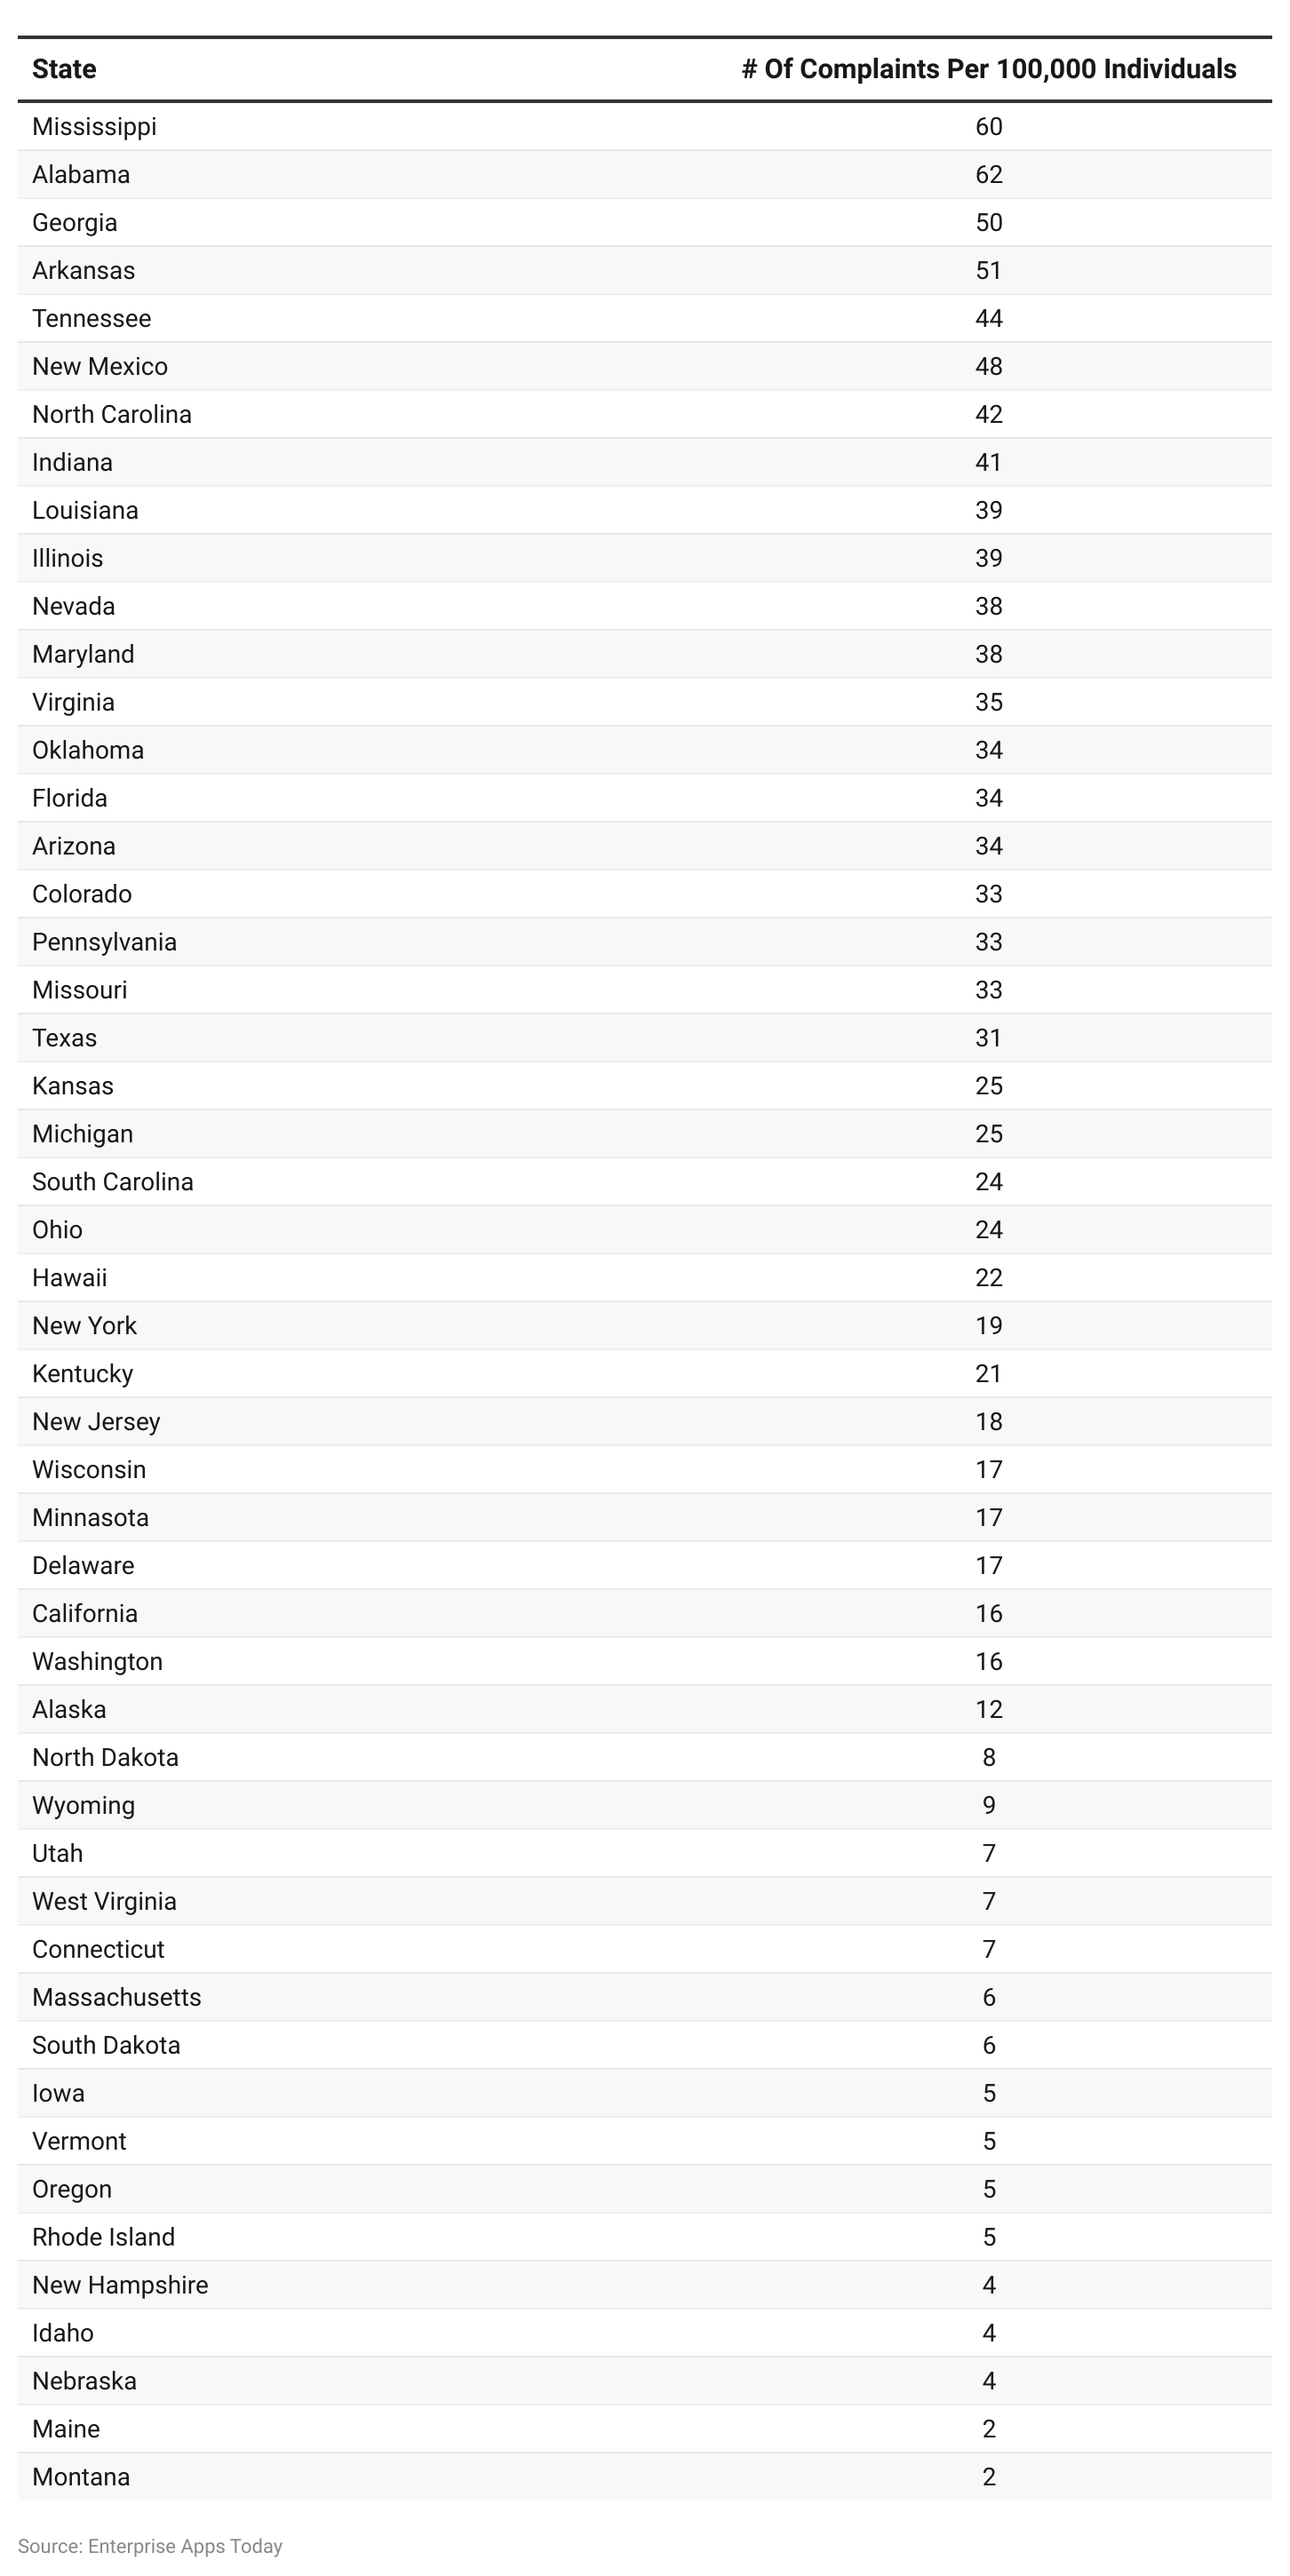
#16. Alabama State has the highest discrimination rate in the United States, with nearly 62.2 complaints per 100,000 individuals.
Georgia (50.3), Arkansas (51.7), and Mississippi (60.8) are the other states with high prejudice rates. These are all geographically close to one another, making this a regional problem beyond state lines.
Cases Of Discrimination Per Capita Per State
#17. The only state that forbids weight discrimination is Michigan.
49 states still don't provide any protections for obese or overweight employees, despite the fact that adult obesity rates have risen by 27.5% in recent years.
#18. Maine State has the lowest rate of discrimination in the United States, with around 2.5 claims every 100,000 persons.
That is 25 times fewer individuals filing discrimination complaints than in Alabama State. Other states with low discrimination rates include Nebraska (4.3), Idaho (4.3), New Hampshire (4.0), and Montana (2.6). These states can be found across the map, but they share low populations in most of their areas.
#19. The number of sex discrimination cases in Nebraska increased by 166.7% from 2009 to 2018.
The only other state to see a rise of more than 100% was Massachusetts, with an approximately 108.7% increase. However, Idaho saw the most significant drop in sex discrimination cases at nearly -55.9%.
#20. The number of equal pay discrimination complaints in Michigan increased by 163.6% from 2009 to 2018.
Maryland was the only state that saw an increase of more than 100%, with a roughly 123.1% rise. On the other hand, New Mexico had a halving of claims, which saw a higher decline in equal pay discrimination charges than any other state.
#21. Equal pay legislation is present in 48 different states.
South Carolina, Wisconsin, Utah, and North Carolina are the states that have not implemented or drafted equal pay legislation. However, some states have broad employment laws that forbid inequitable pay resulting from discrimination.
By Projections and Trends
Even though the number of discrimination complaints in the U.S. has been declining over time, the United States still has a long way to go. We have gathered some fascinating facts regarding employment discrimination projections and trends to understand better where the nation is headed:
#22. The number of claims of racial discrimination declined by 9.7% between 1997 and 2020.
Race discrimination has decreased charges from 36.2% in 1997 to 32.7% by 2020. Race discrimination is one of the few categories of discrimination accusations that have fallen over the last 20 years.
#23. Since 1997, the EEOC has received more than 1.8 million complaints.
Out of the 1.8 million complaints filed, 21.3% (or 422.866) were for age discrimination, 28.7% (or 570,360) were about sexual harassment, and 35.7% (or 710,512) were about racial discrimination. In contrast, the remaining 14.3% of complaints were split between religion (64.006) and national origin (198,689) and equal pay (22,861) discrimination.
#24. According to the EEOC, 67,448 claims of discrimination were filed in 2020.
The quantity of discrimination complaints submitted has generally been declining. There were 76,418 charges in 2018 and around 72,675 charges in 2019. That represents an average decrease in complaints, roughly 3,000 to 5,000 yearly.
#25. The number of discrimination claims, including genetic information, grew by 133.3% between 2019 and 2020.
Even though just 0.7% of all discrimination allegations related to genetic information were filed in 2020, it was a significant increase from 2019, when these claims only made up nearly 0.3% of all claims.
#26. Discrimination complaints have decreased from 5% to 8% year-over-year.
The number of job discrimination complaints decreased by 5.1% between 2018 and 2019, and that decrease increased to 7.75% between 2019 and 2020. These trends are positive signs that we are moving towards an equitable workplace.
#27. The number of discrimination claims related to retaliation raised by 146.9% from 1997 to 2020.
Now, the majority of the complaints (56%) and retaliation accounted for 22.6% of all complaints in 1997. Since then, allegations of retaliation have been progressively rising year over year.
By Demographics
Discrimination against employees can happen for any reason. Whether they are young, women, or have a different skin tone. The following are some essential facts related to the demographics of discrimination within the workplace.
#28. Around 52% of those between the ages of 18 and 34 report having experienced employment discrimination.
Older workers are more likely to experience workplace discrimination, although it may not be as severe. Approximately 33% of those aged 55 and over have experienced discrimination in the workplace due to their age.
#29. 24% of Hispanic and Black workers say they have experienced discrimination in the last 12 months.
Just 15% of White workers report the same. Overall, 18% of employees state that they have been experiencing discrimination in the past 12 months. This means that Black and Hispanic workers' reports are significantly higher than the national average.
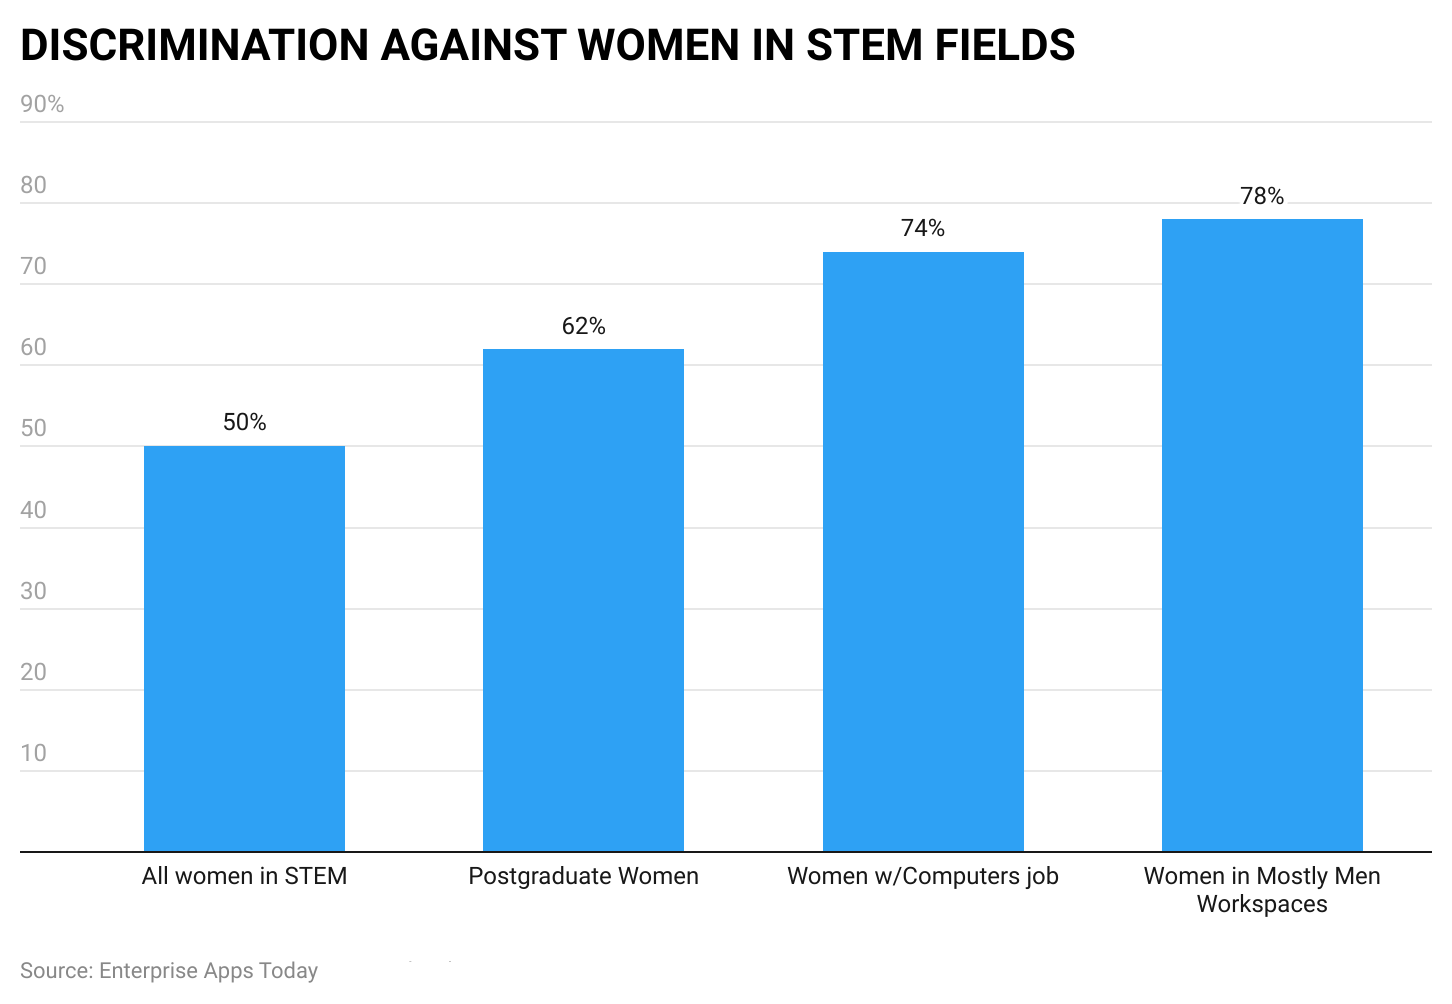
#30. 50% of women who work in the STEM field say they have experienced gender discrimination.
Although 48% of jobs in the United States are in STEM sectors, only 27% of those workers in the STEM fields are women. Even worse, postgraduate females are more likely to be discriminated against than their male counterparts (likely because of higher male presence). Overall, 62% of women with postgraduate degrees in the profession state that they are treated unfairly.
(Source: zippia.com)
#31. 75% of Black workers said they had experienced racial discrimination.
Overall, 52% of the 18% of employees who have experienced discrimination said it was due to their race. The percentage of Hispanic workers is likewise significant, at 61%. Nearly 42% of White workers state the same.
Conclusion
The introduction of the federal and statewide legislature has brought the problem of discrimination over the past decade. Since 1997, more than 1.8 million complaints have been filed; fortunately, these numbers are decreasing yearly.
However, discrimination is still a problem for many demographics across multiple regions. Discriminatory acts can make it difficult for LGTBQ+, POC, women, and old and young employees to earn their wages, job security, or even decency.
Hopefully, the recent trends showing greater awareness and lower case numbers will continue to create a workplace where everyone is treated equally.
Sources
FAQ.
Direct proof is the best technique to demonstrate discrimination in the workplace. Direct evidence can be written documents, emails, and statements easily proven in court.
Sadly, the majority of employment discrimination cases are entirely based on circumstantial evidence, where the victim is required to prove that he or she was discriminated against by inference.
For instance, if an employee believes they were terminated because of their gender, they would need to demonstrate that the employer intended to do so by proving an inference like "the organization often terminates female workers and replaces them with male workers."
Because it might be challenging to demonstrate and easy for employers to refute, discrimination claims rarely go to court.
Nearly 95% of EEOC district court lawsuits are successful, even though this figure can be misleading.
Although this percentage can be deceiving, 95% of EEOC district court lawsuits are successful. Just 17.4% of closed workplace discrimination complaints filed with the EEOC result in a client resolution.
In actuality, only 17.4% of closed workplace discrimination complaints filed with the EEOC result in a client resolution. This is because only 2% of the charges are resolved.
Approximately 40,000 is the typical EEOC settlement amount. However, depending on the company's size, this can vary greatly.
For example, if the employer has between 15 to 100 workers, the court may award up to $50,000 to the worker, $100,000 if the employers with 101 to 200 workers, $200,000 if the employers with 201 to 500 workers, and up to $300,000 if the employers have 500+ workers.
Workplace discrimination primarily affects minorities. Employees are more likely to experience workplace discrimination if they have a different color, gender, etc., from most of their colleagues and employers.
This is why one-fourth of Black employees, who only account for 12.6% of the workforce, report having encountered employment discrimination in the previous year. Around 75% of those employees state that they have experienced racial discrimination.
The same logic may also apply to women employees in STEM fields. Because just 27% of STEM employees are female, they face prejudice at considerably greater rates. In fact, 62% of postgraduate females and 50% of females working in the STEM sector say they have experienced discrimination because of their gender.
Retaliation is the most prevalent basis for employment discrimination. Retaliation accounts for nearly 56% of all discrimination claims as of 2021. Additionally, this represents an increase of 146.9% from 1997, when retaliation accounted for only 22.6% of all accusations. Other instances of discrimination that account for more than 30% of allegations each include discrimination based on race (32.7%), gender (31.7%), and disability (36.1%).
In 2021, the EEOC reported nearly 114 instances of occupational discrimination. That represents a reduction of 23.5% from 2019, when 149 complaints were filed.
It's crucial to remember that these cases account for only a fraction of the discrimination claims filed. For instance, the EEOC reported nearly 67,448 accusations of discrimination filed in 2020 and 72,675 in 2019.

Barry is a lover of everything technology. Figuring out how the software works and creating content to shed more light on the value it offers users is his favorite pastime. When not evaluating apps or programs, he's busy trying out new healthy recipes, doing yoga, meditating, or taking nature walks with his little one.