
Foursquare Statistics 2023 – Usage, Market Share, Facts and Trend
Page Contents
- What is Foursquare?
- The Whereabouts Of Foursquare
- Demographic Statistics
- Foursquare Business Statistics
- Foursquare Statistics by Traffic Source
- Foursquare Statistics by Social Media Referral Rate
- Foursquare and Pandemic
- Foursquare Statistics by Website Traffic
- Foursquare Statistics On Special Days
- Statistics Of Relocation During A Pandemic
- Statistics Of Relaunching Of Foursquare
- General Thought
- Conclusion
Foursquare Statistics: Technology is changing the world by means of portable devices a human can carry into his pocket. Mobile phones, tablets, and I-watches are replacements for laptops and PCs. To add to this, there are various app developers who are making life easier. Just like today, we can order food online and eat it in the comfort of our house. There’s a Google default search engine to search whatever comes to mind.
If I search for places nearby me, Google gives me n number of recommendations. Likewise, foursquare has the same focus to let users know where else can they go. This report will highlight some four-square statics. This statistic includes Foursquare’s statistics. The app made its way by means of technological improvements in its features. The report will also introduce Foursquare, the current status of the company, demographic strategies, business statistics, and relocation statistics measured by the Foursquare app itself.
What is Foursquare?
The Foursquare app was launched in the year 2009 by Naveen Selvadurai and Dennis Crowley. Foursquare helps users to know various places to go depending on their browsing history and the user’s current location. Initially, the application was meant to be for traveling purposes, but in the year 2014, users started using it as a social networking application. In such a case, a user would manually share his locations so that people nearby him would also check in.
The Whereabouts Of Foursquare
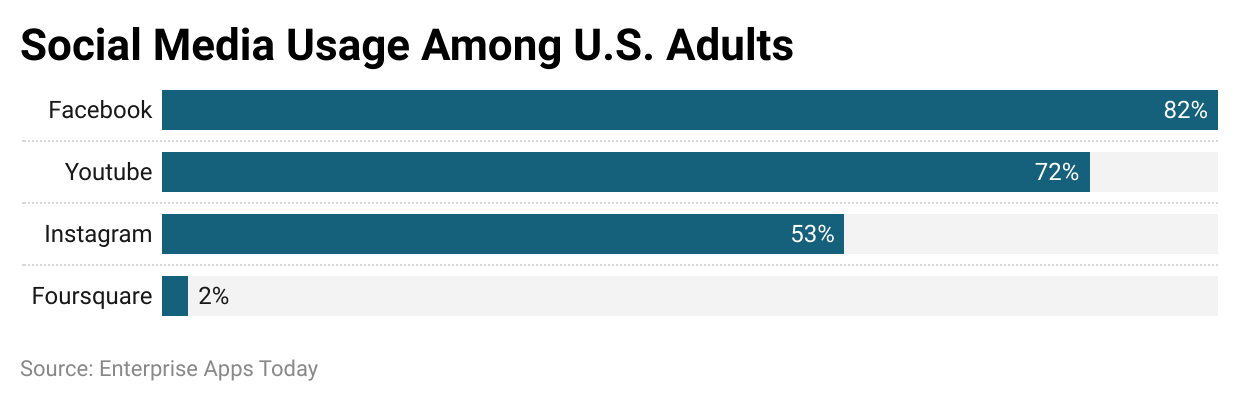
As per the report from 2023, Foursquare ranks has started increasing its rank in terms of social media usage compared to last year. But still, the app has billions of accounts in its database. The maximum revenue that Foursquare earns comes from its software data and business side. Fortune’s 100 Companies list is in partnership with Foursquare with more than 50%.
- As of 2023, the monthly active users of Foursquare are 55 million.
- On the other hand, global monthly visits to Foursquare are more than 3 billion.
- As per Statista’s study states that, in the United States of America it is expected that there are 60% of Foursquare users.
- In terms of software and data products and services, the revenue can be counted as 90%.
- According to Yahoo Finance, Foursquare’s swarm app has 2 billion checks per year.
- In the year 2023, Foursquare was able to earn more than $200 million in revenue.
- Foursquare recommendations are trusted by 92% of users across the world.
Demographic Statistics
- According to Statista, 40%of the users in the United States of America are in the age group of 30 to 39.
- Considering the users from the US, 58% and 42% are divided into male and female users respectively.
- Foursquare has over 100 million users in the United States according to reports from Intelligencer.
- Foursquare has an overall 47%of users from the age group of 25 to 34
- Users from the age group of 35 to 44 result in around 29%.
- According to the user’s location on the Foursquare app, Statista the year states that 14% of the users live in rural areas.
- On the contrary, 20% of the users live in small-town areas, whereas 28% of people on the app reported living in not-so-big and not-so-small-sized towns.
- The maximum population lived in the urban area accounting for 64% whereas 36% goes to people in towns and rural communities.
- Furthermore, Statista states that the income of brand owners is evenly divided.
- Considering the family, 43%of the users come from small families, whereas, 28% go to families with two children.
 (Source: similarweb.com)
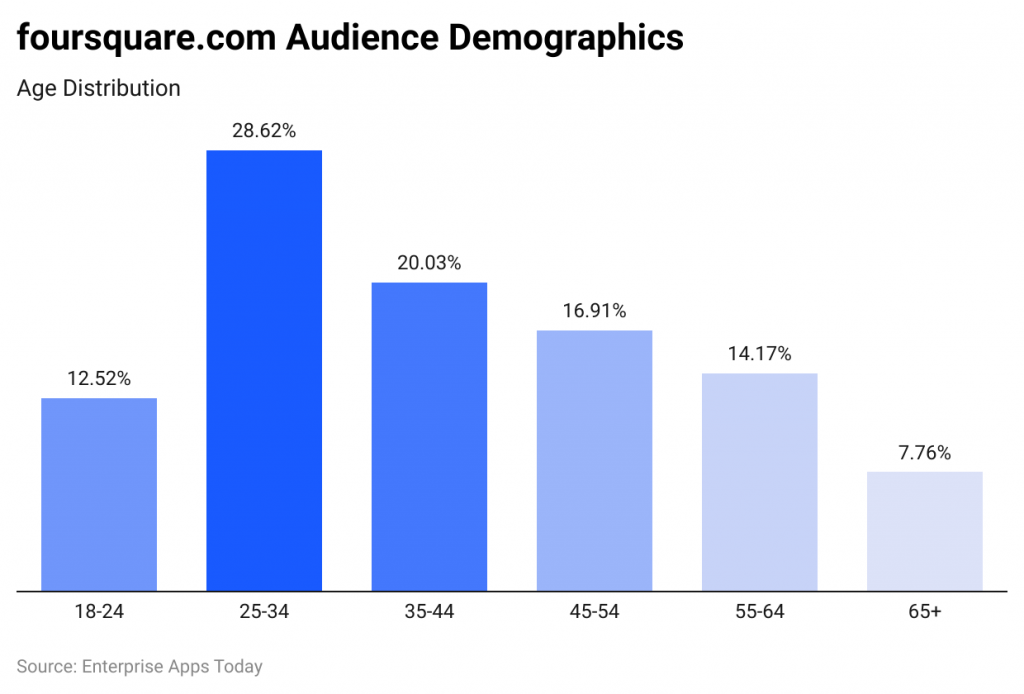
- As of January 2023, the Foursquare Statistics by the demographic state that, the highest number of gamers observed is between the age group of 25 years to 4 years resulting in 28.62%.
- There are 20.03% of Foursquare users aged between 35 years to 44 years.
- 91% and 14.17% belong respectively to 45 years to 54 years and 55 years to 64 years.
- 52% of players are aged between 18 years to 24 years.
- And there are 7.76% of Minecraft gamers contributing from the age group of 65 years and above.
Foursquare Business Statistics
During the time of the pandemic, Foursquare was able to share the reports on busy hours of shops for essential stores. The company during the period timely sent out such reports to keep the customers safe from the pandemic situation.
- Foursquare is inbuilt with 105 million maps including 190 countries.
- Foursquare’s reports show that around 60% of the users made the bookings in advance for dining.
- In the year 2020, Foursquare made a partnership with Intersection and LinkNYC to offer a safer shopping experience. LinkNYC incorporated pharmacies, groceries, and other types of essential shops in the nearby areas. In this way, the app will measure the free time so that crowds can be avoided, and social distancing measures will be followed. Foursquare will then check the login data so that appropriate measures will be taken.
- In the year 2020, Foursquare’s data was used by Bon and Viv for the purpose of geo-targeted ads focusing on football fans in 27 NFL stadiums. This resulted in rebranding up to 31% then ad recalls up to 28% and 18% for the intent of purchase.
- In the year 2019, Foursquare created a location-related media software that gave users an idea about the best outdoor location nearby them. This made LL Bean for whom the software was created rise in the total engagement and time spent on the application by 1.5 times.
Foursquare Statistics by Traffic Source
 (Source: similarweb.com)
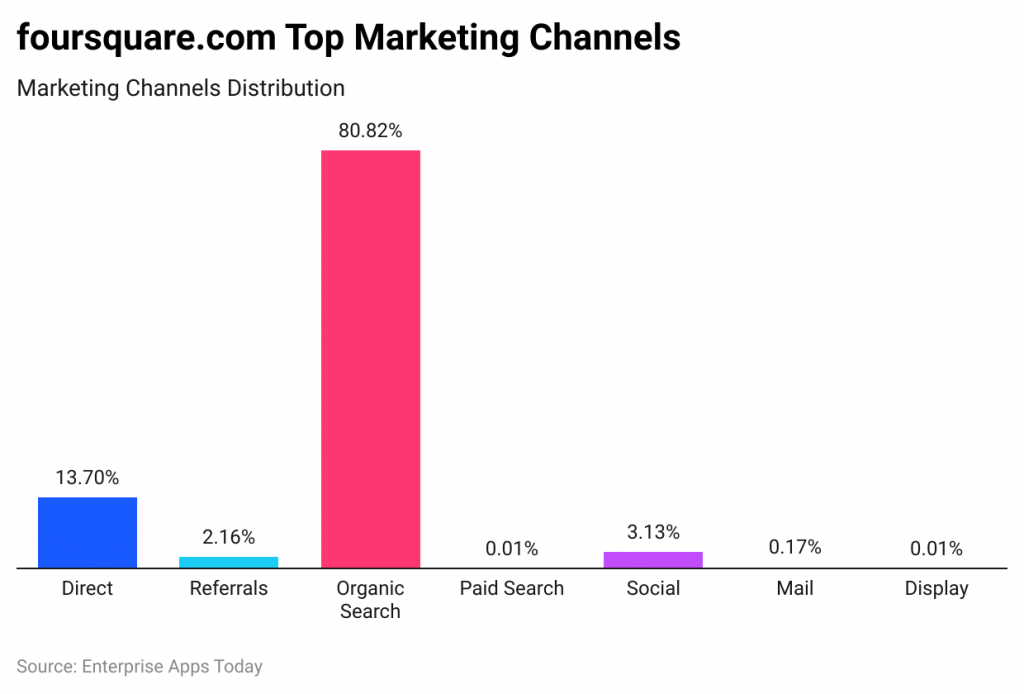
- As per the Foursquare statistics for 2023, the highest rate of traffic towards foursquare.com is by organic search resulting in 80.82%.
- 7% is direct traffic while 3.30% is from social media networks.
- Furthermore, other traffic sources towards foursquare.com are referrals (2.16%), Paid (0.01%), Mail (0.17%), and Display (0.01%).
Foursquare Statistics by Social Media Referral Rate
 (Source: similarweb.com)
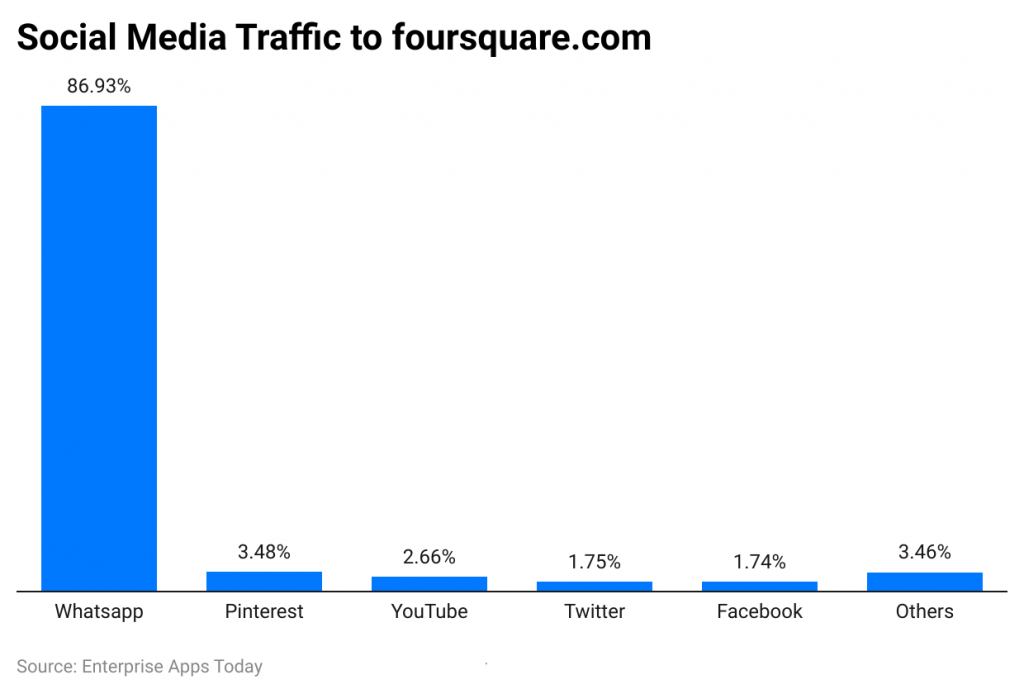
- WhatsApp has the highest rate of social media referral rate resulting in 83.77% than other social networks.
- Pinterest and Facebook contribute by 4.31% and 2.6% respectively.
- Traffic sent by LinkedIn is 2.17% and YouTubecontributes by 2.05%.
- Other social media networks with nominal contribution percentages collectively make up 5.11%.
Foursquare and Pandemic
Foursquare did a commendable job during the pandemic years, as everything was open with limited access, the app’s check-ins told the other users where the place was open or closed and if it was crowded or not. The data received from Foursquare’s report provides more insight into pandemic days.
- The footfall in the bars on national boundaries was only 11% in the year 2021.
- In the month of September 2020, the number of students going to school was small in terms of the percentage
- On the other hand, universities experienced a rise in the crowd by only 1%
- High schools, middle schools, and elementary schools had a minor decrease to 3% from 5%.
- In the month of August 2020, Foursquare users already in the US made their way outdoors. During the same months, the Midwest and Northeast experienced an increase in visitors to 102% from 92%.
- On the other hand, parks had a crowed increase from 77% to 84%.
- Furthermore, the reports state that auto repair shops and gas stations had an increase in football by 3% reaching 6% from 3%.
- In the Northeastern states, gas stations also saw a number of visitors up to 9%.
- Foursquare’s report showed that people majorly avoided traveling by airplanes over traveling by car.
- In the recent months of the pandemic, in the month of April, the movie theater crowd was reduced to 75% as well and there was a decrease in airports by 74%. People chose online shopping over offline stores as the crowd decreased by up to 72%.
- On the other hand, the number of visitors to hardware stores increased by 56%.
- In the early days of the pandemic, the month of March 2020 the crowd in the warehouse increased by 39% in the United States of America.
- As people were advised to stay at home, and every non-essential shop was closed, Foursquare statistics showed that there was an increase in visitors to liquor shops by 25%.
- As late-night dining is always full, the year 2020 saw that 50% of restaurants at such times were empty.
- On the other hand, restaurants with instant services saw an increase in visitors after the pandemic.
Foursquare Statistics by Website Traffic
(Source: similarweb.com)
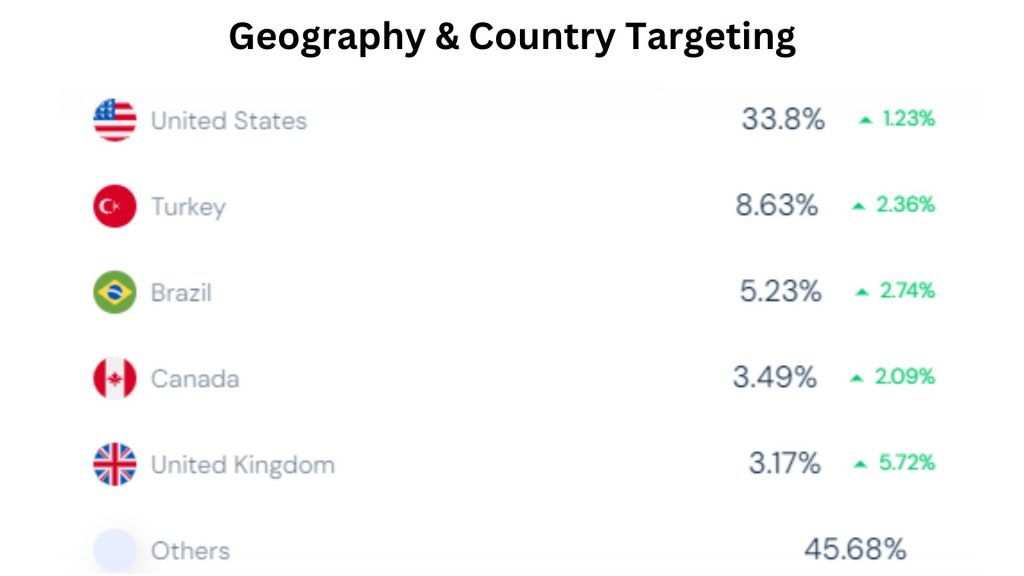
- In the last month, the United States of America had 33.8% of total traffic on foursquare.com, but it recorded a decrease in total website visitors by 1.23%.
- Other countries recorded the following contribution in total traffic: Turkey = 8.63% (+2.36%), Brazil = 5.23% (+2.74%), Canada = 3.49% (+2.09%), United Kingdom = 3.17% (+5.72) and other countries collectively made around 45.68%.
Foursquare Statistics On Special Days
Even though the two years were locked inside the house, people never failed to celebrate the special days! The following statistics received by Foursquare statistics itself give a better insight.
- On Mother’s Day, the cheesecake factories saw a tremendous spike in the number by 93% compared to the weekends and other normal days.
- Red Lobster reported a 75% increase in the business whereas, longhorn Steakhouse experienced an increase up to 70%
- Father’s Day resulted in an increase in camera shops by up to 24% and an 11% rise in hunting supplies stores.
- During Memorial Day, campgrounds experienced a 36% rise in the crowd whereas, a 35% rise in visitors to the parks.
- Around the easter days of 2020, candy stores and zoos had a rise of up to 11% whereas bike trails, wineries, and theme parks were at the level of 7%.
- During the pandemic, big Mexican theme restaurants in the United States of America experienced an increase- Chilli up to 65%, Chipotle at 33% rise, Del Taco with 13%. On the contrary, Taco Bell numbers were reduced to 19%.
- All of these data have been marked by Foursquare by comparing the same-day traffic, vs. before and after day traffic.
Statistics Of Relocation During A Pandemic
It was the year 2020 when many people working abroad came back to their own countries. More to that, many people changed their locations looking for better opportunities. Foursquare statistics even managed to mark the reports for the same.
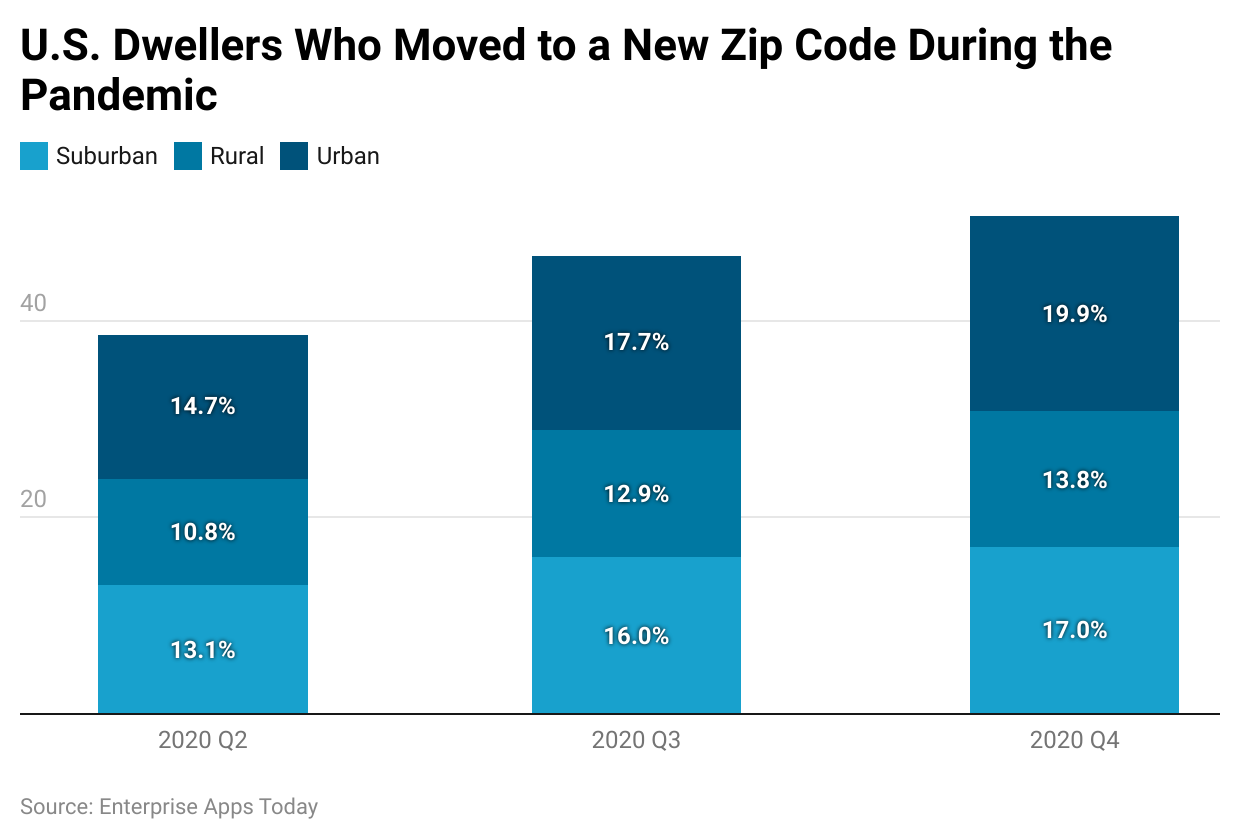
- The fourth quarter of the year 2020 experienced a 19.9% relocation of people to new areas even changing their zip codes.
- Around the year 2020, the people resulting to 86% to 89% living in rural areas moved out of their houses but stayed in the same zip code.
- Of the residents from the suburban area, 47% moved back to rural areas 22% moved to urban areas while 32% stayed in the same location.
- Of the residents in New York around 88.5% preferred to stay in the same zip codes.
Statistics Of Relaunching Of Foursquare
A few days after Foursquare and Factual merged together into Places. It was determined that the data would be more accurate and recent.
- Foursquare after relaunching increased the database by combining the 95 million places information from around the world adding to the information up to 89.8%.
- GISuser in the year 2021 stated that the improvements in the Enterprise Places API will be 99.99.
- In the year 2023, Foursquare restored 8%of the data. There were 50 million new places to go which were updated in the database.
- The Places app has the ability to receive direct feedback from the customers therefore automatically increasing the database with more improvements. Foursquare’s places have around 2 million updates from more than hundreds of sources.
- As of September 2023, Foursquare’s places have around 2 million updates from more than hundreds of sources.
General Thought
After the company’s launch in 2009, even though it faced many difficulties it has made its way with better features to the year 2022. It played the role of a guide for those two years of the pandemic. Now, Foursquare’s places have been developed using AI technology so that it provides better results with accurate numbers.
Conclusion
Foursquare’s numbers show that initially, the application was facing awareness problems. But actually, it was working as a savior. Even before the pandemic hit the world, whatever Foursquare did for the users was commendable. When Foursquare replaced its name with Places and refreshed its whole database, it attracted more users than expected. The technology which is shaping its features is saving the time of the users.
In the world of technology, it is necessary to have such kinds of applications. We all know that the pandemic will still take some time to go over. For such reasons, we need to take care of staying away from the crowds. Even though Google can share where to go places nearby, Foursquare has users' updated data which provides exact numbers and places.
Considering this technology, if it is improved more, it can also detect if someone’s house has been under attack by thieves or if someone is in an emergency. Having such applications in our lives is a blessing to our lives. It is expected that Places will earn more importance in the near future considering the pandemic issues. The dark side of such an application to be mentioned is, that there’s hardly any location security, as anyone in the world knows where you have checked in.

Barry is a lover of everything technology. Figuring out how the software works and creating content to shed more light on the value it offers users is his favorite pastime. When not evaluating apps or programs, he's busy trying out new healthy recipes, doing yoga, meditating, or taking nature walks with his little one.