
Home Improvement Industry Statistics By Market Size, States, Region, Customer Satisfaction, Funding
Page Contents
- Introduction
- Editor’s Choice
- Facts About Home Improvement Industry
- Delayed Projects Statistics
- General Home Improvement Industry Statistics
- New Brand Usage Statistics For Home Improvement
- Home Improvement Sales Statistics in U.S
- People's Preferences for Home Improvement Projects
- Social Media Usage Statistics for Home Improvement Research
- Costs per Home Improvement Project by State (In United States)
- Reasons for Renovations in the United States
- Reasons for Home Improvement by Region
- Top Factors Motivating Homeowners for Home Improvement
- Postponed Home Improvement or Remodeling Projects Statistics
- Young DIY Homeowners' Online Sources for Home Improvement
- Inspiring Statistics For Home Improvement Projects
- Top Home Improvement Chains' statistics by Customer Satisfaction
- Some Important Home Improvement Statistics
- Home Improvement Project Statistics by Funding
- Home Improvement Retail Industry Sales Statistics in The U.S.
- Conclusion
Introduction
Home Improvement Industry Statistics: The reports say that the Home Improvement Industry market size is expected to reach $575.5 billion by the year 2030 which is termed as the global market growth of 6.7% starting from 2022-30. Across the world, urbanization has increased enormously thus, the demands of customer trends enhanced in the last few years. These days’ people are willing to invest more in infrastructure to improve their standard of living which is possible due to technological development in the manufacturing industry with upgrading systems, exterior and interior replacements, disaster repairs, kitchen and bathroom improvements, and other additions.
These Home Improvement Industry Statistics include many effective insights from several aspects that will shed light on how home improvement is playing a crucial role across the world.
Editor’s Choice
- In 2022, the market size of the home improvement industry had turned up to $342 billion.
- By the end of 2025, the sales rate of the home improvement industry has reached $625 billion.
- A homemaker by 89% has already started working on home projects or was in the planning process for home improvement in 2022.
- In the months of April and June every year, American spends most of their investments on home improvements.
- In 2022, invested in projects related to the home improvement industry such as the heating and cooling sector done by 84% of homeowners.
- The commuting budget of the home cost was increased by 7% from 2021 to 2022.
- Home improvements with around 26% of projects were done for improving better living room spaces for fulfilling regular lifestyle needs.
- In 2022, over the world, either minor or major renovations were the basic requirement which is accepted by 91% of homemakers.
Facts About Home Improvement Industry
- According to the reports of Grand View Research, the industry of home improvement is expected to be worth around $1 trillion by the end of 2027.
- As of 2022, for home improvement projects American people have spent around $427 billion.
- According to the reports of Harvard University, the budgets of older homeowners.
- Yearly home improvement plans were agreed upon by 40% of partners by the end of 2022.
- Homemakers by 52% remained more concerned about the costs of projects related to home improvements.
- The most expensive states in the U.S. for maintaining home improvement were Missouri, North Carolina, and Georgia by the end of 2022.
- The most common issues in the home improvement industry were drafty windows and doors = 44%, Uneven heating, and cooling = 35%, and outdated HVAC systems = 35%
- As of reports during home improvement planning around 34% of couples made better bonding and 27% of couples had fought with their partners in 2022.
- As of reports in 2022, out of 4 homeowners, 3 were DIY (Do it yourself) young homeowners those attempted home improvement projects as this process was cost-effective.
- Around the world, about 50% of DIY young homeowners have handled exterior home improvements or some outdoor projects.
Delayed Projects Statistics
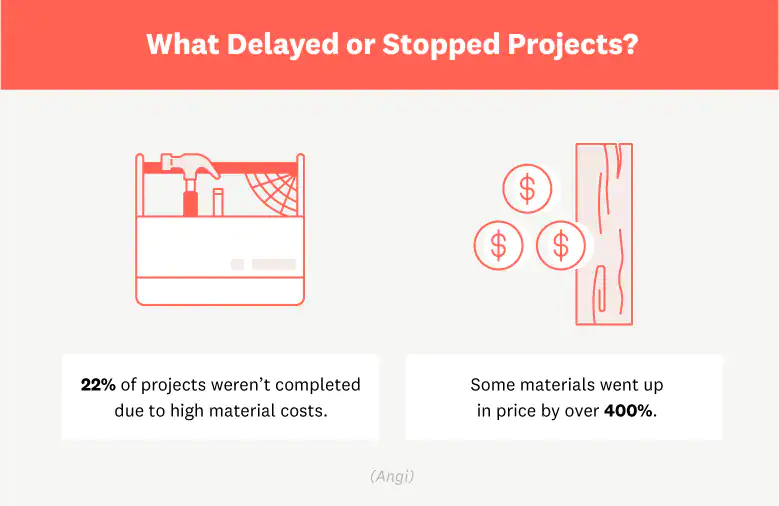
(Source: media.angi.com)
General Home Improvement Industry Statistics
- As of February 2022, an American home improvement company named Lowe’s Companies Inc. has made a new partnership with an online platform of grocery delivery named Insacart.
- The spending rate of home improvement has grown in cities such as Phoenix = 11.9%, San Antonio = 12.7%, Dallas = 7%, Oklahoma City = 9.2%, and Kansas City = 5.3%
- As of 2022, the most important project areas of the home improvement industry were the kitchen and living room = 14% each, home exterior = 12%, bathrooms and bedrooms = 11% each, and outdoor landscaping = 10%
- The improvement product market growth has decreased by 7.2% by the end of 2022 from 1.5% in 2023.
- YouTube is used by 55% of Millennial, DIY young homeowners for enabling information about home improvement, Facebook = by 39%, Instagram = by 26%
- The consumer market of building and home industry products is estimated to reach 2.3% starting from 2023 to 2025.
- In 2022 almost 55% of house owners stated that renovating their home was an essential part in which kitchen and bathroom remodeling remained most popular.
- Probably 60% of people have invested their money in DIY home improvement projects in sales of Lumberyards reached $138 billion by the end of 2022.
- Most home renovation work was done in 2022 by older millennials.
- The average cost of home improvement in 2022 turned out $44,000 to $75,000 approximately which is 5 – 10% higher than the last 2 years.
New Brand Usage Statistics For Home Improvement
- Major Appliances: 24% of people are using new brands in this category.
- Exterior Building Materials: 23% of people are opting for new brands for their exterior materials.
- Cabinets and Countertops: 22% of users are choosing new brands for their cabinets and countertops.
- Flooring: 21% of users are exploring new brands for their flooring needs.
- Smart Home and Home Automation Devices: 20% of people are adopting new brands in this category.
- Outdoor Power Equipment: 19% of users are trying new brands for outdoor power equipment.
- Windows and Doors: 19% of people are looking at new brands for windows and doors.
- Interior Building Materials: 19% of users are considering new brands for interior building materials.
- Outdoor Living Products: 19% of people are exploring new brands for their outdoor living needs.
- Furniture: 19% of users are opting for new brands in the furniture category.
- Décor and Interior Finishes: 17% of people are choosing new brands for décor and interior finishes.
- Hand and Power Tools: 16% of users are trying out new brands for their tools.
- Storage Shelving and Organization Products: 16% of people are selecting new brands for storage and organization.
- Lighting: 15% of users are going for new brands for their lighting needs.
- Lighting Accessories: 15% of people are exploring new brands for lighting accessories.
- Paint: 15% of users are adopting new brands for paint.
- Paint Supplies: 15% of people are choosing new brands for their paint supplies.
- Plumbing Fixtures and Supplies: 14% of users are considering new brands for plumbing fixtures and supplies.
- Lawn and Garden Products: 12% of people are trying out new brands for lawn and garden products.
- Lumber, Treated Lumber, and Plywood: 10% of users are selecting new brands in this category.
- Hardware: 7% of people are opting for new brands for hardware products.
Home Improvement Sales Statistics in U.S
 (Source: statista.com)
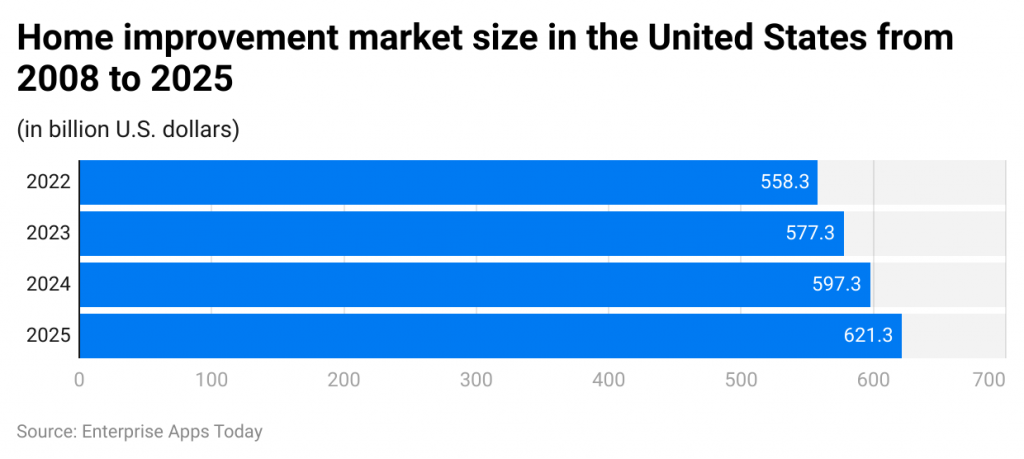
- In 2022, home improvement sales increased compared to the previous year, reaching a total revenue of $558.3 billion.
- The sales of home improvement products are projected to continue rising in the coming years:
- In 2023, it's expected to reach $577.3 billion.
- In 2024, it's forecasted to reach $597.5 billion.
- In 2025, it's estimated to reach $621.3 billion.
People's Preferences for Home Improvement Projects
- Painting and Wallpaper: 34% of people preferred this project.
- Update Decor: 33% of people chose to update their decor.
- Outdoor Landscape: 30% of people focused on improving their outdoor landscape.
- Flooring: 30% of people decided to work on their flooring.
- Bathrooms: 30% of people undertook bathroom improvements.
- Kitchen: 30% of people worked on kitchen renovations.
- Updating Storage Space: 29% of people updated storage areas like sheds and closets.
- Living Rooms: 25% of people concentrated on improving their living rooms.
- Bedrooms: 25% of people directed their efforts toward bedroom improvements.
- Utilities (HVAC, Electrical, and Plumbing): 24% of people worked on utility-related upgrades.
Social Media Usage Statistics for Home Improvement Research
- YouTube: 43% of people used YouTube for home improvement research.
- Facebook: 25% of people turned to Facebook for research.
- Pinterest: 20% of people used Pinterest for ideas and inspiration.
- Instagram: 13% of people utilized Instagram for research.
- Reddit: 9% of people engaged with Reddit for home improvement discussions.
- Twitter: 8% of people used Twitter for research.
- TikTok: 4% of people sought ideas on TikTok.
- Snapchat: 3% of people used Snapchat for home improvement content.
- Houzz: 3% of people relied on Houzz for inspiration.
- Other Platforms: 10% of people used other social media platforms for research.
- No Research: 28% of people did not use any social media for home improvement research.
Costs per Home Improvement Project by State (In United States)
- North Carolina: The highest average cost was $4,682.
- Georgia: Followed closely with an average cost of $4,664.
- Missouri: Had an average cost of $4,576.
- Texas: Recorded an average cost of $4,282.
- Pennsylvania: Had an average cost of $4,206.
- New York: Recorded an average cost of $4,144.
- Illinois: Had an average cost of $4,022.
- Florida: The average cost in Florida was $3,889.
- California: Recorded an average cost of $3,508.
- Ohio: Had an average cost of $3,970.
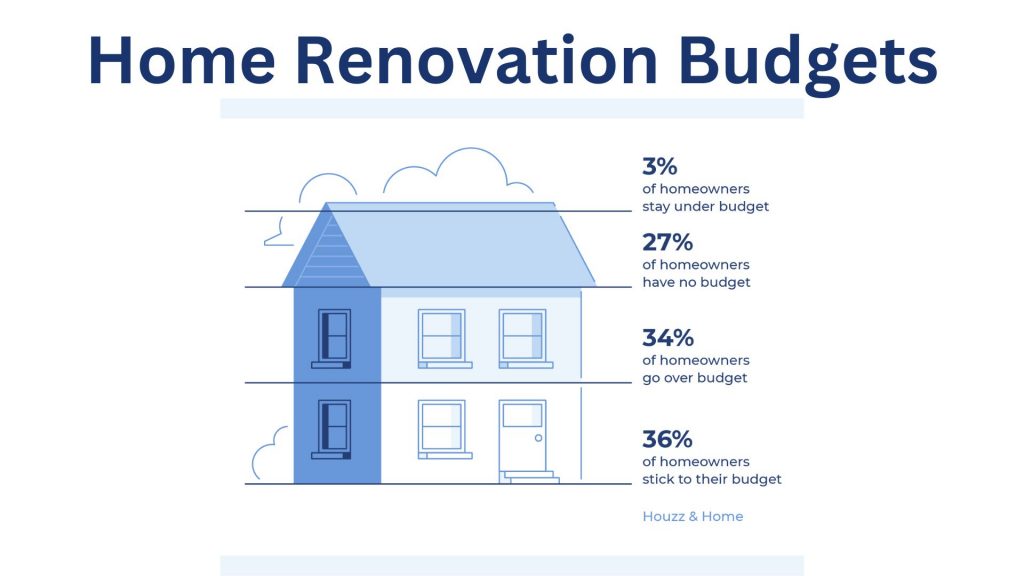
Reasons for Renovations in the United States
People undertake home renovations for various reasons:
- Finally Have the Time: 44% of individuals renovate when they finally have the time.
- Have Sufficient Budget: 36% renovate when they have enough money.
- Customizing Recently Purchased Home: 22% customize their newly bought homes.
- Lifestyle Changes: 18% renovate due to lifestyle changes.
- Damage in Old Houses: 15% renovate to address issues in older houses.
- Increasing Home Value Before Selling: 10% renovate to boost the value of their home before selling.
- Damage from Natural Disasters: 5% renovate due to damage caused by natural disasters.
Reasons for Home Improvement by Region
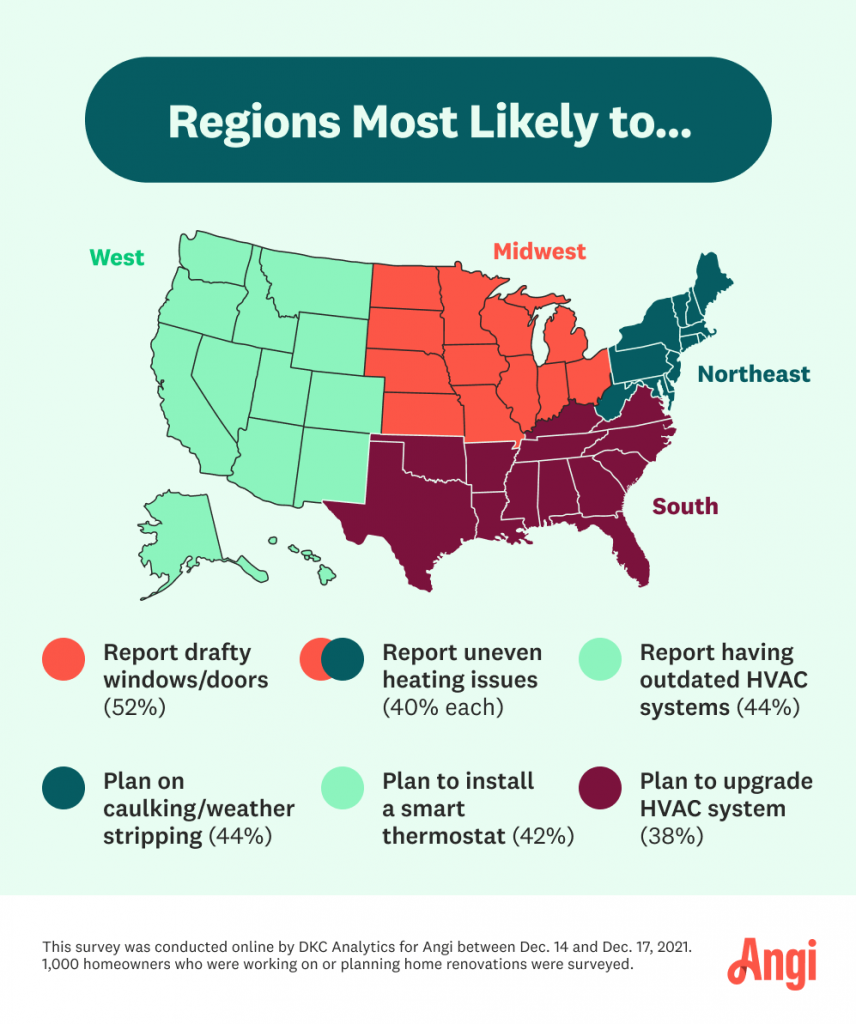 (Source: angieslist.com)
- Midwest:
- Drafty Windows and Doors: 52% of people in the Midwest reported this issue.
- Uneven Heating: 40% of individuals in the Midwest faced uneven heating problems.
- Northwest:
- Caulking or Weather Stripping: 44% of people in the Northwest planned home improvements for this reason.
- Uneven Heating: 40% of individuals in the Northwest also experienced uneven heating issues.
- West:
- Outdated HVAC Systems: 44% of people in the West had outdated HVAC systems.
- Smart Thermostat Installation: 42% of individuals in the West planned to install a smart thermostat.
- South:
- HVAC System Upgrades: 38% of people in the South were planning to upgrade their HVAC systems.
Top Factors Motivating Homeowners for Home Improvement
Homeowners are motivated for home improvement by various factors:
- Fixing Existing Issues: 47% of homeowners undertake renovations to address existing problems.
- Increasing Home Value: 43% aim to boost their home's value.
- Improving Aesthetic Design: 39% focus on enhancing the visual appeal of their homes.
- Making Maintenance Easier: 33% want to make home maintenance tasks more manageable.
- Making the Home Smarter: 31% are interested in adding smart features to their homes.
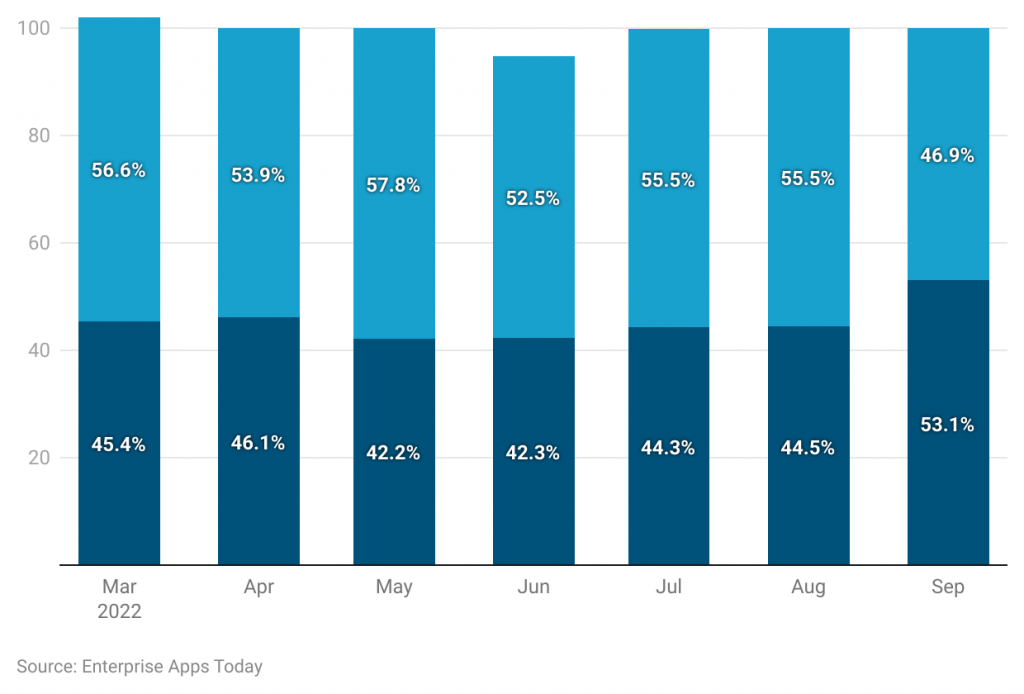
Postponed Home Improvement or Remodeling Projects Statistics
 (Source: hiri.org)
Many homeowners worldwide had to delay their renovation plans for various reasons:
- By the end of March 2022, 43.4% of homeowners had to cancel their projects.
- In April, the cancellation rate increased to 46.1%.
- May saw a cancellation rate of 42.2%.
- In June, it was 42.3%.
- July had a cancellation rate of 44.1%.
- In August, it was 44.5%.
- In September, the cancellation rate reached 53.1%.
- October saw a cancellation rate of 51.1%.
- November had the highest cancellation rate at 57%.
Young DIY Homeowners' Online Sources for Home Improvement
Young DIY homeowners rely on various online sources for home improvement information:
- Home improvement store websites are the most popular at 77%.
- 58% use search engines like Google.
- Amazon is used by 42% of young DIY homeowners.
- 37% visit manufacturer's websites.
- 23% check out local hardware store websites.
- 22% explore consumer review websites.
- 18% visit warehouse club websites.
- 17% turn to social media.
- 9% seek inspiration from design or media websites.
- 8% shop from online-only retailers.
Inspiring Statistics For Home Improvement Projects
Homeowners find inspiration for home improvement from various sources:
- Online content is the top source, inspiring 40% of homeowners.
- Friends and family, as well as home improvement TV shows, each inspire 30% of homeowners.
- 28% are motivated by the desire to increase home value for selling purposes.
- Magazines inspire 17% of homeowners.
- 15% draw inspiration from real estate listing photos.
- 9% are influenced by influencers and celebrities.
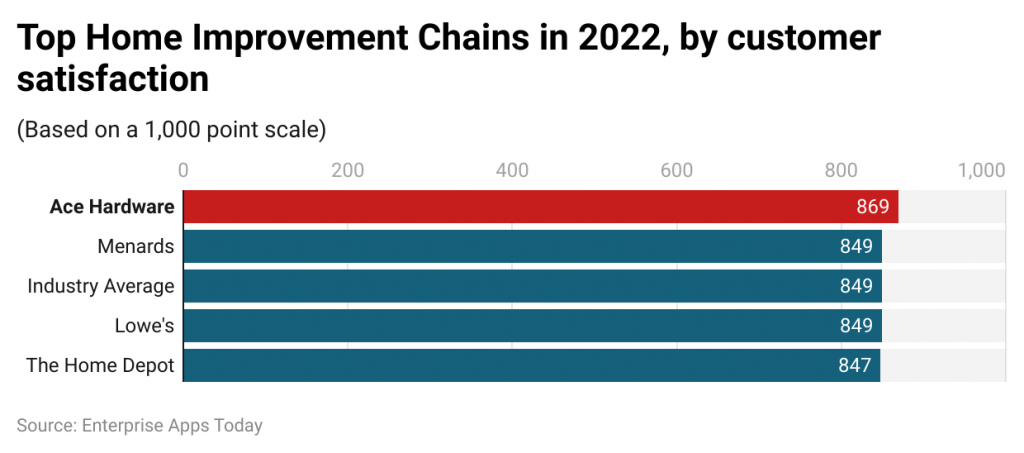
Top Home Improvement Chains' statistics by Customer Satisfaction
 (Source: todayshomeowner.com)
Some Important Home Improvement Statistics
 (Source: raleighrealtyhomes.com)
- According to Statista in the United States, the market for home improvement will reach $20.4 billion.
- Whereas in the 1st quarter of 2022, the spending on home repair and improvement turned out more than $19 billion.
- More than 55% of American homeowners have invested more than $15,000 for home renovation projects by the end of 2022.
- The sales of hardware in 2022 reached $67 billion which has increased by $4.1 billion from the previous year.
- By the end of 2022, around 2,007 stores of Home Depot were present in the United States, whereas Canada and Mexico were having a total of 2,322 stores.
- In the United States in 2022, there were around 493,728 remodeling businesses which have increased by 3.8%.
Home Improvement Project Statistics by Funding
Homeowners use various sources to fund their home improvement projects:
- Cash from Savings: $3,995
- Cash from Home Refinancing: $13,300
- Home Equity Loan: $11,240
- Insurance Settlement: $12,690
- Credit or Retail Card: $3,121
- Contractor Financing: $8,714
- Other Sources: $7,283
Home Improvement Retail Industry Sales Statistics in The U.S.
The home improvement retail industry generates revenue from various sectors:
- Indoor Gardening: Accounts for 52% of total revenue, resulting in $14.99 billion.
- Appliances: Contribute 18% of total revenue, resulting in $14.46 billion.
- Electrical and Lighting: Constitute 73% of total revenue, resulting in $13.74 billion.
- Lumber: Represents 55% of total revenue, amounting to $13.46 billion.
- Plumbing: Comprises 10% of total revenue, totaling $12.6 billion
Conclusion
As of now after completing the article on Home Improvement Industry Statistics it can be stated that around 84% of homemakers have successfully completed all projects based on home by the end of 2022. Recently the projects of home improvement are expected to decline because of several marketing issues such as mortgage refinancing and stalled home sales.
Despite all those factors, the spending on home improvement has increased by maximum homeowners over the globe as it enhances their living spaces. As of reports the spending of homeowners was increased by $472 billion by the end of 2022. This article includes several effective statistics that allow an understanding of how important are the facts of home improvement projects.
FAQ.
The global industry of home improvement is growing enormously and in 2023 it has grown by $343.8 billion and which has annually grown by 5% of CAGR and the DIY home improvement market size was estimated to $773.90 billion.
Yes the demands of home industry are growing annually each year across the world as well as in the United States too. In the U.S the market size has reached by $558.3 billion and it is expected to be $621.3 billion by the end of 2025.
First an individual needs to have a plan, add value when needed, tackle quick, time sensitive projects, finding out DIY threshold, bone up on DIY knowledge, saving money, understanding financing options, getting effective tools right, finding out proper contractor, and always keeping next project in mind.

Barry is a lover of everything technology. Figuring out how the software works and creating content to shed more light on the value it offers users is his favorite pastime. When not evaluating apps or programs, he's busy trying out new healthy recipes, doing yoga, meditating, or taking nature walks with his little one.