
Huawei Statistics By Market Share, Countries, Region, Customer Group, Operating System, Industry, Demographics, Category Distribution and Social Media
Page Contents
- Introduction
- Editor’s Choice
- Facts About Huawei
- General Huawei Statistics
- Huawei Market Share Statistics in China
- Huawei Statistics by Market Share of India
- Huawei Market Share Statistics by Countries
- Huawei Mobile Market Share Statistics by Region
- Huawei Statistics by Customer Group
- Huawei Revenue Statistics by Region
- by Operating System
- by Industry
- by Demographics
- by Category Distribution
- by Social Media
- by Website Traffic
- by Traffic Source
- Huawei Mobile Statistics by Worldwide Market Share
- Base Station Market Share Statistics
- by Country Patent
- by Career Market
- Conclusion
Introduction
Huawei Statistics: As per reports by the end of 2022, the total assets of Huawei will be approximately amounted to 1064 billion Yuan and the leading international Smartphone manufacturer has generated around 642 billion Yuan. Huawei is an information and communication Technology Company that specializes in telecommunications equipment, located in Shenzhen, Guangdong, China. The company was founded by Ren Zhengfei in 1987. In recent days, the popularity of the company has enhanced across the world. These Huawei Statistics include insights from various aspects that provide light on how fast the industry is growing enormously across the world.
Editor’s Choice
- Huawei is the sixth largest Smartphone manufacturer company in the world with was 4% smartphone market share in July 2023.
- As of 2023, the market share of China's highest Smartphone vendors is 23.22%, which has decreased from last year by 10.24%.
- Around 197,000 people are currently employed by Huawei Technologies Co.
- Huawei Chinese users were between the age group of 24 to 29 years which is 29.9%.
- As of 2022, revenue earned by Huawei was $92,379 million and operating profit turned out to be $6,071 million with a 6.6% margin.
- By the end of 2022, Huawei’s total active patents were above 120,000 of which 55.4% have worked in the R&D department.
- The total investment of Huawei in R&D was increased by CNY997.3 billion in 2022.
- As of 2023, the desktop user of Huawei is 15.84%, and mobile users are 84.16%.
- Huawei is still leading the race to develop 5G core solutions and use cases across the world in 2022.
Facts About Huawei
- As of 1st quarter of 2022, Huawei was the leading the market of global 400G WDM market with 35% of the market share.
- In the 2nd quarter of 2022, as per reports of China's global markets, the shipment of mobile phones decreased by 14.7%, in which Huawei was leading in smartphone shipment holding a market share of 63.6%.
- In January 2022, Among the world’s top valuable mobile brands, Huawei ranked 9th position, holding a market value of $71.2 billion.
- As of 2023, 5G subscriber share by RAN vendor was highest in Huawei with 24.8%, which is followed by Ericsson (22.9%), and Nokia (22.7%).
- In 2022 the leading patent applicant at EPO was Huawei with a total of 4,505 patent applications.
- Over the world Huawei marketplace, AppGallery, and app distribution had 580 million active users by the end of 2022.
- Monthly active users of Huawei smartphones were approximately 420 million in 2022.
- HarmonyOS 3 was launched by Huawei which includes an upgraded version operating system that allows for expanding super device capabilities.
- HarmonyOS was deployed on 330 million Huawei devices and used in 12 different types such as smartphones, PCs, Huawei Vission products, tablets, smartwatches, earphones, and head units for enabling enhanced interaction.
- In the 2nd quarter of 2022, Huawei’s tablet shipment turned out to 1,039 and the market share was 17.7% which is a growth of 0.5% from last year.
General Huawei Statistics
- As of 2022, revenue earned by Huawei was $92,379 million (CNY642, 338 million) which was reduced by 35.6 billion Yuan from last year.
- The operating profit turned out to be $6,071 million (CNY42,216 million) with a 6.6% margin.
- The other financial performance experienced by the company in 2022 was Net profit (CNY35,562 million), Cash flow from operating activities ($17,797 million), and Cash and short-term investments (CNY373,452 million).
- In 2022, the working capital required by the company was CNY344,, 938 million whereas, the total assets and total borrowing turned out CNY1,063,804 million and CNY197,144 million respectively.
- Lastly, in the forecast year, the liability ratio was 58.9% and equity turned out CNY437,076 million.
- As of March 2022, the latest investment of Huawei has raised $1 million for Innova Solution Tech.
- As of July 2023 across the world, a website ranked 4th position was huawei.com. and the global rank of China was 52nd.
- In the 2nd quarter of 2022, the sales of revenue of Huawei turned out $44.7 trillion (301.6 billion Yuan) which was comparatively lower than last year.
- In the first half of 2022, more than 181 million Huawei new devices connected with HarmonyOS were shipped and connected devices exceeded almost 50,000 by the end of 2022.
 (Reference: bankmycell.com)
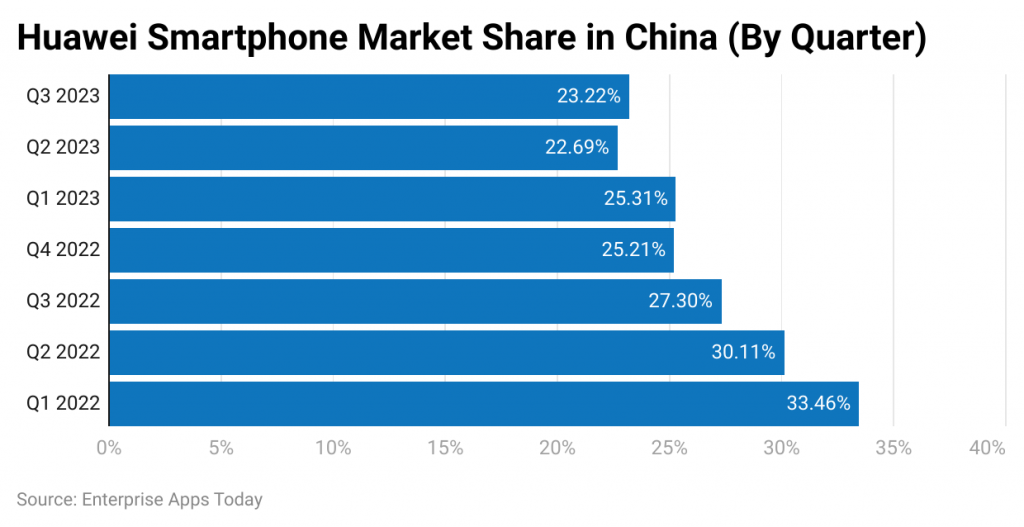
- In the 1st quarter of 2022, the market share of Huawei smartphones in China was 33.46% across the world, which is followed by 2nd quarter (30.11%), 3rd quarter (27.30%), and 4th quarter (25.21%).
- In the 1st quarter of 2023, the smartphone market share in China was 25.31%, which is followed by 22.69% (2nd quarter), and 23.22% (3rd quarter).
- Thus, it has been observed that the smartphone market has declined by 10.24% in 2023 from last year.
- By the end of July 2023, revenue generated by Huawei over the world is CNY310.9 billion which has increased by 10% from last year and the net profit margin turned out 15%.
- The revenue earned by the following industry types were ICT Infrastructure CNY167.2 billion, Consumer business (CNY10.5 billion), Digital Power business (CNY24.2 billion), Cloud Computing (CNY24.1 million), and Intelligent Automotive Solutions (CNY1 billion).
 (Reference: bankmycell.com)
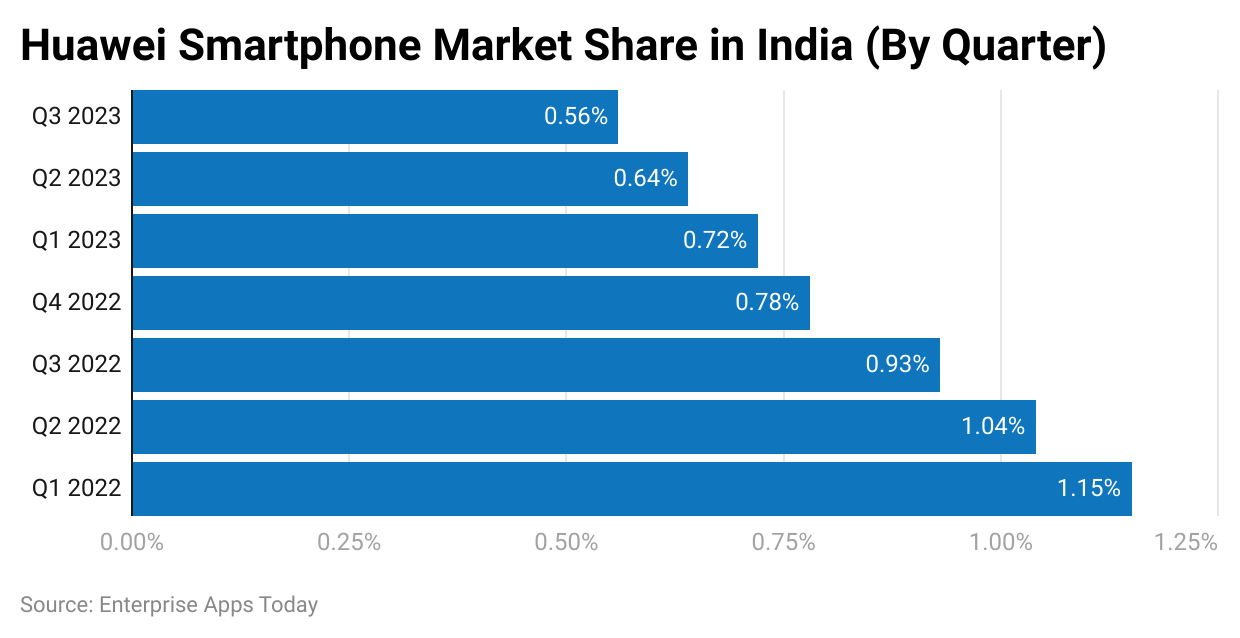
- In 2022, the Indian market share of Huawei smartphones remained highest in the 1st quarter (1.15%), which is followed by 2nd quarter (1.04%), 3rd quarter (0.93%), and 4th quarter (0.78%).
- As of 2023, the market share turned downward in 1st quarter with 0.72%, 2nd quarter (0.64%), and 3rd quarter (0.56%).
- In the Indian smartphone market, Huawei ranked 11th position in 2023 with a decrease of 0.30% from last year
 (Source: statista.com)
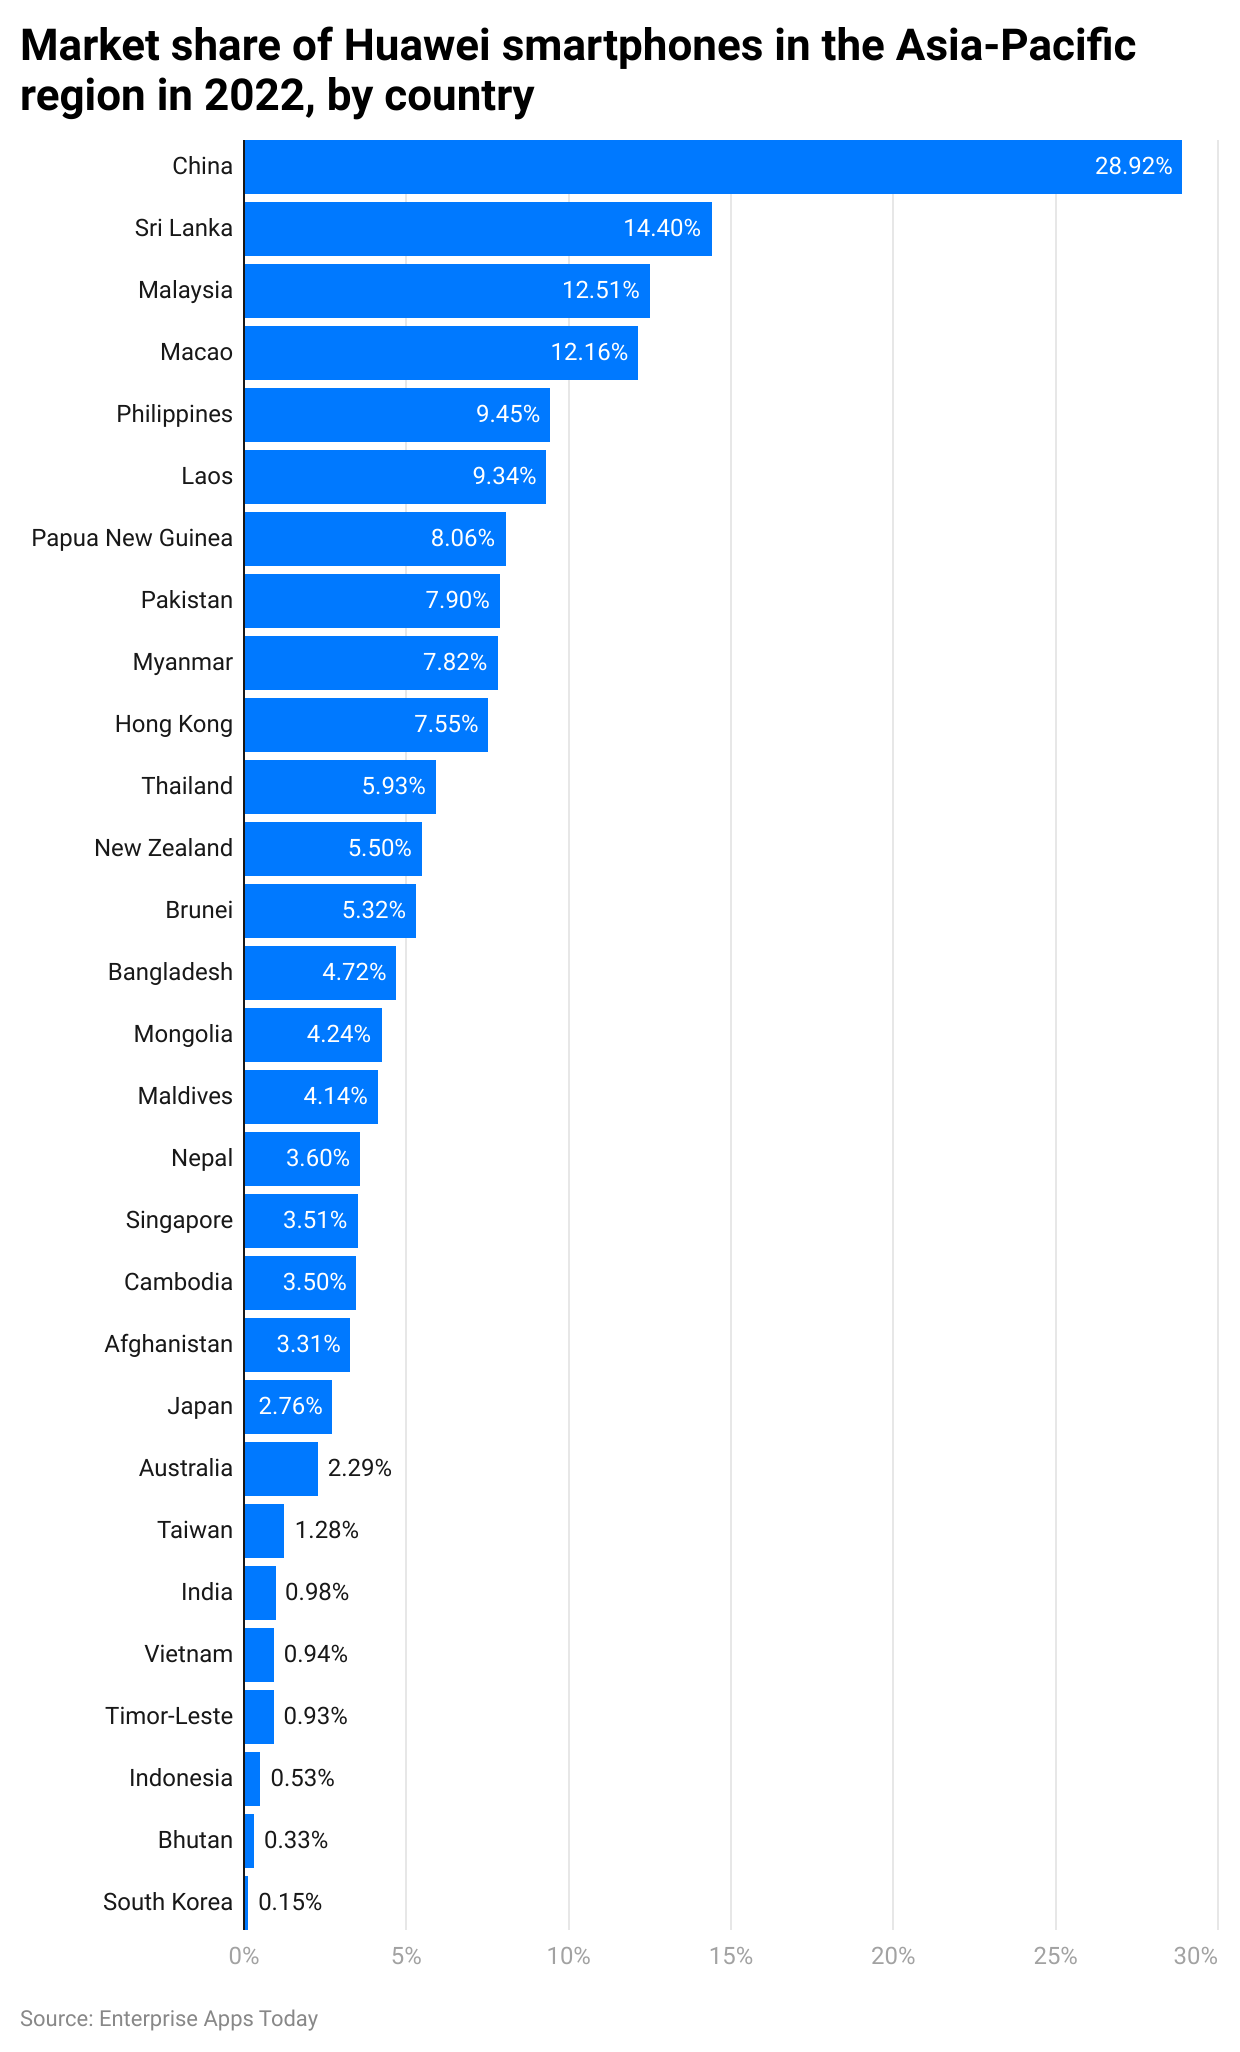
- By the end of 2022, the market share of Huawei smartphones was highest in the Asia-Pacific region.
- The market share of China had the highest market share 28.92%.
- Furthermore, other countries market share was followed by Sri Lanka (14.4%), Malaysia (12.51%), Macao (12.16%), Philippines (9.45%), Laos (9.34%), Papua New Guinea (8.06%), Pakistan (7.9%), Mayanmar (7.82%), Hong Kong (7.55%), Thailand (5.93%), New Zealand (5.5%), Brunei (5.32%), Bangladesh (4.72%), Mongolia (4.24%), Maldives (4.14%), Nepal (3.6%), Singapore (3.51%), Cambodia (3.5%), Afghanistan (3.31%), Japan (2.76%), Australia (2.29%), Taiwan (1.28%), India (0.98%), Vietnam (0.94%), Timor-Leste (0.93%), Indonesia (0.53%), Bhutan (0.33%), and South Korea (0.15%).
Africa
- In 2022, month-wise market share is followed by July (12.94%), August (12.03%), September (11.47%), October (11.02%), November (11.32%), and December (11.49%).
- As of 2023, January (11.14%), February (11.34%), March (10.83%), April (10.4%), May (10.49%), June (10.36%), and July (9.51%).
Asia
- In 2022, month-wise market share is followed by July (7.13%), August (6.64%), September (6.25%), October (5.87%), November (5.24%), and December (5.74%).
- As of 2023, January (4.74%), February (4.93%), March (4.38%), April (4.06%), May (3.91%), June (4.09%), and July (4.29%).
Europe
- In 2022, month-wise market share is followed by July (8.55%), August (8.31%), September (7.53%), October (6.73%), November (6.97%), and December (6.83%).
- As of 2023, January (6.43%), February (6.39%), March (6.33%), April (6%), May (5.36%), June (5.3%), and July (5.17%).
North America
- In 2022, month-wise market share is followed by July (1.4%), August (1.5%), September (1.39%), October (1.24%), November (1.15%), and December (1.17%).
- As of 2023, January (1.15%), February (1.12%), March (1.05%), April (1.07%), May (0.99%), June (0.93%), and July (0.9%).
Oceania
- In 2022, month-wise market share is followed by July (3.84%), August (2.84%), September (2.29%), October (2.07%), November (2.13%), and December (2.08%).
- As of 2023, January (1.82%), February (1.82%), March (1.75%), April (1.66%), May (1.51%), June (1.39%), and July (1.36%).
South America
- In 2022, month-wise market share is followed by July (4.89%), August (4.78%), September (4.62%), October (4.38%), November (4.14%), and December (3.86%).
- As of 2023, January (3.65%), February (3.46%), March (2.94%), April (3.44%), May (3.38%), June (3.02%), and July (2.84%).
Huawei Statistics by Customer Group
- The customer group is segmented into 3 important sections, and in 2022 the market share of Carrier Business ranked top position with CNY283,978 million which was increased from last year.
- Revenue generated by the following groups are Enterprise Business (CNY133,151 million), Customer Business (CNY214,463 million), and others (CNY10,746 million).
Huawei Revenue Statistics by Region
 (Source: substackcdn.com)
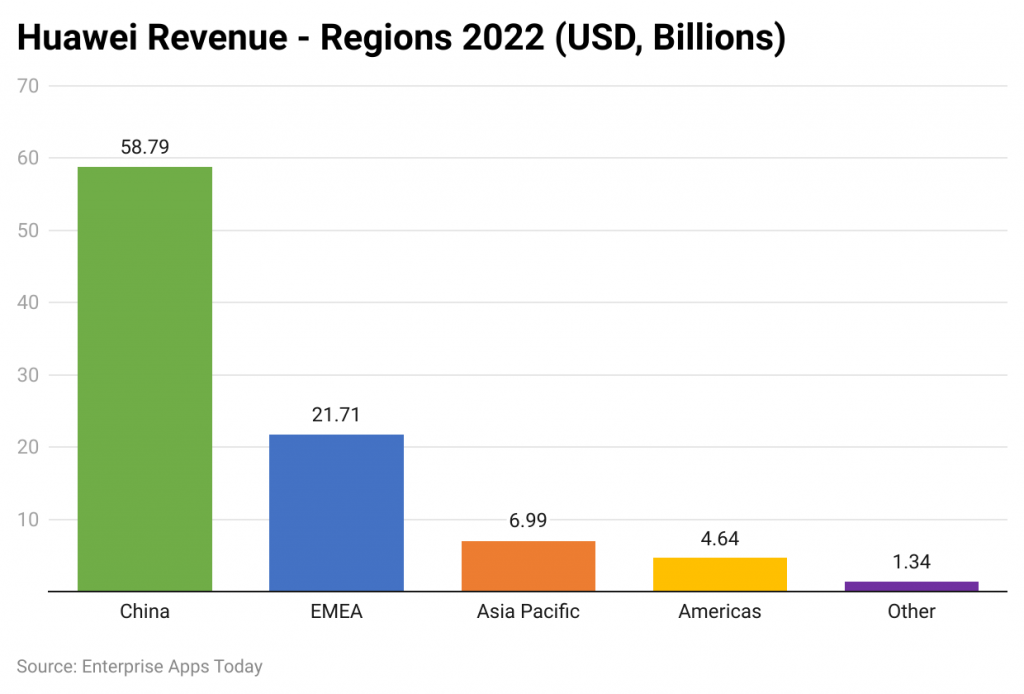
- As of 2022, China generated the highest revenue in Huawei was CNY404,999 million ($58.79 billion )
- Revenue generated by Europe, the Middle East, and Africa was CNY149,206 million ($21.71 billion).
- Other regions are followed by Asia Pacific (CNY48,048 million/ $6.99 billion), Americas (CNY31,898 million/ $4.64 billion), and others (CNY9,187 million/ $1.34 billion).
by Operating System
- By the end of the 4th quarter of 2022, the global Huawei smartphone sales have fallen by 14% from last year. IOS was reduced by 12% and Android was reduced by 16%.
- Huawei covered HrmonyOS active installations by 320 million in 2022.
- As of March 2022, Huawei’s Harmony OS accounted for 2% Smartphone market share.
by Industry
 (Source: totaltele.com)
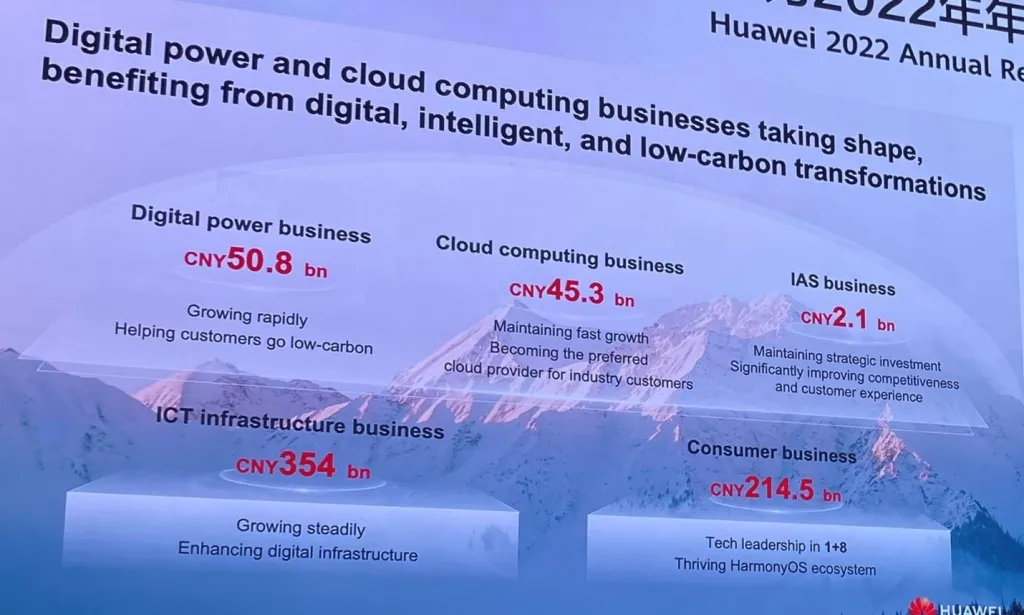
- In Huawei company, the revenue generated in 2022 by ICT Infrastructure was CNY353,978 million.
- The revenue earned by the following industry types were Consumer (CNY214,463 million), Digital Power business (CNY50,806 million), Cloud Computing business (CNY45,342 million), Intelligent Automotive Solutions (CNY2,077million), and other (CNY,978 million).
- Overall revenue earned by different industries was CNY642,338 million.
by Demographics
- As of July 2023, the Huawei statistics by the demographic state, the highest number of users observed is between the age group of 18 – 24 years resulting in 21.15%.
- There are 37.18% of users aged between 25 – 34 years.
- 22.08% and 10.45% belong respectively to 35 – 44 years and 45 – 54 years.
- 5.93% of users were aged between 55 – 64 years.
- Lastly, 3.22 of Huawei users contributed from the age group above 65 years.
- The major users of Huawei websites are 71.93% male, and 28.07% female as of now.
by Category Distribution
- As of 2022, the top share category of Huawei was Programming and Develop Software was 64.01%.
- The other categories share are followed by Consumer Electronics (8.44%), and Computer Electronics and Technology (3.80%).
- The share of Search Engines and Video game consoles and Accessories were 3.67% and 3.56% respectively.
- Whereas, another category share distribution was 16.52%
by Social Media
- YouTube has the highest rate of social media referral rate resulting in 45.60% than other social networks.
- Facebook and WhatsApp contribute by 15.22% and 12.56% respectively.
- Traffic sent by LinkedIn is 6.24% and Twitter contributes by 4.85%.
- Other social media networks with nominal contribution percentages collectively make up 15.52%.
by Website Traffic
 (Source: similarweb.com)
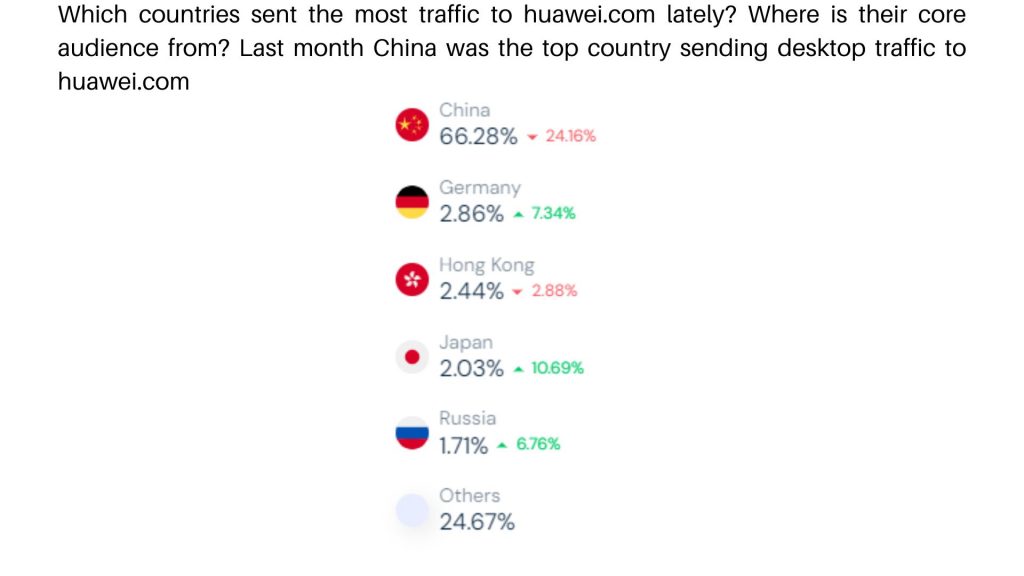
- In July 2023, China had 66.28% of total traffic on huawei.com, but it recorded a decrease in total website visitors by 24.16%.
- Other countries recorded the following contribution in total traffic: Germany = 2.86% (increased by 7.34%), Hong Kong = 2.44% (decreased by 2.88%), Japan = 2.03% (increased by 10.69%), Russia = 1.71% (increased by 6.67%), and other countries collectively made around 24.67%.
by Traffic Source
 (Source: similarweb.com)
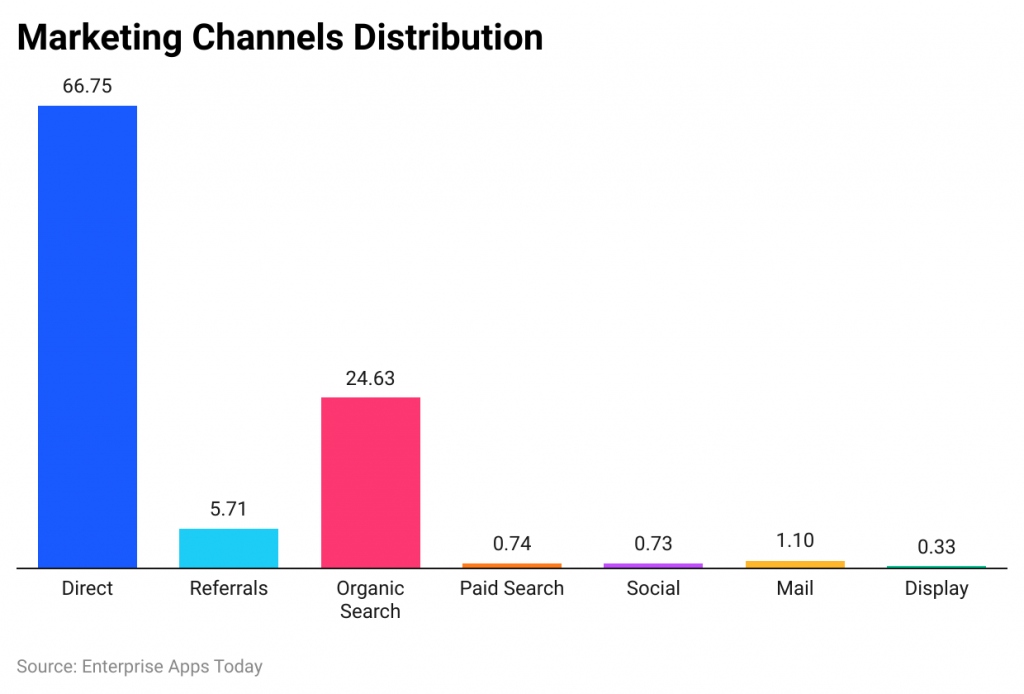
- As per Huawei statistics, the highest rate of traffic towards huawei.com is by organic search resulting in 24.63%.
- 66.75% is direct traffic while 5.71% is from referrals of social media networks etc.
- Furthermore, other traffic sources towards huawei.com are paid search (0.74%), Social (0.73%), Mail (1.10%), and Display (0.33%).
 (Source: statcounter.com)
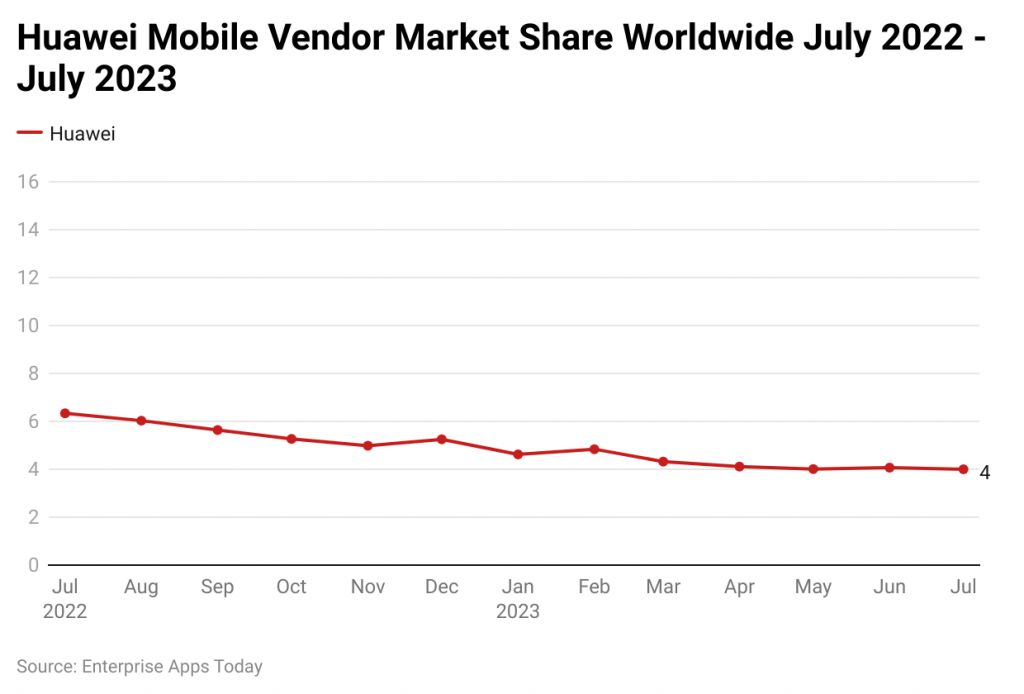
- The above image describes the Huawei mobile worldwide market share from July 2022 to July 2023.
- In 2022, month-wise market share is followed by July (6.34%), August (6.03%), September (5.64%), October (5.27%), November (4.98%), and December (5.25%).
- As of 2023, January (4.62%), February (4.84%), March (4.32%), April (4.11%), May (4.01%), June (4.07%), and July (4%).
- As of July 2022-July 2023, Huawei mobile vendor in China holds the 2nd position with 24.8% of the market share.
- The other countries are followed by the United States with 0.3% market share, United Kingdom (3.32%), Canada (1.48%), Germany (6.07%), Afghanistan (2.93%), Bangladesh (3.78%), Australia (1.5%), Bhutan (0.35%), Brazil (0.14%), Cuba (4.71%), Colombia (10.31%), France (6.09%), Hong Kong (6.5%), etc
- According to the reports of TrendForce in August 2022, Huawei, Ericsson, and Nokia togetherly covered a market share of 74.5% of global base stations.
- In 2022, Huawei had having 29% market share in the global base station of mobile communication, which decreased by 1% from last year.
- Huawei partnered with other mobile operators in South Africa
- Rain and MTN for launching more than 2,500 5G base stations.
- Huawei in 2022 has expanded its market in Brazil, South Africa, Turkey, Saudi Arabia, and Vietnam.
by Country Patent
 (Source: relecura.com)
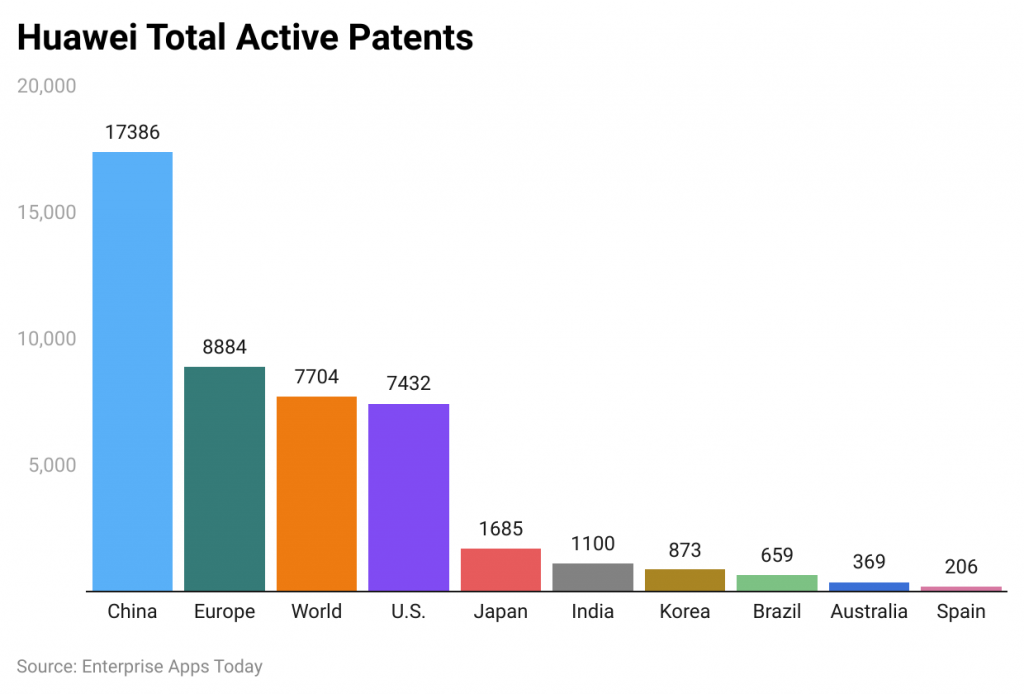
- By the end of 2022, Huawei’s total active patents were above 120,000.
- As of 10 January, China was holding the highest position with 17,386 patent documents.
- Furthermore, the second and third positions of patent authorities are in Europe and the world with 8884 and 7704 documents respectively.
- Other countries' patent documents are followed by the U.S. (7,432), Japan (1685), India (1100), Korea (873), Brazil (659), Australia (369), and Spain (206).
by Career Market
 (Source: huawei.com)
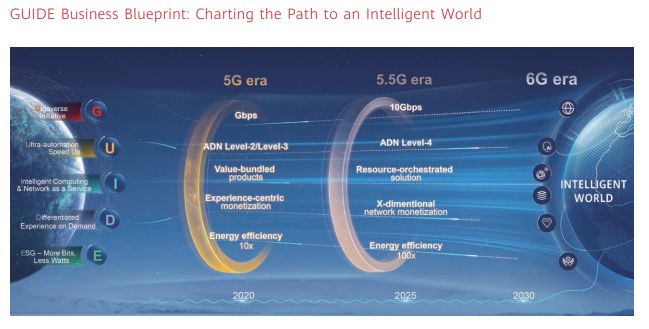
- By the end of 2022, 5G has helped in enhancing the development stages of Huawei, there were over 1 billion 5G users across the world.
- Huawei has started developing its green indicator system by featuring 3 layered architecture solutions such as green sites, green networks, and green operations.
- By the end of 2025, Huawei is looking forward to the 5.5G era from the 5G era. The features of the 5.5G era include 10Gbps, ADN Leve-4, Resource-orchestrated solution, X-dimensional network monetization, and Energy efficiency 100x.
- Huawei also worked with other Chinese carriers to fully implement autonomous networks.
Conclusion
As of now after completing the article on Huawei statistics it is clear that the company has played an effective role in enhancing the market share. From the start of 2022 Huawei company faced many external challenges that disturbed the operations and functions of Huawei. It has been experienced that in 2022 net profit earned by Huawei Company Ltd. was 35.6 billion Yuan or $5.18 billion which has positively declined by 69% from last year. These articles include many effective statistics that will allow an understanding of the business of the Chinese telecommunication industry.
FAQ.
As of 2022, the lastest foldable phone was Huawei Mate X3, followed by Huawei P60 Pro, Huawei Mate 50 Pro, Huawei P50 Pocket, Huawei P50 Por, HuaweiNova 10 Pro, etc.
Google was barred from seeling Androis license to Huawei, which actually means that phone can use the base open-source cose but cant access many Google apps applications such as Gmail, Maps, YouTube, etc.
Huawei phones allow long-lasting batteries, beautiful and elegant designs, long battery life, and stunning night photography.

Barry is a lover of everything technology. Figuring out how the software works and creating content to shed more light on the value it offers users is his favorite pastime. When not evaluating apps or programs, he's busy trying out new healthy recipes, doing yoga, meditating, or taking nature walks with his little one.