
Android Statistics 2024 – By Market Share, Revenue Generation, Country, RAM Size And Usage
Page Contents
- Introduction
- Editor’s Choice
- Android Facts
- General Statistics
- Android User’s Statistics
- Android Mobile OS Statistics By Market Share
- Android Vendor’s Statistics By Market Share
- Top Android Phones Statistics By Usage
- Android Apps Statistics By Revenue Generation
- Android Mobile Statistics By RAM Size
- Android API Statistics
- Recent Android Developments
- Conclusion
Introduction
Android Statistics: Exploring Android statistics unveils a wealth of insights into the world of mobile technology. With an impressive 3 billion active devices worldwide, Android dominates the smartphone market with a commanding 80% share. In 2023 alone, the Android app market surged, generating over 180 billion USD in revenue. This staggering figure underscores the platform's economic significance and its pivotal role in shaping the digital landscape.
Additionally, Android users spend an average of 3.5 hours daily on their devices, highlighting the platform's integral role in daily routines. Understanding these statistics is crucial for businesses aiming to harness Android's vast user base and capitalize on emerging trends in the mobile market. Through this exploration, we'll delve deeper into these numbers, uncovering valuable insights that can inform strategic decision-making and drive success in the competitive world of mobile technology.
Editor’s Choice
- There are 3.3 billion Android OS users globally as of 2024.
- Android commands a 71.74% share of the global mobile operating systems market as of 2024.
- The latest version, Android 12.0.0_r46, was released on April 10, 2023.
- Samsung holds over 34% of the Android market share.
- 1.57 billion Android devices were sold in 2022.
- 96.9% of apps on the Google Play Store are free.
- Android became the most popular mobile operating system in 2014, reaching 1 billion users within a year of launch.
- Android dominates with 71.8% market share as of Q4 2022, compared to iOS's 27.2%.
- Android holds over 85% market share in Brazil, India, Indonesia, Vietnam, and Turkey.
- In the US, iOS had 56.6% market share in Q2 2022, while Android had 43%.
- Android users worldwide increased over the years, peaking in 2018.
- Samsung leads with 14.5% market share, followed by Xiaomi.
- There are 2.67 million apps on the Google Play Store as of March 2023.
- TikTok is the most downloaded app with 24 million downloads, followed by Instagram and WhatsApp Messenger.
- The top revenue-generating app is Coin Master, earning USD 47.96 million.
- Nearly 97% of all Android apps are free, with only 3.1% paid.
- Android smartphones' share decreased globally in 2022, following a decline in 2021.
- In 2021, 41% of smartphone users aged 18-34 used Android, while 58% used iOS.
- For users aged 35-54, 53% prefer Android smartphones.
- Google purchased Android Inc. for USD 50 million in 2005.
- In 2022, Android and iOS combined for 99.4% market share.
- The leading Android phone model in September 2022 was the Samsung Galaxy A12, with 2.2% market share.
You May Also Like To Read
Android Facts
- As of 2023, in over 190 countries, the no. of active users of Android is 2.5 billion.
- In 2022 the sales number of Android devices has also increased from last year by 1.57 billion.
- Android phones with targeted malware were 97% of Smartphones.
- The sales rate of Android phones has increased in the United States, Europe, Japan, India, and China.
- In the United States in 2022, the market share of Samsung increased by 26.45%, and in 2023 increased by 28.57%.
- In 2022 there were 133.4 million active users of Android in the U.S.
- As of January 2022, there were 110 million active Android TV operating systems over the world.
- The annual shipment of Android of 1.57 million by the end of 2022.
- In 2022, Samsung Galaxy A52s 5G was the best-selling Android smartphone across the globe.
- As of research, around 276 million units of Samsung were manufactured over the world in 2022 which has increased by 8 million units from last year.
- Android is a mobile operating system developed by Google.
- It was first released in 2008 and has since become the most widely used operating system for mobile devices worldwide.
- Android offers a customizable user interface, allowing device manufacturers to modify it according to their preferences.
- As of 2022, Android dominates the global smartphone market, holding over 70% of the market share.
- Google Play Store, the official app store for Android, boasts millions of applications available for download.
- Android devices come in various price ranges, from budget-friendly options to premium flagship models.
- The Android ecosystem includes smartphones, tablets, smartwatches, TVs, and even some car entertainment systems.
- Google regularly updates Android with new features and security patches to enhance user experience and protect against vulnerabilities.
- Android's open-source nature encourages innovation and allows developers to create diverse apps for different purposes.
- Market analysts predict continued growth for Android, driven by its widespread adoption and versatility in powering various devices.
General Statistics
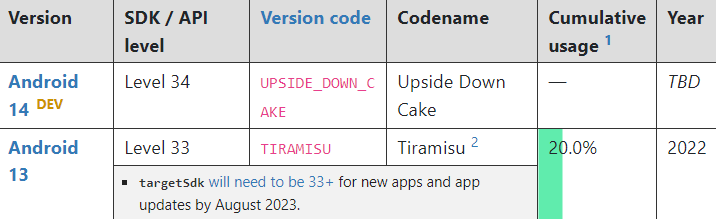
- In February 2024, Android 13 holds the highest market share among Android OS versions at 24.2%.
- As of reports in the United States 60% of smartphone users have used Android devices in 2022.
- The majority of Android users were male = 57% and female = 43% by the end of 2022.
- By the end of 2025, in Latin America, the penetration rate is expected to reach 73%.
- In 2022 android users looked out for more discounts over iOS users. Android users = 57% and iOS users = 25%
- On Google Play Store there were 3.84 million Android apps in 2022 and the number of downloaded accounted for 64.6 billion.
- Cyber attacks were experienced more on Android phones than iPhones.
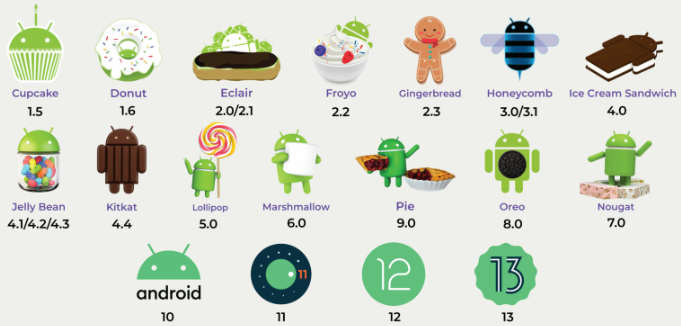
- All versions of Android operating systems were named after desserts such as Cupcakes, Donuts, Éclair, Froyo, Gingerbread, Honeycombs, Ice Cream Sandwich, Jellybeans, Kitkat, Lollipop, Marshmallow, Nougat, Oreos, and Pie.
- As of 2022, the new versions of Android were used more than Android 7 across the world.
- The market share of Android 10 was 12.5% by the end of 2022.
- Vulkan support was lacking in 42% of Android devices.
- People across the world spend only 3 hours and 42 minutes on Android devices.
- In the United States, people invest around $10.4 billion in Android app subscriptions.
- Android phone users faced 97% of malware attacks in 2022.
(Source: market.us)
No. of Android Apps Available on Google Play
As of 2022,
- March= 2,591,578
- June = 2,654,747
- September = 2,683,925
- December = 2,694.114
- As of 2023, March = 2,67,292
Types of Android Apps
- As of March 2022, in Google Play there were 3.3% paid and 96.7% free Android apps.
- June, 2022: paid = 3.2%, free = 96.8% android apps
- April, 2023: paid = 3.1%, free = 96.9% android apps
Price Statistics of Paid Android Apps
- As of July 2023, prices less than $1 = 39.5K apps are available in the Google Play store.
- Price between $1 – $2 = 27.2K apps
- Price between $9 – $10 = only 2363 apps.
Android User’s Statistics
According to Statista, in the United States, the age group that had the highest number of users is 18 – 24 years = 70% of Android users.
- 25 – 34 years = 65%
- 35 – 44 years = 58%
- 45 – 55 years = users were equally split between Android and iOS.
- 55 years and above = 38%
Comparison between Android vs. Apple Smartphone User’s Statistics by Age Group in the World
- 18 – 24 years: Android = 46%, Apple = 46%
- 25 – 34 years: Android = 45%, Apple = 40%
- 35 – 44 years: Android = 46%, Apple = 39%
- 45 – 54 years: Android = 40%, Apple = 33%
- 55 – 64 years: Android = 54%, Apple = 33%
- Above 65 years: Android = 51%, Apple = 32%
Android User’s Statistics by Country
- India = almost 100%
- Japan = 60%
- United States = 60%
- United Kingdom = 50%
- Germany = 30%
- China = 20%
- Brazil = 20%
- Nigeria = 10%
From the last decade, the OS market of Android has started to increase its market share over the world leaving other OS markets far behind in 2023.
- 1st quarter 2022 = 70.78%
- 2nd quarter = 71.72%
- 3rd quarter = 71.64%
- 4th quarter = 72.75%
- 1st quarter 2023 = 71.44%
- 2nd quarter = 70.79%
Market share Statistics by Android Version, 2023
- Version 12.0 = 25.1%, which is the highest market share and is followed by
- Version 11.0 = 23.03%
- Version 13.0 = 11.84%
- Version 9.0 pie = 8.61%
Mobile Android OS Market Share Statistics by Version in the U.S.
- As of 4th quarter 2022, 9.0 Pie = 9.28%
- 0 Nougat = 2.21%
- 0 version = 14.8%
- 0 Oreo = 2.04%
- 0 Marshmallow = 0.68%
- 11 version = 17.44%
- 1 Oreo = 2.18%
- 1 Nougat = 0.62%
- 12 version = 47.97%
- 1 Lollipop = 0.29%
- 4 KitKat =0.2%
- 0 Lollipop = 0.21%
Android Version Market Share Statistics in the world, 2023
- Android 13 = 15.72%
- Android 12 = 18.72%
- Android 11 = 24.72%
- Android 10 = 16.92%
- Pie 9 = 9.71%
- Oreo 8 = 6.61%
- Nougat 7 = 3.90%
- Marshmallow 6 = 1.60%
- Lollipop 5 = 1.50%
- KitKat 4.4 = 0.60%
(Reference: businessofapps.com)
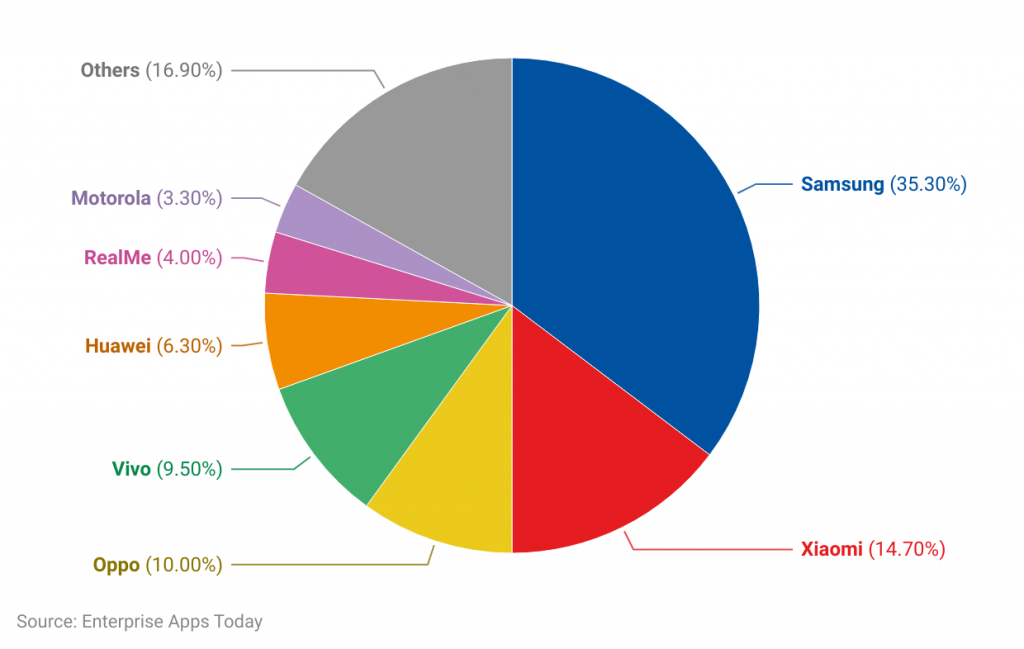
- Samsung = 35.0%
- Xiaomi = 14.70%
- Oppo = 10%
- Vivo = 9.50%
- Huawei = 6.30%
- RealMe = 4%
- Motorola = 3.30%
- Others = 16.90%
Android Market Share by the Development Tool
- Android Jetpack core = 94.18% and downloaded by 97.44%
- Android Architecture Components = 80.02% and downloaded by 91.86%
Android Market Share by the Social Library
- The top most used app was Facebook = 17.89% and downloaded by 25.60%
- Next Google Play Games Services = 4% and downloaded by 10.47%
No. of Leading Android Apps Downloaded Statistics from the Google Play store
- As of 2022, TikTok was the leading downloaded app = 23.96 million
- Instagram = 21.17 million
- WhatsApp Messenger = 20.72 million
- Stumble Guys = 17.51 million
- Snapchat = 15.27 million
- Stick War: Hero Tower Defense = 15.07 million
- Facebook = 14.22 million
- Amazon Shopping = 13.69 million
- WhatsApp Business = 12.87 million
- CapCut-Video Editor = 12.38 million
Top Android Phones Statistics By Usage
(Reference: appbrain.com)
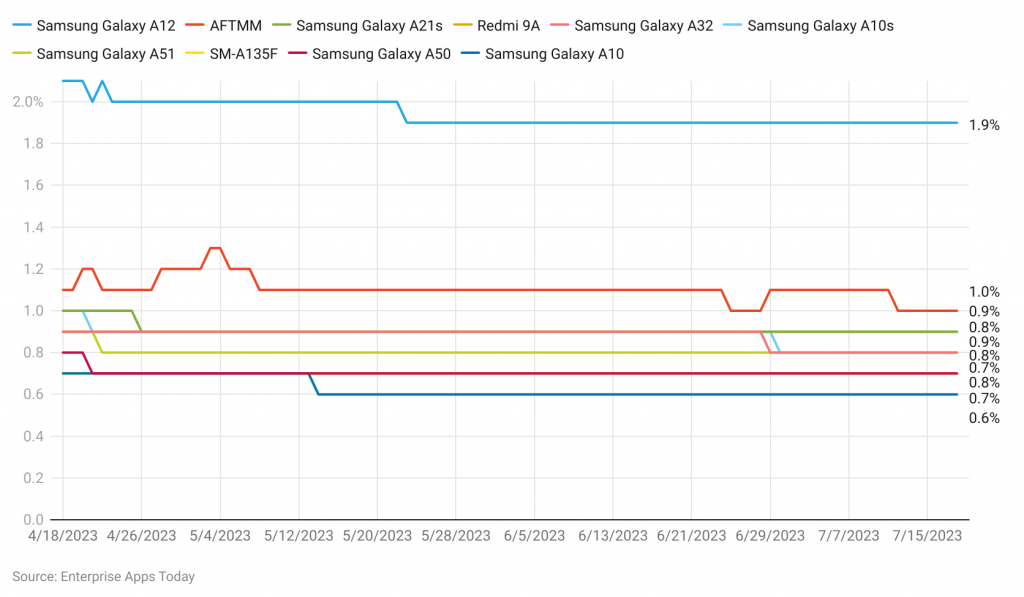
As of 2nd quarter of 2023,
- Samsung Galaxy A12 = 1.9%
- AFTMM = 1%
- Redmi 9A = 0.9%
- Samsung Galaxy A21s = 0.9%
- Samsung Galaxy A10s = 0.8%
- Samsung Galaxy A32 = 0.8%
- Samsung Galaxy A51 = 0.8%
- SM-A135F = 0.7%
- Samsung Galaxy A50 = 0.7%
- Vivo 1960 = 0.6%
Android Apps Statistics By Revenue Generation
- Coin Master = 47.96 million
- TikTok = 40.66 million
- Candy Crush Suga = 38.67 million
- Roblox = 18.26 million
- Royal Match = 12.36 million
- Garena Free Fire: 5th Anniv = 12.02 million
- Pokemon Go = 11.19 million
- Tinder: The dating app. Meet. Chat = 10.55 million
- Envoy: The King’s Return = 10.43 million
- PUBG Mobile = 9.97 million
Market Share of Mobile and Tablet Android Version
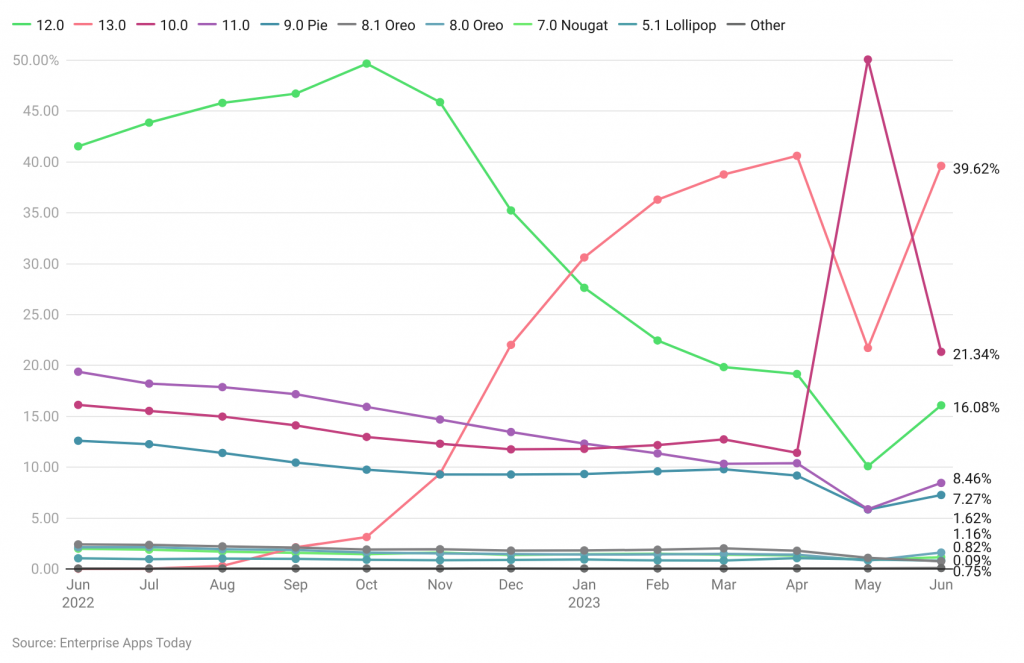
(Reference: statcounter.com)
In the United States, July 2023
- Android 12 = 43.87%
- Android 11 = 18.22%
- Android 10 = 15.54%
- 0 Pie = 12.27%
- Nougat 7.0 = 1.9%
- 1 Lollipop = 0.97%
- Android 13 = 0.03%
- As of June 2023: Android 13 = 39.62%
- Android 10 = 21.34%
- Android 12 = 16.08%
- Android 11 = 8.46%
- 0 Pie = 7.27%
- 0 Oreo = 1.62%
- 1 Lollipop = 0.82%
Android Mobile Statistics By RAM Size
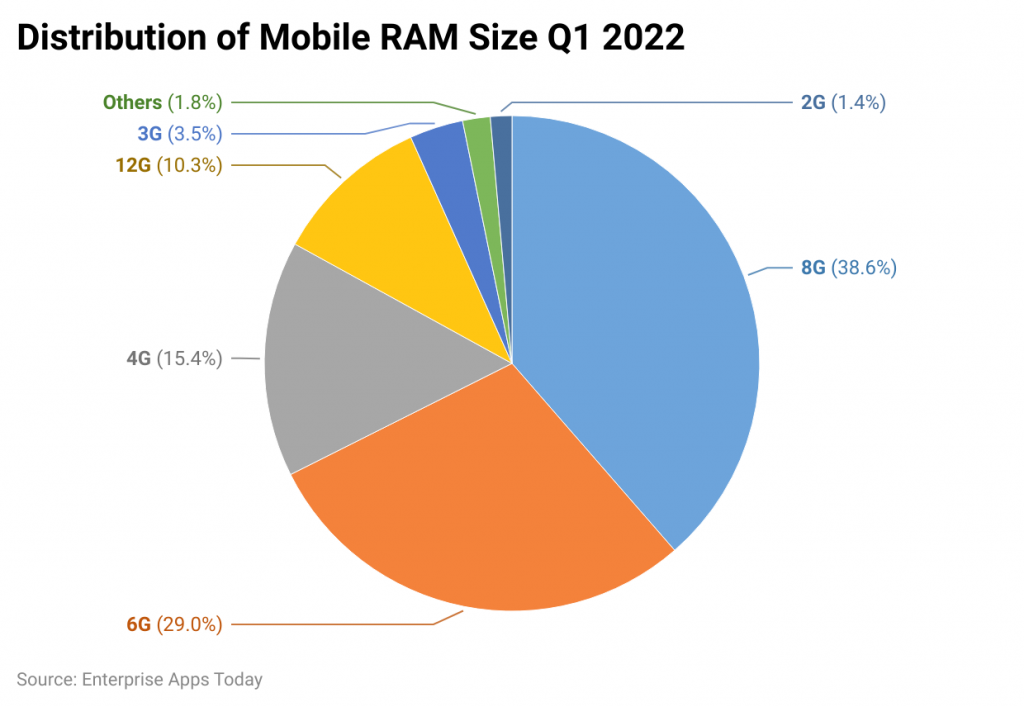
(Reference: antutu.com)
- In the 1st quarter of 2022, the market share of 8G RAM = 38.6% which was increased by 1.9% from last year.
- 6G = 29%
- 4G = 15.4%
- 12G = 10.3%
- 3G = 3.5%
- 2G =1.4%
- Others = 1.8%
Statistics by ROM Size
- In the 1st quarter of 2022, 128G = 49.8%
- 256G = 27.8%
- 64G = 16%
- 32G = 4%
- 512G = 1.6%
- 16G = 0.6%
- Others = 0.1%
Sales Statistics of Best-selling Android Smartphones in February 2022
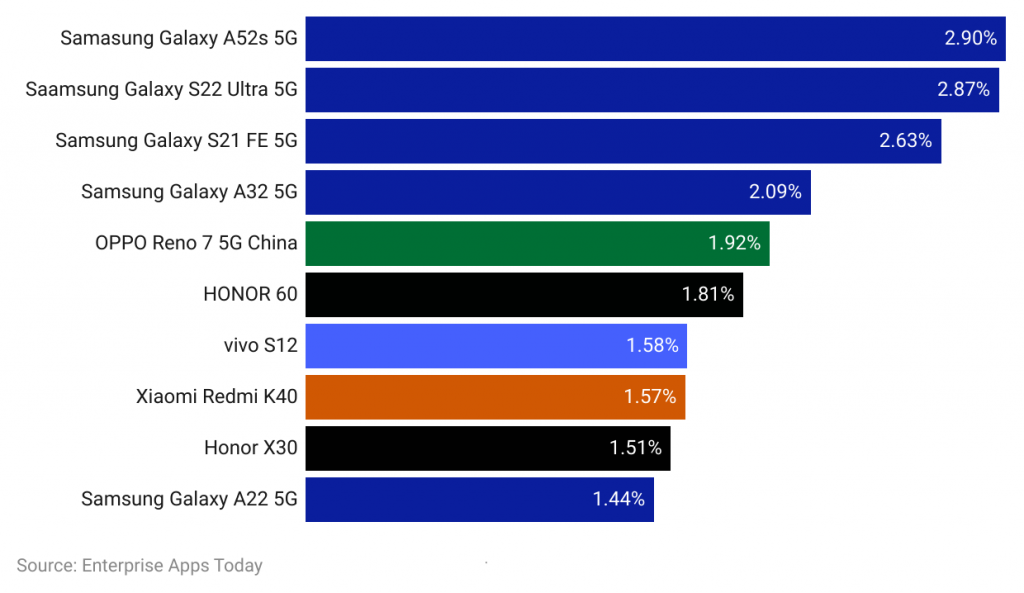
(Reference: newvisiontheatres.com)
Time Spent Statistics on Android-connected Devices
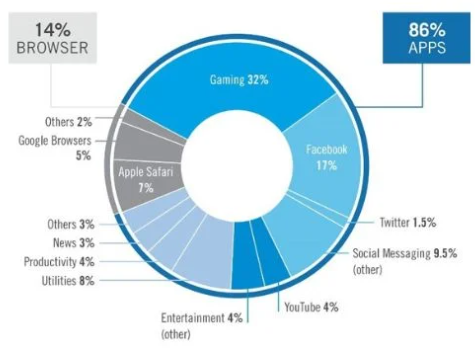
(source: newvisiontheatres.com)
Android API Statistics
(Source: apilevels.com)
Leading Android Apps by Download
- As of 2022, the most downloaded app across the world was Dessert DIY = 21.88 million
- The 2nd most downloaded app was Bucket Crusher = 21.49 million
- 3rd most downloaded app was Dream wedding = 16.39 million.
Android Mobile Statistics by Processor Brand
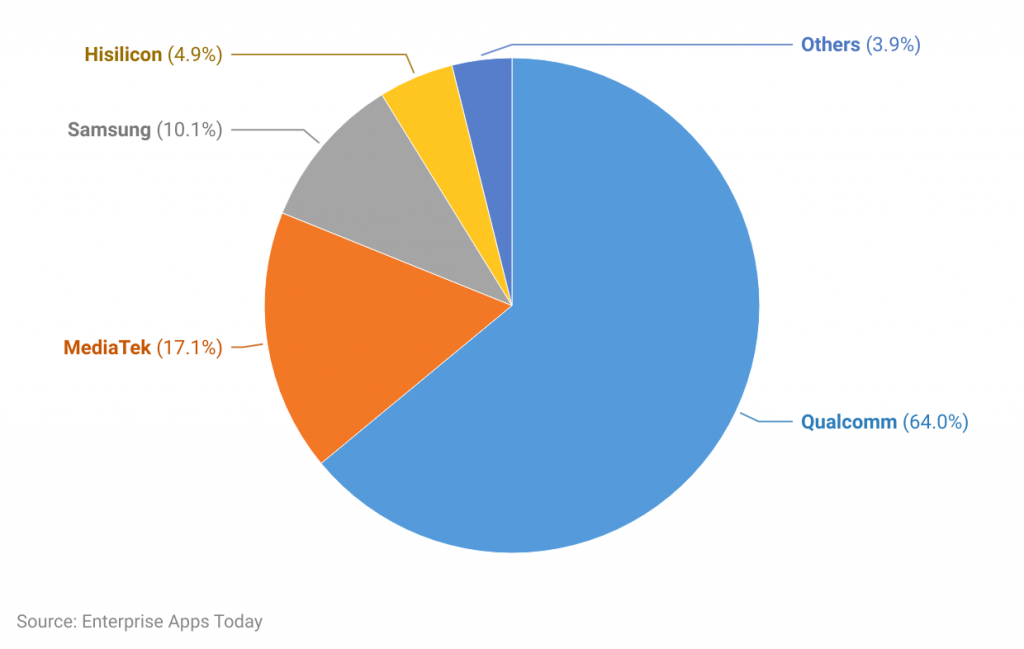
(Reference: antutu.com)
- In the 1st quarter of 2022, the market share of Qualcomm was highest = 64% which has increased by 0.6% from last year.
- Media Tek = 17.1%
- Samsung Exynos = 10.1%
- Hislicon = 4.9%
- Others = 3.9%
Recent Android Developments
- Google announced Android 13 with improved privacy features and performance enhancements.
- Android 13 introduces a new “Private Compute Core” for processing sensitive data locally on the device.
- Enhanced security measures in Android 13 aim to protect user data from potential breaches and unauthorized access.
- Google emphasizes user-centric design changes in Android 13 to enhance user experience and satisfaction.
- Market analysis indicates a positive reception to Android 13, with early adoption rates surpassing previous versions.
- Android 13's focus on privacy aligns with consumer demand for more control over their data, potentially boosting user trust and loyalty.
- Developers are encouraged to optimize their apps for Android 13 to leverage new features and ensure compatibility with the latest OS version.
- As Android 13 gains momentum, businesses may need to prioritize updates and adaptations to capitalize on emerging opportunities within the Android ecosystem.
- Overall, the introduction of Android 13 signifies Google's ongoing commitment to innovation and addressing evolving user needs in the mobile landscape.
Conclusion
In conclusion, recent statistics on Android usage provide valuable insights into the dynamic landscape of the mobile operating system market. With Android 13 emerging as the leading version with a market share of 24.2%, followed closely by Android 11 at 20.0%, it's evident that users are actively adopting newer iterations of the OS. The steady progression towards the latest versions underscores the importance of continuous innovation and updates in meeting user expectations. As a market research analyst, understanding these trends can guide developers and businesses in aligning their strategies to cater to the evolving Android user base.
Additionally, the data collected from over 100 million monthly unique users highlights the significance of these statistics in informing decision-making processes within the industry. Moving forward, businesses must remain agile and responsive to the shifting preferences and demands of Android users, leveraging insights from market analysis to drive strategic initiatives and stay competitive in this dynamic ecosystem.
Sources
FAQ.
In 2023 the most popular brand was Android 12 and the latest version is on process is going to launch soon.
On Google Play store more than 90% applications are free on Android and very few percentage of games are paid.
There are six major activities such as on Create() , on Start() , on Resume() , on Pause() , on Stop() , and on Destroy().
The fundamental components of Android are activities, views, intents, services, content providers, fragments and Android Manifest.

Barry is a lover of everything technology. Figuring out how the software works and creating content to shed more light on the value it offers users is his favorite pastime. When not evaluating apps or programs, he's busy trying out new healthy recipes, doing yoga, meditating, or taking nature walks with his little one.