
Tablet Statistics By Various Brand’s Market Share, Demographic, Region, Operating System and Year-Over-Year growth
Page Contents
- Introduction
- Editor’s Choice
- Things You Can Do On A Tablet
- Facts About Tablet
- General Tablet Statistics
- Simple Overview of Global Tablet Market
- Worldwide Tablet Shipment and Market Share Statistics by Number
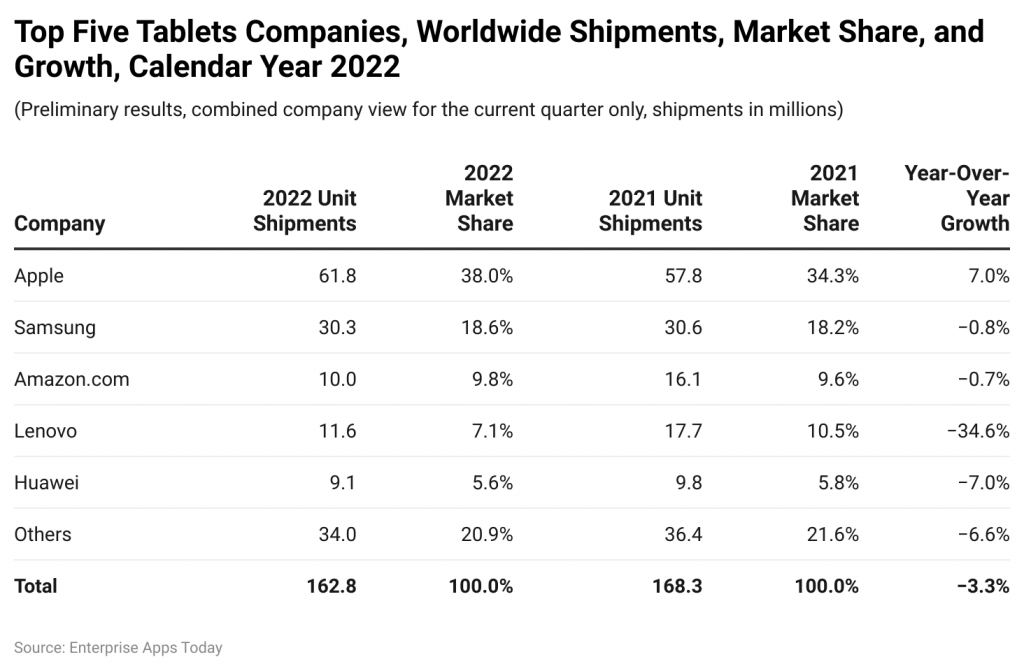
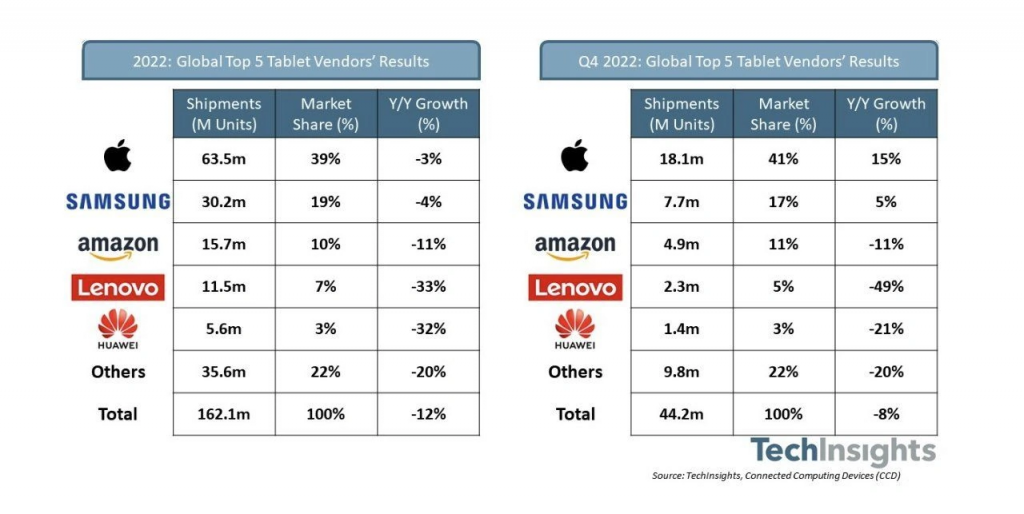
- Unit Shipments and Market Share Statistics By The World’s Top Five Tablet Companies in 2022
- U.S. Tablet Market Share: January 2022 to June 2023
- Tablet Lifespan: Software Updates vs. Hardware Durability Statistics
- Changes in Tablet Shipments by Region: Q1 2022 vs. Q1 2021
- Tablet Statistics by Various Brand’s Market Share
- U.S. Tablet Market Share Overview: End of 2022 to Q1 2023
- Tablet Market Statistics by An Operating System
- Year-Over-Year Growth of Tablet Brands in 2022
- Tablet Statistics by Demographic
- Chromebook Tablet Market Statistics by Region
- Comparison: Global Tablet Market in Q4 2022 vs. Full Year 2022
- Comparison Statistics by Market Share
- Tablet Market Share Statistics by Region in January 2023
- Global Tablet Shipment Statistics
- Tablet Market Share by Region, January 2023
- Conclusion
Introduction
Tablet Statistics: The reports say that around 163.2 million units of tablets have been shipped in 2022 across the globe and in the recent quarter of 2023 the shipment of Apple was highest with 51.07% that is followed by Samsung, Amazon, and many others. Over the tablet market, Apple and Samsung were the main leading brands. The tablet market experienced 0.3% of growth by the end of 2022 whereas a 3.3% decline at the start of 2023. These Tablet Statistics include insights from various aspects that will provide light on how the Tablet industries are enhancing so fast.
Editor’s Choice
- Around 1.28 billion people globally use tablets.
- Apple's iPad is the leading choice worldwide.
- By 2025, the forecasted tablet shipments will hit 156 million units.
- The primary use of tablets is checking emails.
- North America leads in tablet deliveries.
- Smart tablets generated a global revenue of nearly $60 billion in 2021.
- Tablets in the US now last an average of 5 years, down from 7 years.
- In 2022, the worldwide tablet market grew to $84.84 billion from $71.58 billion in 2021.
- Gen X and Millennials are the top tablet users.
- About 22-23% of users watch movies, videos, or send emails on their tablets.
- North America dominated the 2022 tablet market with a 40.2% share, contributing to $92.3 billion.
- Globally, the tablet market was valued at $9001.9 million at the end of 2022.
- In 2022, global tablet shipments were approximately 164 million units.
- During Q2 2022, 38.6 million tablets were shipped.
- Tablet shipments decreased by 5% in 2022 to 151 million units.
- Apple was the top seller in 2022, selling tablets worth $61.8 million.
- By Q3 2022, tablet shipments had decreased by 8.8% year-on-year.
- The global tablet market is expected to grow at a rate of 12.9%, reaching around $137.66 billion by 2026.
- Apple iPad: Held a market share of 20.6% in the global tablet segment during the second quarter of 2023, a jump from its 35.2% share in the previous quarter.
- Apple: Emerged as the dominant tablet brand in the U.S., capturing nearly 53.5% of the market share.
- Samsung: Occupied the second spot, holding around 20.7%.
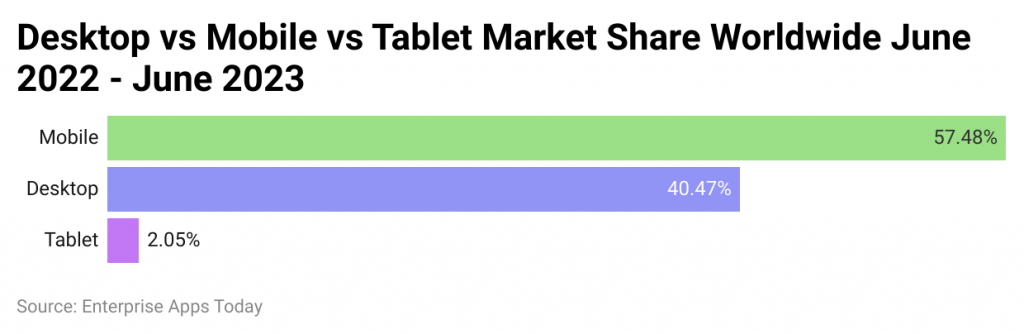
- Although tablets had a strong start, their global attractiveness has seen a decrease. As of the latest data, tablets account for less than 3% of the global market share. This is in stark contrast to mobiles, which have a market share of 56.45%, and desktops with 41.15%.
Things You Can Do On A Tablet
- If any case you are having any fault with your PC then can remotely access it with the help of a tablet.
- Free calling is another great feature using FaceTime, Skype app, and ooVoo.
- Playing retro video games and can be used as Kindle.
- Tablets also help in accessing your file from anywhere along with printing wirelessly.
- In any emergency or necessary it can be used as a second monitor, TV, or DVD player, and can be connected with many other electronic devices.
- Another important factor is that it can act as a safeguard for your home.
- This can be used for enabling directions
Facts About Tablet
- If any case you are having any fault with your PC then can remotely access it with the help of a tablet.
- Free calling is another great feature using FaceTime, Skype app, and ooVoo.
- Playing retro video games and can be used as Kindle.
- Tablets also help in accessing your file from anywhere along with printing wirelessly.
- In any emergency or necessary it can be used as a second monitor, TV, or DVD player, and can be connected with many other electronic devices.
- Another important factor is that it can act as a safeguard for your home.
- This can be used for enabling directions
General Tablet Statistics
- As of October 2022, the global market share of tablet brands in which Apple covered highest with 50.7%, Samsung = 22.91%, Unknown = 7.17%, Amazon = 5.39%, Huawei = 2.77%, and Xiaomi = 0.79%
- As of 2023, the Asia Pacific region is expected to be the highest tablet market growth with 4.63% of CAGR.
- In 2022, the market share of kids' tablets reached $15.9 billion and in 2023 it is expected to be $17.99 billion.
- The kid's tablet market was dominated by the segment of 5 to 10 years in 2022 which resulted in 65.45% of market revenue in which the North American region topped with 45.80% of the market share followed by Europe and Asia-Pacific.
- Tablet users by 23% used tablets just to send emails, watch videos and movies.
- According to Statista, currently in 2023 tablet users turned to 1.28 billion across the world.
- In the United States average time spent by tablet users was 7.42 minutes in 2022.
- Of American people, 53% were having one tablet on average.
Simple Overview of Global Tablet Market
- Market Value: In 2020, tablets were worth $61.63 billion. In 2021, that jumped to nearly $70 billion. By 2025, it might hit $104.53 billion.
- Users: In 2021, 1.28 billion people used tablets, almost double the 660 million users from 2013.
- Shipments: In 2021, 158.3 million tablets were shipped worldwide, slightly fewer than the 160.9 million in 2020.
- Most Shipments: North America received the most tablets (22%). Western Europe got 21%, and China, the Middle East, and Africa each received 14%.
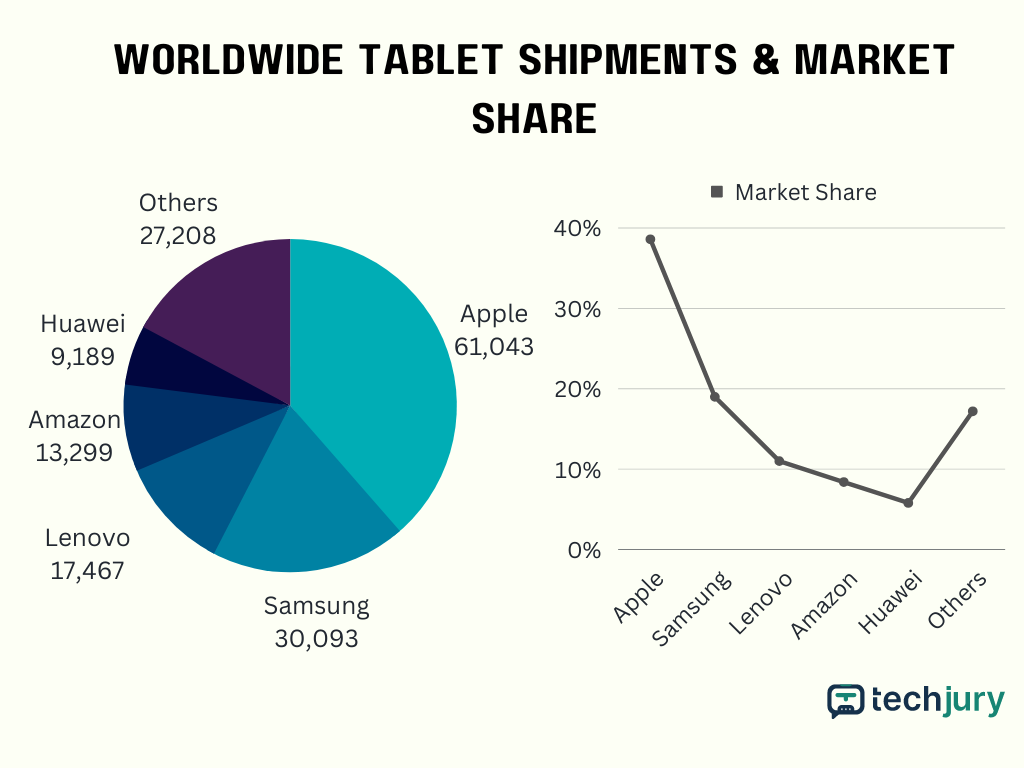
- Top Manufacturer: Apple led in 2021, selling over 61 million tablets. Samsung and Lenovo followed with 30.09 million and 17.46 million, respectively.
- Operating System: Even though Apple sells many tablets, most tablets (51.9%) run on Android.
- Spending in 2022: People might spend about $64.06 billion on tablets in 2022.
- US Ownership: The most US folks owning tablets was in 2017 at 56%, but it fell to 54% in 2018.
- Who Owns Tablets: Families earning more money are more likely to own a tablet. For example, 66% of families earning $150,000 or more have one.
- iPad Neck: Using tablets too much can cause “iPad neck”, a pain in the neck and shoulders. It affects more women (70%) than men.
- Shopping Habits: Only 2% of people shop daily on their tablets. 9% shop weekly.
- Usage: Most folks (23%) use tablets to watch movies or send emails (22%).
- Online Shopping: On average, people spent $87.18 billion shopping online using tablets in 2020, more than mobiles but less than desktops.
- Average Session: In September 2019, US users spent about 7.42 minutes per tablet session. This time fluctuated in previous years.
(Source: techjury.com)
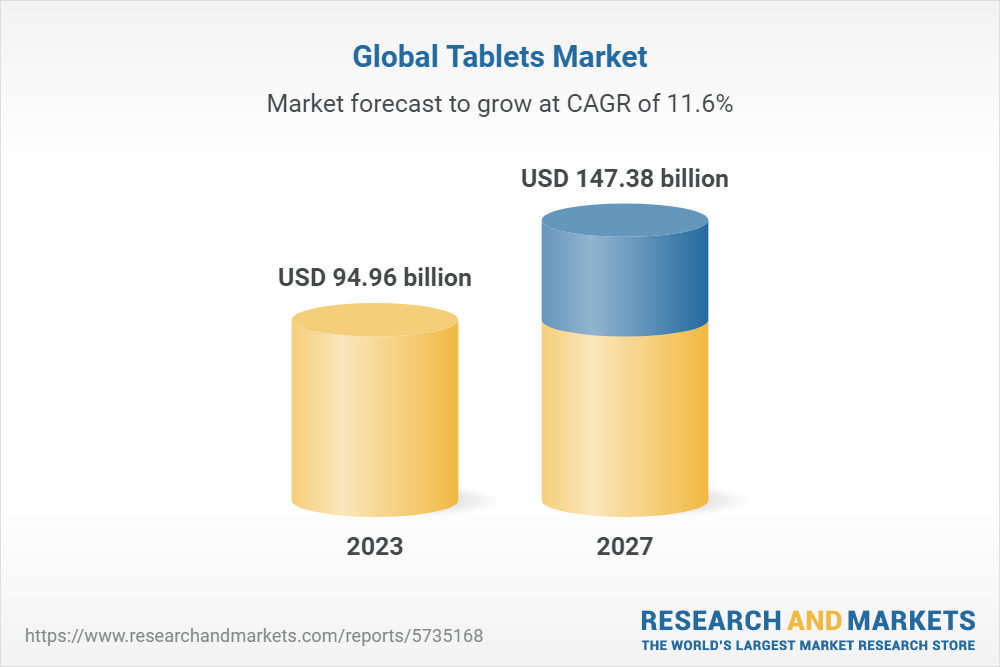
(Source: research and markets)
- As of 2023, the global tablets market is going to reach $94.96 billion
 (Reference: tadviser.com)
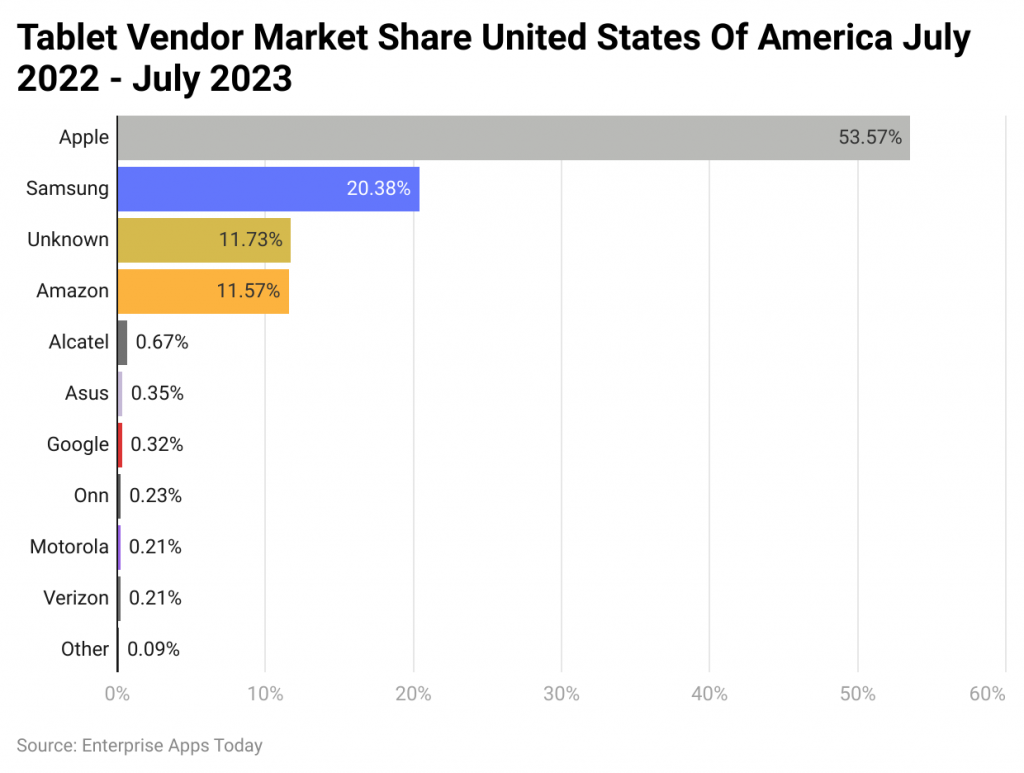
Here's a simplified breakdown of which companies dominated the tablet market in the U.S. during this period:
- Apple: They led the race with a market share of 54.25%. This means that more than half of the tablets used in the U.S. during this time were from Apple.
- Samsung: Coming in second, Samsung captured 20.08% of the market. This shows they are Apple's main competitor in the tablet space.
- Amazon: Securing the third spot, 11.96% of tablets were from Amazon. They've managed to carve out a significant chunk, possibly due to the affordability of their Fire tablets.
- Unknown: There's a notable 11.07% market share held by brands or devices not distinctly recognized. This suggests that there are quite a few tablets being used whose brand identity isn't clear.
- Alcatel: They have a smaller piece of the pie, with 0.69%. Alcatel caters to the budget segment, but it's dwarfed by the giants.
- Asus: Asus holds 0.39% of the market. While known for their computers, their tablets make up a small fraction of the U.S. market.
- Google: Even smaller is Google, with 0.27%. Despite being a tech giant, their tablets aren't as widespread in the U.S.
- Verizon: With 0.22%, Verizon shows its presence, albeit minimal.
- Onn: Onn has a market share of 0.17%. It's one of the smaller players in the tablet world.
- Motorola: Very close to Onn, Motorola captures 0.15% of the market. Once a major mobile player, their tablet contribution is tiny.
- Others: Finally, there are various other brands collectively holding 0.75% of the market. This includes all the other smaller brands that didn't make the main list.
In summary, Apple is the undeniable leader in the U.S. tablet scene, with Samsung as its primary challenger, while other brands play in the background.
Tablet Lifespan: Software Updates vs. Hardware Durability Statistics
 (Reference: techjury.net)
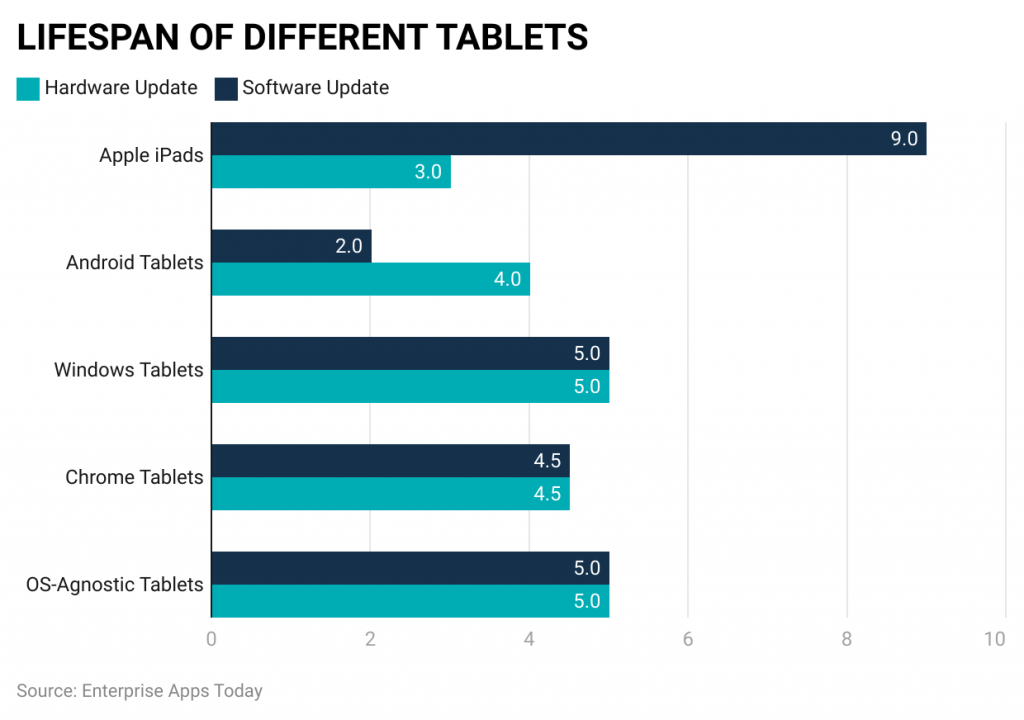
Apple iPads:
- Software Updates: iPads get updates for about 9 years. This means Apple provides new features and security patches for almost a decade after the tablet's release.
- Hardware Durability: Typically, the physical parts of an iPad, like its battery or screen, last around 3 years before they might need repair or replacement.
Android Tablets:
- Software Updates: Android tablets usually receive updates for 2 years. After this period, they might not have the latest features or security enhancements.
- Hardware Durability: The physical components of these tablets are built to last about 4 years.
Windows Tablets:
- Software Updates: Windows on tablets gets updated for around 5 years. This ensures users have half a decade of the latest software from Microsoft.
- Hardware Durability: The hardware of Windows tablets is also designed to last about 5 years, making it balanced in terms of software and physical longevity.
Chromebook Tablets:
- Software Updates: These tablets, powered by Google's Chrome OS, get software updates for about 4.5 years.
- Hardware Durability: The physical lifespan of a Chromebook tablet is also around 4.5 years, aligning software and hardware longevity.
OS-Agnostic Tablets:
- Software Updates: These tablets, which can run multiple operating systems, get software support for roughly 5 years.
- Hardware Durability: Their hardware is also designed to last for approximately 5 years.
In essence, while iPads offer longer software support, their hardware might wear out quicker than some other brands. On the other hand, Android tablets have shorter software support but slightly longer-lasting hardware. Windows, Chromebook, and OS-Agnostic tablets have a more balanced lifespan for both software updates and hardware durability.
Changes in Tablet Shipments by Region: Q1 2022 vs. Q1 2021
 (Source: canalys.com)
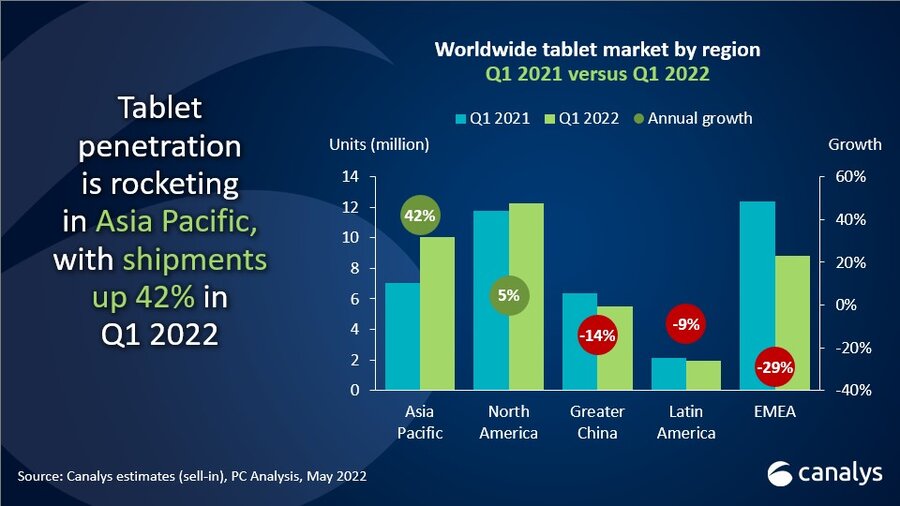
The data provides a comparison of how tablet shipments changed across different regions from the first quarter of last year to the same time this year:
Asia Pacific:
- There was a massive growth of 42% in 2022. This indicates a huge surge in demand for tablets in the Asia Pacific region compared to the previous year.
North America:
- Tablet shipments grew slightly, with an increase of 5%. So, while there was growth, it wasn't as significant as in the Asia Pacific.
Europe, Middle East, and Africa (EMEA):
- There was a decrease of 29% in tablet shipments. This means fewer tablets were shipped to these areas in Q1 2022 compared to Q1 2021.
Greater China:
- Tablet shipments fell by 14%. So, even in this major market, there was a decline in the demand for tablets from one year to the next.
Latin America:
- Shipments went down by 9%. Similar to EMEA and Greater China, this region also saw a reduced interest or need for tablets.
In summary, while the Asia Pacific region saw a big jump in tablet shipments in the first quarter of 2022, regions like EMEA, Greater China, and Latin America experienced a decline. North America had a modest growth. This data provides insights into where the tablet market is booming and where it's slowing down.
Let's dive into how different tablet brands performed in market share over five quarters:
Apple:
- Apple maintained its lead over these quarters. Starting from 31.5% in Q1 2022, it saw a steady rise, dramatically reaching 53.03% in Q1 2023. The brand strengthened its dominance in the tablet market year over year.
Samsung:
- Samsung had a bit of fluctuation. After starting at 21.1% in Q1 2022, it dipped in the middle of the year but made a significant jump to 29.84% by Q1 2023, reinforcing its position as a major player.
Huawei:
- Huawei saw a gradual decrease over the quarters, beginning with 5.8% and dropping to 2.53% by Q1 2023. It seems the brand faced challenges in retaining its tablet market share.
Amazon:
- Amazon's journey was quite varied. After peaking in Q2 2022 at 13.6%, it significantly reduced its share to 4.6% by Q1 2023.
Lenovo:
- Lenovo stayed relatively consistent throughout 2022 but isn't present in the Q1 2023 data, suggesting either a sharp decline or a shift in market categorization.
Xiaomi & Asus (Q1 2023):
- In the first quarter of 2023, Xiaomi and Asus made appearances with 0.86% and 0.64% respectively. These brands had a small slice of the market.
Other Brands:
- The “other” category, which encompasses various smaller brands, saw a reduction from 24.1% in Q1 2022 to 9.31% by Q1 2023, indicating consolidation in the market where top brands expanded their shares.
To sum up, Apple and Samsung amplified their dominance in the tablet market from 2022 to 2023. Brands like Huawei and Amazon faced challenges, while others like Xiaomi and Asus had minor roles. The overall tablet market appears to be converging more around the major players, with lesser-known brands losing ground.
Here's a simplified breakdown of how various tablet brands performed in the U.S. over the mentioned periods:
Apple:
- Apple has consistently been the top choice for tablets in the U.S. By the end of 2022, they held 52.77% of the market. This increased slightly to 53.04% in the first quarter of 2023. Apple's dominance in the U.S. tablet scene remains clear.
Samsung:
- Samsung held its position as the second most popular tablet brand. Their market share was 21.08% at the end of 2022 and rose a bit to 21.39% in Q1 2023. They maintain a solid presence, but there's a considerable gap between them and Apple.
Amazon:
- Amazon's tablets saw a slight dip in their market share. From holding 12.32% at the end of 2022, it reduced to 11.10% in Q1 2023. While they're still a significant player, there's a small decline in their share.
Alcatel:
- Alcatel had a tiny share of the market, with 0.76% at the end of 2022. This share decreased a little to 0.65% in Q1 2023. They're a minor player in the U.S. tablet market.
Asus:
- Asus also has a small footprint in the U.S. tablet world. Their share decreased from 0.39% at the end of 2022 to 0.34% in the first quarter of the following year.
Other Brands:
- The combined share of various other tablet brands increased from 12.67% at the end of 2022 to 13.49% in Q1 2023. This suggests a mixed bag of minor players holding their ground or even gaining a bit.
In a nutshell, Apple remains the king of tablets in the U.S., with Samsung comfortably in the second spot. Brands like Amazon hold a notable portion, while Alcatel and Asus have minimal shares. The combined “other” brands category has seen a small increase in its market share.
Tablet Market Statistics by An Operating System
- The operating system of Tablet is categorized into 3 segments iOS, Android, and Windows.
- In 2022, iOS has covered 44.91% market share and is expected to grow by 3.21% cagr by 2023 which is known to be the largest market share.
- Android ranks 2nd position with 18.2% market share resulting in 0.0082 billion tablet shipping.
Year-Over-Year Growth of Tablet Brands in 2022
Here's a straightforward breakdown of how various tablet brands grew (or shrank) from the previous year in 2022:
Apple:
- Apple experienced positive growth in 2022. Their market share increased by 7%, showing that the brand continued to strengthen its position in the tablet market.
Samsung:
- Samsung saw a slight decline. Their market share dipped by 0.8%, indicating a small reduction in their dominance compared to the previous year.
Amazon:
- Amazon also 47 experienced a decline, albeit minimal. Their market share dropped by 0.7%, suggesting they faced a bit of a challenge in maintaining their position from the previous year.
Lenovo:
- Lenovo faced the most significant decrease among the listed brands. Their market share plummeted by a whopping 34.6%. It seems Lenovo struggled considerably in the tablet market in 2022.
Huawei:
- Huawei's market share decreased by 7%. This drop suggests that Huawei faced challenges in retaining its position in the tablet market during 2022.
Other Brands:
- The combined market share of various other tablet brands decreased by 6.6%. This indicates that, in general, smaller or lesser-known tablet brands faced challenges in 2022.
While Apple enjoyed growth in 2022, brands like Samsung, Amazon, and especially Lenovo, faced a decline. Huawei and the collective “other” brands also saw their market shares shrink during the year.
Tablet Statistics by Demographic
Here's a simpler look at who's using tablets and how:
Gender Breakdown:
- The tablet user base is almost evenly split between the genders. Women slightly edge out men, with 50.8% of tablet users being female and 49.2% being male.
Age Groups:
- Gen Z (youngest generation): Only 30% have a tablet. They mostly prefer mobiles, spending about 3 hours and 38 minutes on them each day. (Source: GlobalWebIndex)
- Millennials (those after Gen Z): Tablet ownership among Millennials has been growing. In 2013, only 34% had a tablet. By 2019, that number rose to 55%. (Source: Pew Research Center)
- Gen X (middle-aged folks): In 2013, 45% of Gen X owned a tablet. That number went up to 64% by 2018 but then dropped to 53% in 2019. So, while they once loved tablets, the trend is reversing. (Source: Pew Research Center)
- Boomers (older folks): Tablet ownership grew from 31% in 2013 to 52% in 2018 and remained the same in 2019. So, it seems Boomers have settled in their tablet use. (Source: Pew Research Center)
- Silent Generation (oldest folks): Not many own tablets, but there's growth. From 17% in 2013, it rose to 33% by 2019. (Source: Pew Research Center)
While tablets are used by people of all genders and ages, they're especially popular among individuals aged 25 to 44. Women are just slightly more likely to use tablets than men, and older individuals above 65 years are less likely to use them compared to younger age groups.
Chromebook Tablet Market Statistics by Region
 (Source: canalys.com)
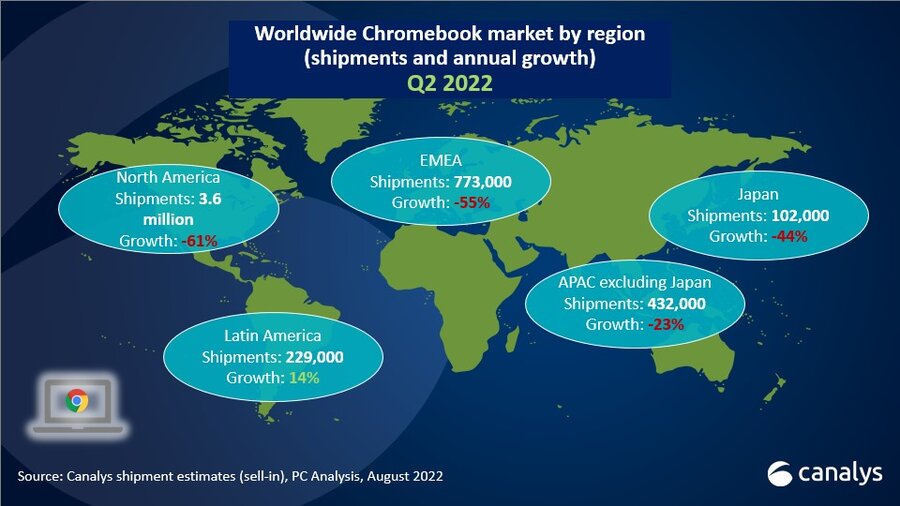
- As of the 2nd quarter of 2022, North American shipments turned out the highest resulting in 3.6 million, and growth was reduced by 61%.
- Whereas Latin American shipments turned out to 229,000 and market growth increased by 14%.
Comparison: Global Tablet Market in Q4 2022 vs. Full Year 2022
(Source: static.techgoing.com)
 (Source: statcounter.com)
- Across the world the tablet share ranked lowers at 2.05%
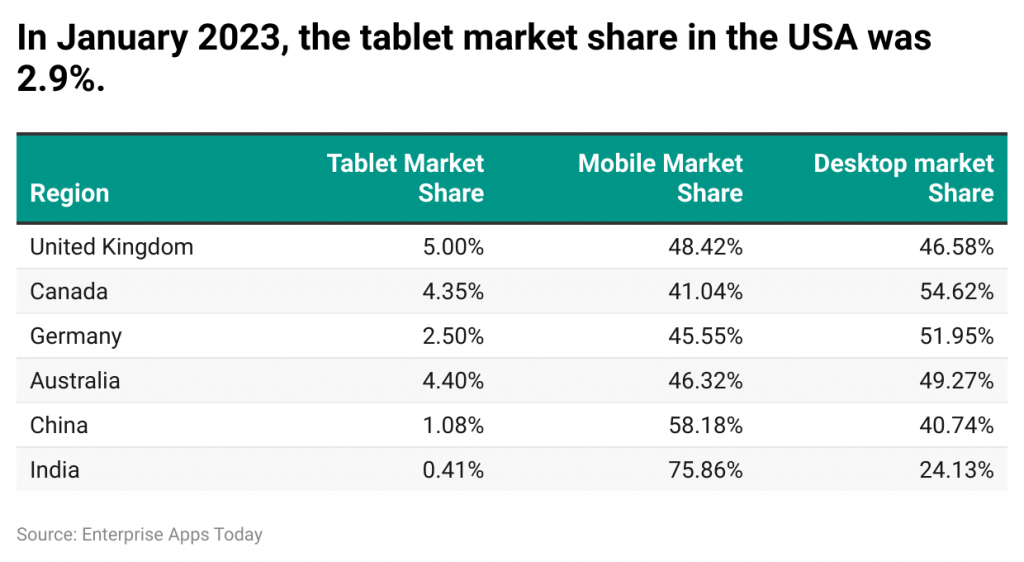
- In the United States, the market share of tablets was 2.9%.
 (Source: vpnalert.com)
Global Tablet Shipment Statistics
- North America =22%
- Western Europe = 21%
- China = 14%
- Middle East and Africa = 14%
- Asia Pacific and Latin America = 8% each
- Emerging Asia Pacific = 7%
- Eastern Europe = 4%
- Eurasia = 2%
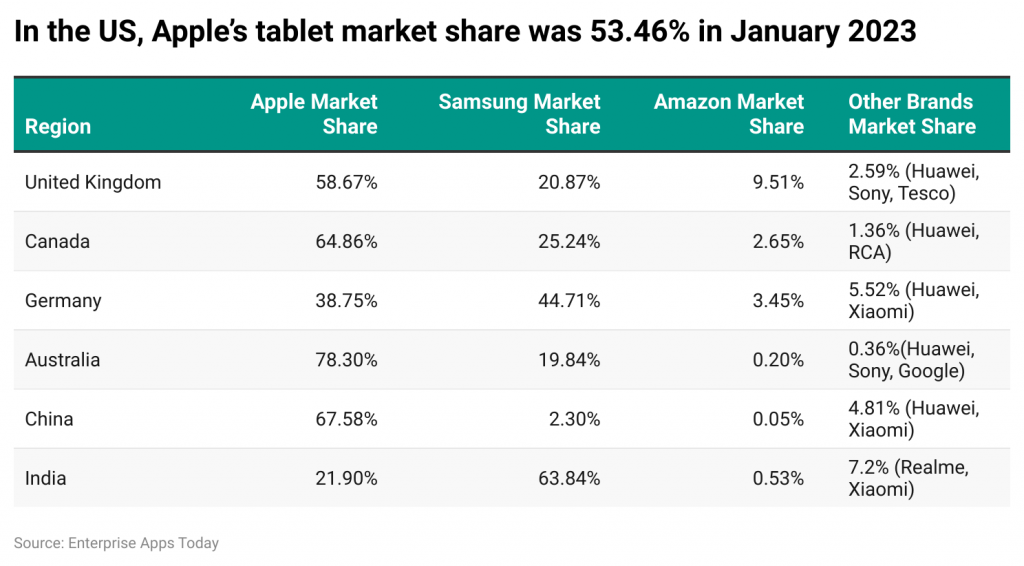
- United States: Apple = 53.46%, Samsung = 20.7%, and Amazon = 11.69%
 (Source: vpnalert.com)
(Source: vpnalert.com)
- In the 3rd quarter of 2022, the overall tablet market fell by 16% because of post-pandemic effects which Apple reduced by 5% and Samsung by 4%.
- In 2022, Apple was having the largest market share in the month of October to December with 50.68 – 51.21%.
- The tablet shipping of Apple was double that of Samsung in the year 2022 in the number of Apple shipped tablets worldwide = 61.8 million and Samsung = 30.3 million.
- As of January 2023, Apple's share of the Chinese tablet market has declined by 8.5%.
- In the 1st quarter of 2022, the best tablet sellers were iPad 2021, iPad Mini 2021, iPad Pro 2021, iPad Air 2020, and Galaxy Tab 8.
- 2nd quarter 2022, 1.5 million Chromebook tablets were shipped by Dell Technologies.
Conclusion
As of today after completing the article on Tablet statistics it is clear that tablets have already ruled over the world and the major player are Apple and Samsung. As the world is evolving digitally and in which tablets are playing an effective role as it provides greater flexibility and direct communication process for users. After COVID-19 people mostly got involved in online work and study which increased the demand for tablets in 2022 and became more popular. This article includes some important graphs, charts, and data that will provide how this sector is growing across the world.
FAQ.
They are lighter in weight if compared with laptops and thus they are easy to carry anywhere. This works as a computer but is easy to manage something like a book or Smartphone. They are having internal storage starting from 64 GB OR 128 GB along with an option of adding an extra micro SD card. It also includes digital textbook for students including touch screens and digital pen options.
Tablets includeinclude lots of facilities thus they are becoming user-friendly that allows accessing the internet, reading e-books, watching videos, sending e-mails, listening to music, setting appointments, enabling in the installation of apps for getting maps and directions apps, game apps and shopping apps, and other tasks.
It includes smaller processors as compared to computers and the microprocessor is termed as the brain of the tablet, battery, accelerometers, gyroscopes, graphics processors, WiFi, cellular chips and antennas, flash-based memory, speakers, camera sensors, chips, lenses, USB dock, power supply, and a touch-screen controller chip.

Barry is a lover of everything technology. Figuring out how the software works and creating content to shed more light on the value it offers users is his favorite pastime. When not evaluating apps or programs, he's busy trying out new healthy recipes, doing yoga, meditating, or taking nature walks with his little one.