
Mobile Commerce Statistics By Demography, Payment Methods, Mobile Search, Country and Mobile Voice Searches
Page Contents
- Introduction
- Editor’s Choice
- Facts About Mobile Commerce Statistics
- Advantages and Disadvantages Of Mobile Commerce
- General Mobile Commerce Statistics
- Frequency of Mobile Retail App Usage
- How Social Media Impacts Mobile Shopping
- Who's Shopping on Mobile, Demographically Speaking?
- Optimization Statistics Of Mobile Commerce
- Mobile Shopping Hiccups & How They Affect Shoppers
- What Bugs Mobile Shoppers?
- How People Pay with Their Phones & How They Search
- By Mobile Voice Searches
- By Mobile Shopping Habits
- Which Shopping Apps Did Americans Spend the Most Time
- How Often Different Age Groups & Genders Shop on Mobile Weekly
- Types Of Mobile Commerce
- How Mobile vs. Desktop Online Shopping
- Mobile Shopping Sales Breakdown by Sector
- What Pushes Smartphone Shoppers to Click ‘Buy'?
- A Peek at Mobile Shoppers in the U.S. Over the Years
- Conclusion
Introduction
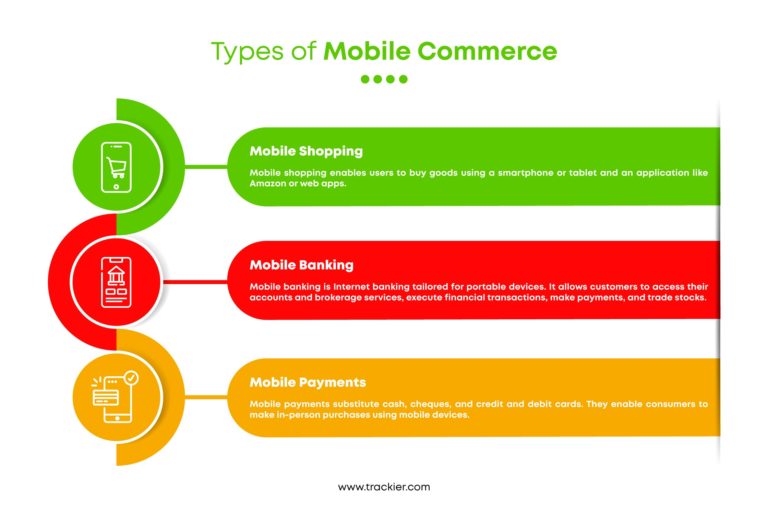
Mobile Commerce Statistics: In m-commerce, ‘m’ stands for mobile, and as of reports mobile commerce is growing rapidly with each passing year. This is also known as the subset of e-commerce which allows all commercial transactions through mobile apps and sites. The mobile commerce section is divided into 3 sections mobile banking, mobile shopping, and mobile payments. In 2022 the global mobile commerce market turned out to be $1109.1 billion. These mobile commerce statistics include many important aspects that will provide light on how fast the mobile commerce market is enhancing over the world.
Editor’s Choice
- In the United States, mobile commerce sales resulted to $432.40 billion by the end of 2022 with a growth of 41% from last year.
- As of 2023, mobile retail sales are supposed to cross $510 billion and by the end of 2025 $710 billion.
- Recently 89% of people are using online grocery shopping rather than visiting shops.
- In the U.S. in 2022, people were using mobile phones for mobile commerce for 4.5 hours per day.
- In the platform of mobile commerce Amazon shopping itself was having 20.8 million active users per day in 2022.
- As the most popular mobile commerce platform was Amazon Shopping, and the app was downloaded by 30-35 million approx via Android and iOS.
- People use mobile commerce apps for online shopping in which mobile commerce payments have been done by 54%.
- In 2022, mobile commerce sales have increased by 85% as customers have preferred buying more from mobile over laptops.
- As of 2023, mobile is used by 79% of users for making online purchasing.
- 90% of U.S. people who preferred mobile shopping were aged between 25 – 34 years.
Facts About Mobile Commerce Statistics
- The U.S. alone has generated 11-12% of mobile commerce revenue out of the world’s total mobile commerce revenue.
- Around 49% use of Smartphone was used by mobile shoppers before buying products for analyzing price comparison of products and services.
- 46% of mobile commerce platform shoppers only researched products review and ratings by using Smartphones.
- It is expected that in the United States, there will be 187 million active mobile shoppers by the end of 2024.
- In the mobile commerce platform, 67% of mobile users have said that clicking on pages and links seems too small which is termed as a barrier to the mobile commerce platform.
- Mobile web apps were mostly preferred by 51% of users over other shopping channels.
- As of 2023, there will be 61.9% of Paid search click share accounted for on mobile.
- The mobile payment transaction in the U.S. is expected to reach over $200 billion by 2023.
- In the last two quarters of 2022, there was around 80% of users have connected their mobile devices to different mobile commerce platforms.
- Potential mobile commerce customers in the U.S. in 2022 were 77% adult Smartphone users and 53% tablet users.
- The market share of mobile commerce comprised 73% of the overall e-commerce market in the world by the end of 2022.
Advantages and Disadvantages Of Mobile Commerce
- Advantages: The capabilities of mobile commerce are available easily and broadly and also offer a large base of clients; more convenient as it allows customers to purchase from wherever and whenever compare prices, and read reviews; promotes contactless methods of payments just in one touch.
- Disadvantages: weaknesses in security systems, payment problems, shipping costs, paying extra taxes and some have experienced poor performance.
General Mobile Commerce Statistics
- As the most popular mobile commerce platform was Amazon Shopping, and the app was downloaded by 30-35 million approx via Android and iOS. Whereas, 2nd popular app in this platform was SHEIN’s app with 27 million downloads and 3rd was Walmart with 20 million downloads in 2022.
- These above apps were mostly likely to use mobile commerce by 18 to 34 years age groups people in the United States.
- In 2022, out of 10 only 2 American people between 50 to 64 years of age were using mobile commerce platforms once a week, and 11% of those above 65 years used mobile commerce shopping once a week.
- In the 2nd quarter of 2022, around 58.99% of web traffic was made by mobile devices.
- The mobile commerce market share in the U.S. is going to reach 34.9% of CAGR by 2026.
- In the United States in 2022, an average of $100 per purchase was spent by each consumer with which purchases from tablets = $101.96 and purchases from phones = $94.85
- As of 2023, the global market of mobile wallets is expected to cross $3.5 trillion.
- By 2024, mobile commerce sales in the UK are going to reach $134.37 billion.
- In Malaysia, the mobile commerce growth is expected to cross the growth of e-commerce by the end of 2023 by 19.7% of CAGR resulting in $4.9 billion. Smartphones are used for shopping by 52% of customers.
- In Latin America, the mobile commerce market size in 2022 was $29.6 billion.
- Five European countries are focused on mobile commerce. As of 2023, the Netherlands is expected to make mobile commerce sales by $15.31 billion, Denmark = $18.34 billion, Italy = $29.04 billion, and Norway = $13.2 billion.
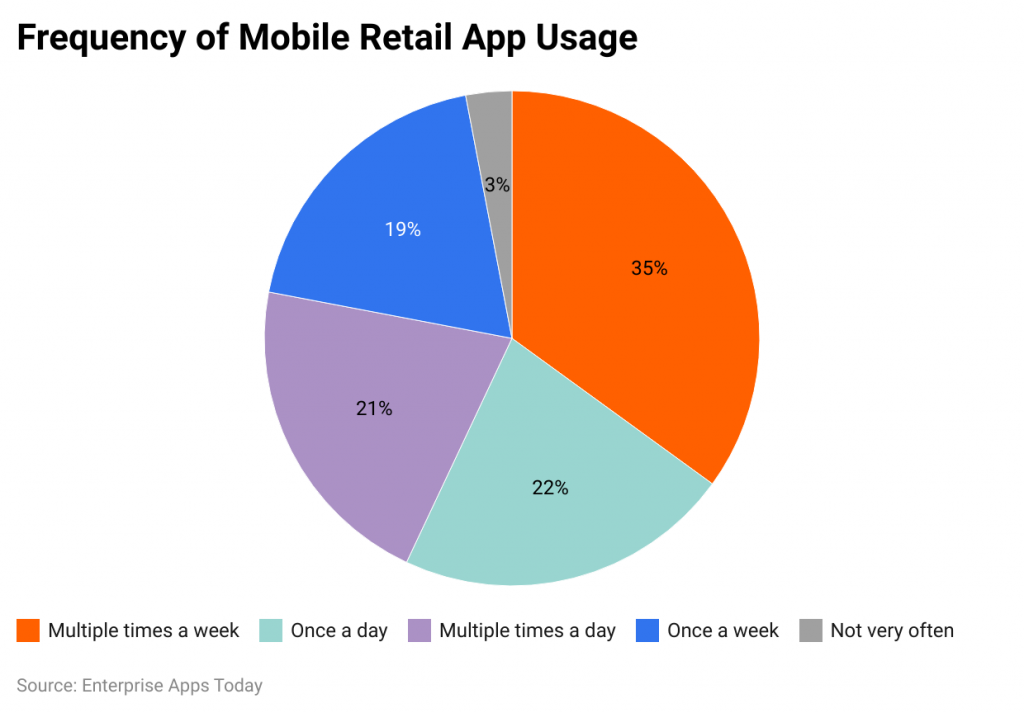
Frequency of Mobile Retail App Usage
 (Source: zippia.com)
- Very Often: 21% of folks check their apps several times a day.
- Daily Users: Another 22% pop in once every day.
- Regular Peeks: 35% use their apps a few times a week.
- Casual Shoppers: 19% might only check once a week.
- Rare Users: And, 3% don't really use their apps much at all.
It seems most people are quite active on their retail apps, with a good number checking in at least once a day or several times a week. Only a small fraction rarely uses them.
How Social Media Impacts Mobile Shopping
- Browsing to Buying: 55% of mobile users buy things after spotting them on social media. It's like window shopping, but online!
- Brand Followers = Shoppers: Almost all (90%) of those who follow brands on social media end up buying from them. So, if you're a fan, you're likely a customer too.
- Retailer's Social Presence Boosts Sales: Retailers with social media accounts? They're seeing a nice sales boost – about 32% more sales on mobile platforms!
- Curiosity Research: A cool 60% of people dig around on social media to learn about new products and services. That's a lot of online sleuthing.
- Friend's Advice Matters: Nearly half (49%) of folks will buy based on social media recommendations. “Like” it or not, our friends' tastes influence us.
In short, social media plays a huge role in how and what we buy on our mobiles. Brands and recommendations can really sway our shopping decisions!
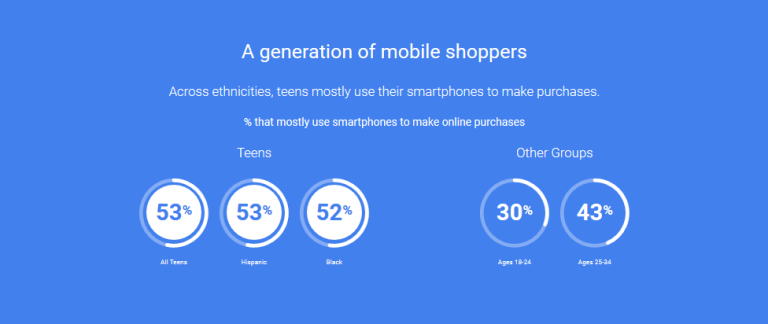
Who's Shopping on Mobile, Demographically Speaking?
(Source: simicart.com)
- Tech-Savvy Teens: By the close of 2022, over half (53%) of teenagers globally were buying stuff online with their smartphones. That's some digital pocket money!
- Young Adults, 18-24: Nearly a third (30%) of this age group are shopping away on their mobiles.
- The 25-34 Crowd: Stepping it up, 43% of those aged 25 to 34 are making mobile purchases. Guess who's been upgrading their wardrobe?
- Hispanic Shoppers: Matching the teenagers, 53% of Hispanic individuals are going mobile for their shopping sprees.
- Black Shoppers: Just a smidge behind, 52% of Black individuals are tapping to buy on their phones.
Across ages and ethnicities, it's clear that mobile shopping is becoming everyone's game. Different groups, all digitally connected through shopping!
Optimization Statistics Of Mobile Commerce
- As of 2023, mobile devices are expected to account for around 65% of the overall traffic of e-commerce.
- Mobile shoppers accounted for search engine visits = 61% organic search which majority of 43% of total e-commerce traffic.
- In the e-commerce process, at least one negative experience has been faced by 88% of mobile shoppers in 2022.
- Because of negative experiences, 33% of mobile shoppers have switched from a particular shopping app immediately.
- In the United States, 60.9% of the population is mobile buyers.
Mobile Shopping Hiccups & How They Affect Shoppers
Ever been frustrated while shopping on your phone? You're not alone! Let's dive into the top pesky problems people face:
- Lost in the App: Over half (51%) find navigating some shopping apps tricky. Like, “Where's that checkout button again?”
- Can't See Clearly: 46% squint and struggle with too-small images. “Is that a blue dress or a blurry splotch?”
- Wallet Worries: 41% get cold feet because they're not sure if making a payment is safe. Nobody wants sneaky surprises on their card statement.
- Checkout Chaos: For 26%, the final step of purchasing can be a real pain. “Why do they need my second cousin's dog's name?!”
The real kicker? After running into such snags:
- 36% just give up and ditch everything in their cart. Adios, impulse buys.
- 35% have such a bad taste left that they swear off the app forever.
- Meanwhile, 29% need a long break – they might give the app a second shot, but only after half a year.
In short, the smoother the mobile shopping experience, the better. Otherwise, apps risk losing a lot of frustrated shoppers!
What Bugs Mobile Shoppers?
 (Source: statista.com)
- Lost in the App: Over half (51%) have had troubles navigating around. It's like being in a digital maze!
- Tiny Pics: 46% of shoppers squint at those too-small product images. They're thinking, “What am I even looking at?”
- Is My Money Safe?: 41% scratch their heads, worrying about payment security. No one wants sneaky surprises on their bank statements.
- Checking Out or Stressing Out?: A quarter (26%) have issues at the checkout point. “Why can't this be easier?” they wonder.
- Bye-Bye, Basket: After such hiccups, 36% just ditch their cart and bail. Those items? Left lonely.
- App Aftermath: And the aftermath of a bad experience? A significant 35% say “No more!” and ditch the app for good, while 29% give it a cold shoulder for half a year.
If mobile shopping was a party, these issues would definitely be the party poopers. Shoppers want smooth sailing, not hurdles!
How People Pay with Their Phones & How They Search
Payment Preferences
- Phone Payment Popularity: By 2023, a whopping 80 million Americans are going to be using their phones to pay. That's a lot of phone-tapping at checkout!
- Debit Card Domination (2022): Globally, about 30-31% of folks swiped their debit cards the most. That's like 3 out of every 10 people.
- e-Wallets on the Rise: Next up, 28% of people prefer digital wallets like Apple Pay or Samsung Pay. It's like having a virtual cash register.
- Credit Card Crew: 22% lean on credit cards. “Charge it” is their mantra.
- Cash on Arrival: 17% like the old-school method and go for cash-on-delivery. Some things never go out of style.
Mobile Search Habits
- General Engine Exploration: Almost half (48%) of mobile buyers hit up a search engine when they want to find something.
- Google's Gang: Google's the popular kid with 58% of users making it their go-to.
- Paying for Google's Attention: And, impressively, 65% of folks click on Google's paid search results.
- Brand Bonding: 42% actively seek out interactions with specific brands.
- Locally Loyal: A massive 88% look up local business brands. Supporting the neighborhood heroes!
- Social Media Sleuths: 60% dive into social media to dig up details.
Whether it's how we pay or how we search, we're all finding our own digital paths, but it's clear that mobile tech is guiding the way!
By Mobile Voice Searches
- The Asia Pacific and developed countries of English speaking have mostly used Amazon’s Alexa smart speakers and virtual assistants = 27%
- As per research, out of 4 mobile voice searches 3 have ordered products from their phone.
- The top three triggers for voice search users that influence them to buy online are coupons and discounts, free delivery, and an easy returns policy.
By Mobile Shopping Habits
- Downloaded retailer apps on SmartphonesSmartphones = 70% of consumers for getting advantage of coupons and discounts.
- In the United States shoppers compare prices while in-store = 77% of mobile commerce customers.
- Use digital window shopping on mobile = 67% of customers.
- Impulse online shopper = 77% customers
- As of 2022, American people have spent 344 minutes/day on Smartphones for shopping.
- According to mobile commerce statistics, people when shopping inside a store = 83% of people have browsed shopping apps.
- Browsing online shopping apps was rated as the top activity on Smartphones = agreed by 43% of Smartphone users.
- By 2024 in the United States, the number of mobile shoppers is expected to be 187 million.
- In 2022, the top shopping and grocery app used by American people was Amazon.
Which Shopping Apps Did Americans Spend the Most Time
Here's a chatty rundown of how long folks hung out on their favorite shopping apps:
- Amazon: Clocking in at the top, people browsed around for about 35 minutes. That's almost the length of a TV episode!
- SHEIN: Not too far behind, folks played virtual dress-up on SHEIN for over 27 minutes. Call it a fashion quarter-hour.
- Walmart: People filled their digital carts for nearly 20 minutes here. Quick and convenient!
- Fetch & Temu: These two are neck and neck. With Fetch at almost 15 minutes and Temu just a smidge behind, it seems users had a good quarter-hour of fun.
- Nike: About 12.5 minutes here, probably checking out the latest kicks and athletic gear.
- Etsy & Upside: These crafty and savvy savers' apps had users engaged for almost 12 minutes each. Crafting and saving, always a good mix!
- eBay, Target, & OfferUp: Each of these had people browsing for just under 10 minutes. Quick peeks for deals and steals!
From crafting to fashion to deals, Americans sure had their share of digital window shopping in 2022!
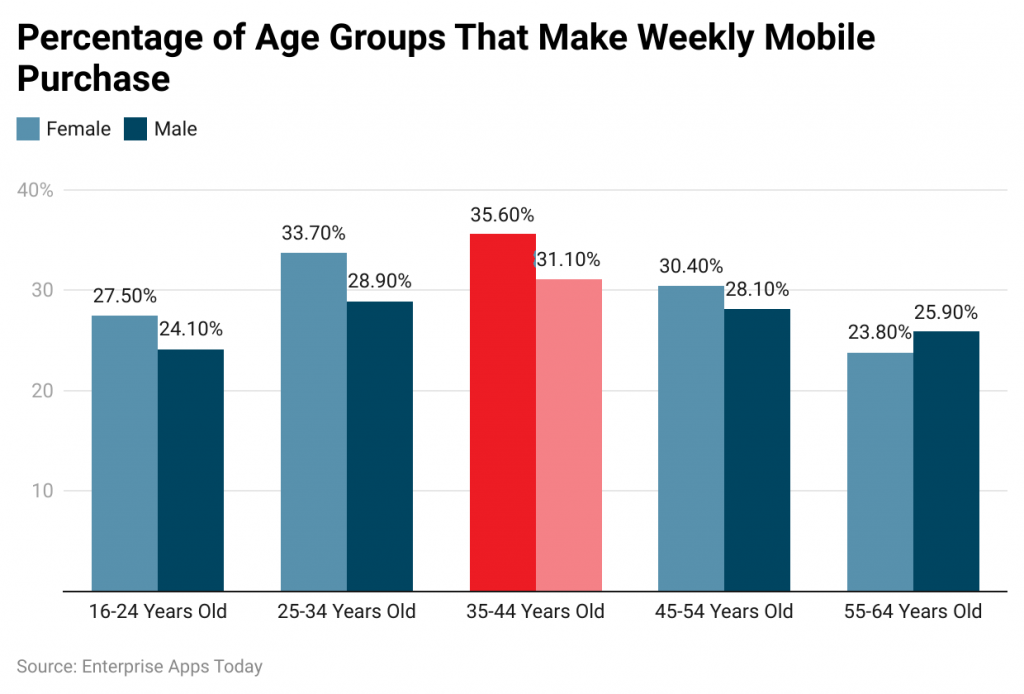
How Often Different Age Groups & Genders Shop on Mobile Weekly
 (Source: supplygem.com)
Let's dive into who's clicking “buy” on their phones every week:
- Teenagers & Young Adults (16-24 years):
- Girls: Just over a quarter (27.50%) are shopping on their phones. Maybe hunting for the latest trends?
- Boys: Not too far behind, with 24.10% of them making mobile purchases. A little less, but they're still on the shopping train.
- Mid-Twenties to Mid-Thirties (25-34 years):
- Women: Stepping it up, 33.70% are finding what they need on mobile.
- Men: A bit lesser, 28.90% of them are swiping to shop.
- Mid-Thirties to Mid-Forties (35-44 years):
- Ladies: Leading the pack, 35.60% of them are shopping weekly. Busy mamas or just savvy shoppers?
- Gents: 31.10% are joining in. Maybe buying some DIY tools or tech gadgets?
- Mid-Forties to Mid-Fifties (45-54 years):
- Women: 30.40% still enjoy their weekly mobile shopping sessions.
- Men: Close behind at 28.10%, probably scouting for some deals or hobbies.
- Mid-Fifties to Mid-Sixties (55-64 years):
- Women: Slowing down a bit, 23.90% of them are tapping to buy.
- Men: Slightly ahead this time, with 25.90%. Maybe they're planning some retirement adventures?
No matter the age, it seems like everyone's getting in on the mobile shopping action. Each age and gender combo has its own shopping rhythm!
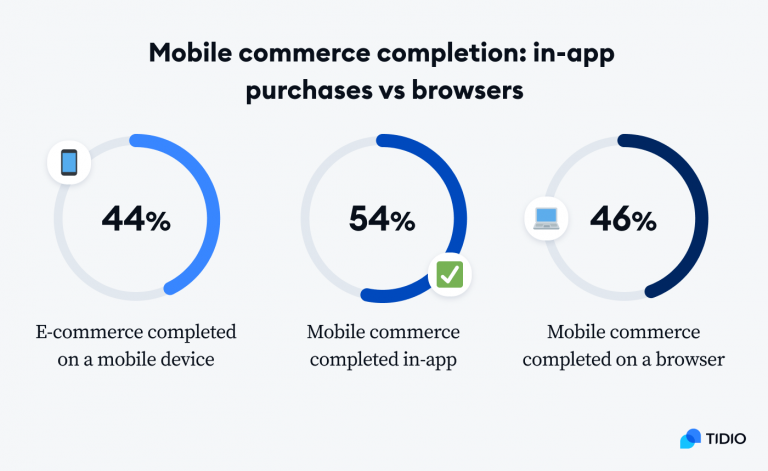 (Source: tidio.com)
Types Of Mobile Commerce
How Mobile vs. Desktop Online Shopping
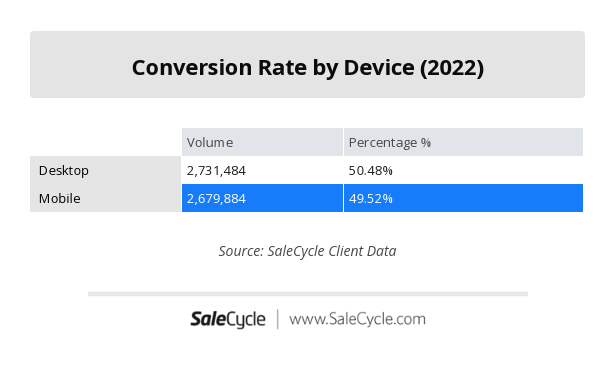 (Source: salecycle.com)
- Mobile shoppers numbered a whopping 2,679,884. Sounds big, right? But guess what…
- They made up 49.52% of all online buyers, meaning they were just a tad fewer than their desktop-using buddies when it came to making purchases.
In simpler terms, for every 100 online shoppers, about 50 of them were tapping away on their phones, while the other half were clicking on their computers. It's almost a tie, but desktops had a slight edge!
Mobile Shopping Sales Breakdown by Sector
Let's chat about where mobile users were spending their cash in 2022:
- Fashion: Mobile shoppers were absolutely loving fashion. They snapped up a staggering 24 million items! And here's the juicy part: 71% of all fashion items sold online were bought on mobile devices. So, basically, 7 out of 10 fashion purchases were made by folks tapping on their phones. Fashionistas are going mobile!
- Retail: This broad category also saw a lot of mobile love. People bought 22 million items from various retail stores on their mobiles. That's a whole lot of diverse shopping going on!
- Travel: While 6 million might sound smaller compared to fashion and retail, that's still a hefty number of bookings and buys in the travel sector. Looks like quite a few wanderlusters were planning getaways on the go.
In a nutshell, fashion was the top dog for mobile shopping in 2022, with retail not too far behind. And plenty of folks were also using their phones to fuel their travel dreams! 📱🛍🌍
What Pushes Smartphone Shoppers to Click ‘Buy'?
 (Source: wpforms.com)
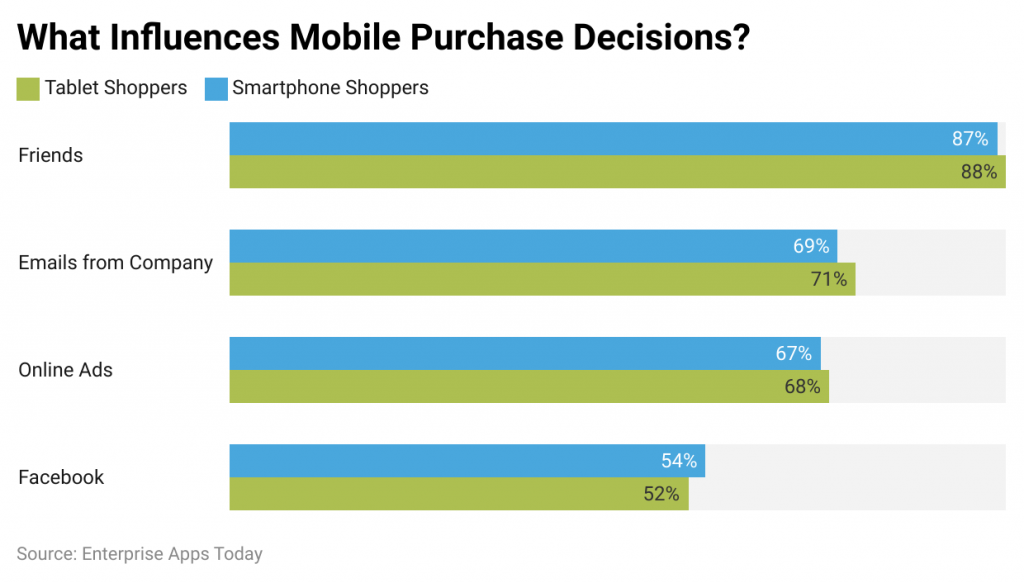
Wondering what makes smartphone shoppers finally decide to make that purchase? Let's break it down:
- Friendly Nudges: A massive 87% admit that their friends have a big say. It's like, “If my BFF says it's cool, it's going in my cart!”
- Inbox Invites: Nearly 70% (69% to be exact) get convinced after receiving promotional emails. Those tempting email deals? Totally working.
- Ad Magic: Online ads have a way with 67% of shoppers. They see, they like, they buy!
- Facebook Feedback: Over half (54%) get influenced by Facebook reviews. A bunch of stars and good comments? That's a green light for them.
So, from buddies' advice to online reviews, there are a bunch of ways our smartphone shopper friends are getting persuaded to part with their pennies.
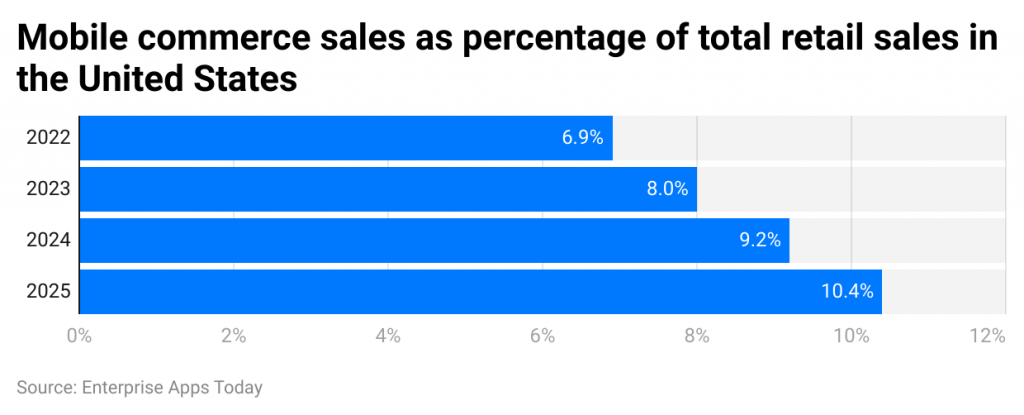
A Peek at Mobile Shoppers in the U.S. Over the Years
 (Source: tidio.com)
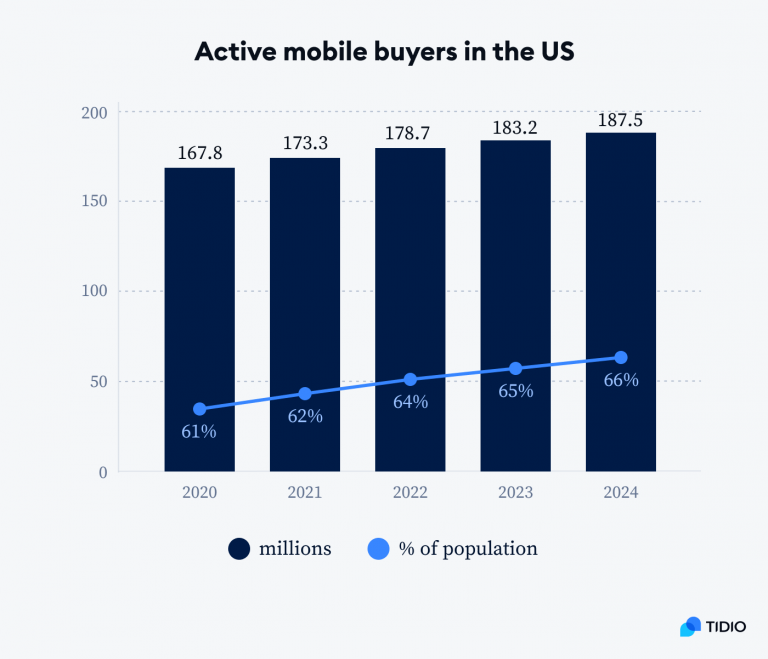
Let's chat about how many Americans are hopping on the mobile shopping bandwagon:
- 2022: 64% of Americans were all about mobile shopping. That's a massive 178.7 million folks, nearly two-thirds of the population! Imagine filling up two-thirds of a giant stadium with people shopping on their phones.
- 2023: The trend's growing! 65% or about 183.2 million people were mobile shopping aficionados. That's like adding a few more cities to that shopping stadium!
- 2024 (forecast): And it's set to grow even more! They're predicting 66% – that's 187.5 million Americans – will be tapping, scrolling, and buying on mobile.
In simple terms, year after year, more and more Americans are loving shopping on their phones. By 2024, nearly two out of every three Americans might be mobile shopping champs!
Conclusion
As of today, after completing the article on Mobile Commerce Statistics it can be easily said that currently, the market is experiencing steady growth in the United States as well as over the world. The mobile commerce platform includes a wide variety of ways that allow connecting consumers with several businesses. Across the globe, businesses that have implemented mobile commerce within their business have experienced huge gains along with enhancing the economy to date. The article includes many effective statistics mentioned above that will help in understanding the importance of mobile commerce.
Sources
FAQ.
As mobile transaction needs proper security at every stage so that people can enjoy all transactions without any doubt. Thus, the platform includes important safety features such as facial recognition and fingerprint act as safeguards in mobile and allow making a secure payment process.
The top companies are the part of mobile commerce includes Amazon, Apple, Google, eBay, Ericsson, ASOS, Gemalto, IBM, mopay, Mastercard, Netflix, SAP ERP, Visa, and PayPal Holdings.
The different types of m-commerce transaction types are M-billing, M-retailing, M-ticking, M-shopping, and digital wallets.

Barry is a lover of everything technology. Figuring out how the software works and creating content to shed more light on the value it offers users is his favorite pastime. When not evaluating apps or programs, he's busy trying out new healthy recipes, doing yoga, meditating, or taking nature walks with his little one.