
Online Vs In-Store Shopping Statistics 2024 By Product Category, Market Share, Revenue, Biggest Spending Locations And Holiday Shopping Preference
Page Contents
- Introduction
- Editor’s Choice
- General Online Shopping Statistics
- General In-store Shopping Statistics
- General Online Vs In-Store Shopping Statistics
- By Product Category
- by Holiday Shopping Preference
- By Projected Holiday Budget Spent
- By Country
- By Biggest Spending Locations
- By Holiday Shopping Research Plans By Channel
- By Fulfillment Method
- By Holiday Season
- By The Behavior Of Shoppers
- By Retail Sales
- By Footfall or Traffic For Selected Retailers
- By Generation
- By Return Process
- By Preferred Method
- Share of Consumers who Compare Prices
- Conclusion
Introduction
Online Vs In-Store Shopping Statistics: Retail stores provide all kinds of products from A to Z for everything a household may need. For ease of shopping, everything is available under one roof. Here we can take the example of Walmart. Similarly, with a rise in digitalization and globalization, the craze of online shopping has grown in the last decade.
Amazon is one of the largest e-commerce retailers in the world today. Just like we shop in-store, we shop online, only the difference is we don’t have to go anywhere rather product is delivered to our doorstep. Following Online vs. in- store Shopping Statistics show the overall percentage of preferred methods of shopping by consumers around the world.
Editor’s Choice
- According to 80% of shoppers, they are more likely to make a purchase online because in-stores do not provide a convenient return policy.
- In 2023, in the USA, it was projected that 16.4% of retail purchases would be captured by online shopping, with a valuation of $1.1 trillion in sales for the eCommerce market.
- 75% of consumers around the world shop online at least once every month.
- 81.8% of consumers in the USA buy groceries online instead of going to the store.
- As of 2023, in the USA, consumer spending on online shopping was more as compared to in-store shopping resulting in 63% to 37% respectively.
- In 2023, a huge number of shoppers in the USA were likely to shop online only for example Amazon, similarly 34% of Americans needed clarification about where they wanted to shop.
- 40% of shoppers complete their shopping in-store at least once every week, on the other hand, it is 27% of online shoppers.
- 60% of consumers in the USA chose in-store shopping because after making a payment they can immediately have the product in their hands.
- The highest frequency of shopping online is once per month with 31% of shoppers in the USA.
- In 2023, compared to other countries, shoppers in the United States preferred online shopping resulting in 43%, while in other countries huge preference was given to in-store shopping.
You May Also Like To Read
- Pet Ownership Statistics
- Wine Industry Statistics
- Bicycle Industry Statistics
- Christmas Spending Statistics
- Coffee Industry Statistics
- Fashion Industry Statistics
- Coca-Cola Statistics
- Black Friday Statistics
- Thanksgiving Statistics
- Cyber Monday Statistics
- Instacart Statistics
- How Late Is The Closest Grocery Store Open and Close?
General Online Shopping Statistics
- The highest frequency of shopping online is once per month with 31% of shoppers in the USA.
- In 2023, in the USA, it was projected that 16.4% of retail purchases would be captured by online shopping, with a valuation of $1.1 trillion in sales for the eCommerce market.
- Furthermore, by 2026, 24% of retail purchases will be held by online shopping.
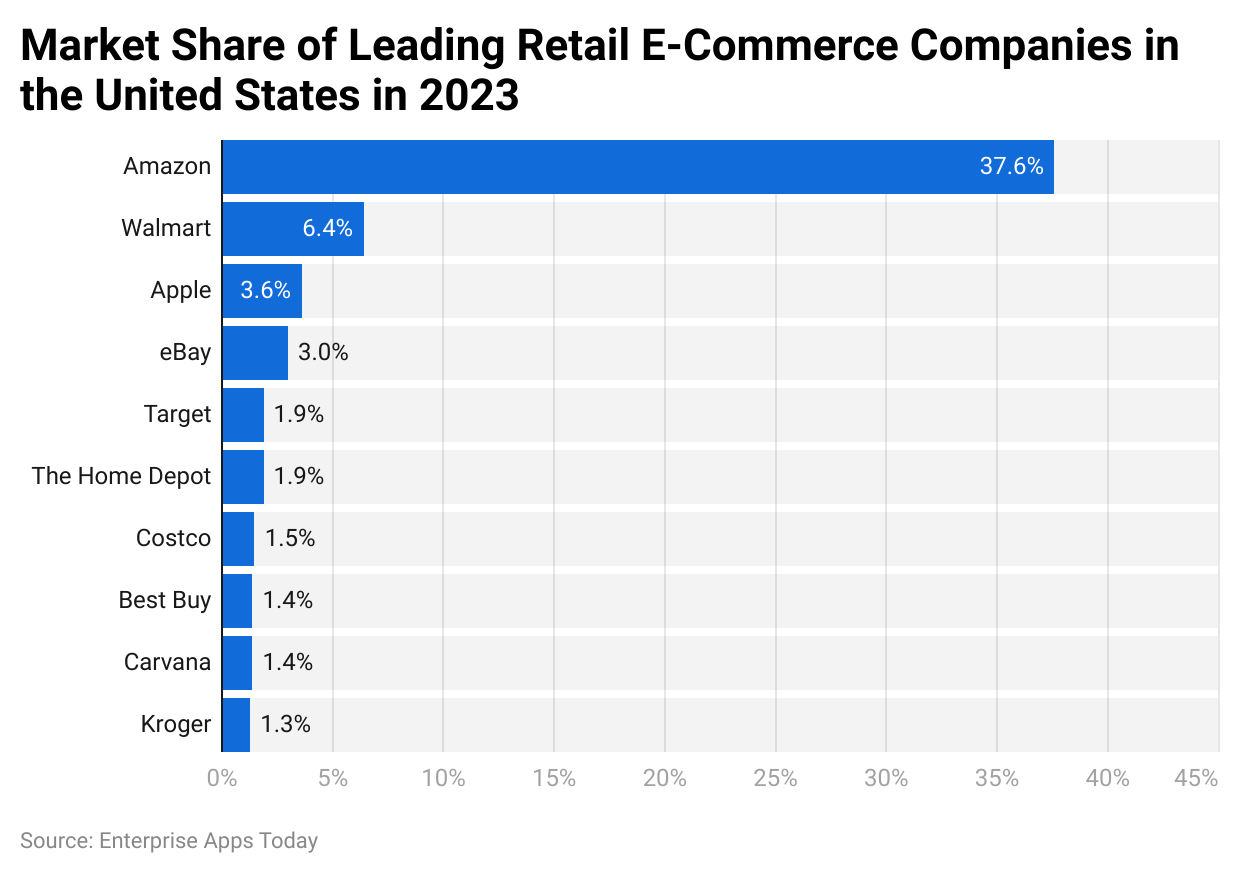
By Biggest Online Retailers' Market Share
 (Reference: statista.com)
As of 2023, Amazon, Walmart, and Apple are the leading online retailers in the e-commerce industry with a share of 37.6%, 6.4%, and 3.6% in the USA. The list included the names of other popular eCommerce retailers such as eBay, Target, Costco, Best Buy, Carvana, and Kroger.
General In-store Shopping Statistics
- 61% of shoppers choose in-store shopping because they prefer to try or see the products before purchase.
- Furthermore, 60% of consumers in the USA chose in-store shopping because after making a payment they can immediately have the product in their hands.
- In the US, The brick and mortar shopping in 2023 was valued at $6.22 trillion.
- Every year in the US, grocery stores make up to $6.22 trillion.
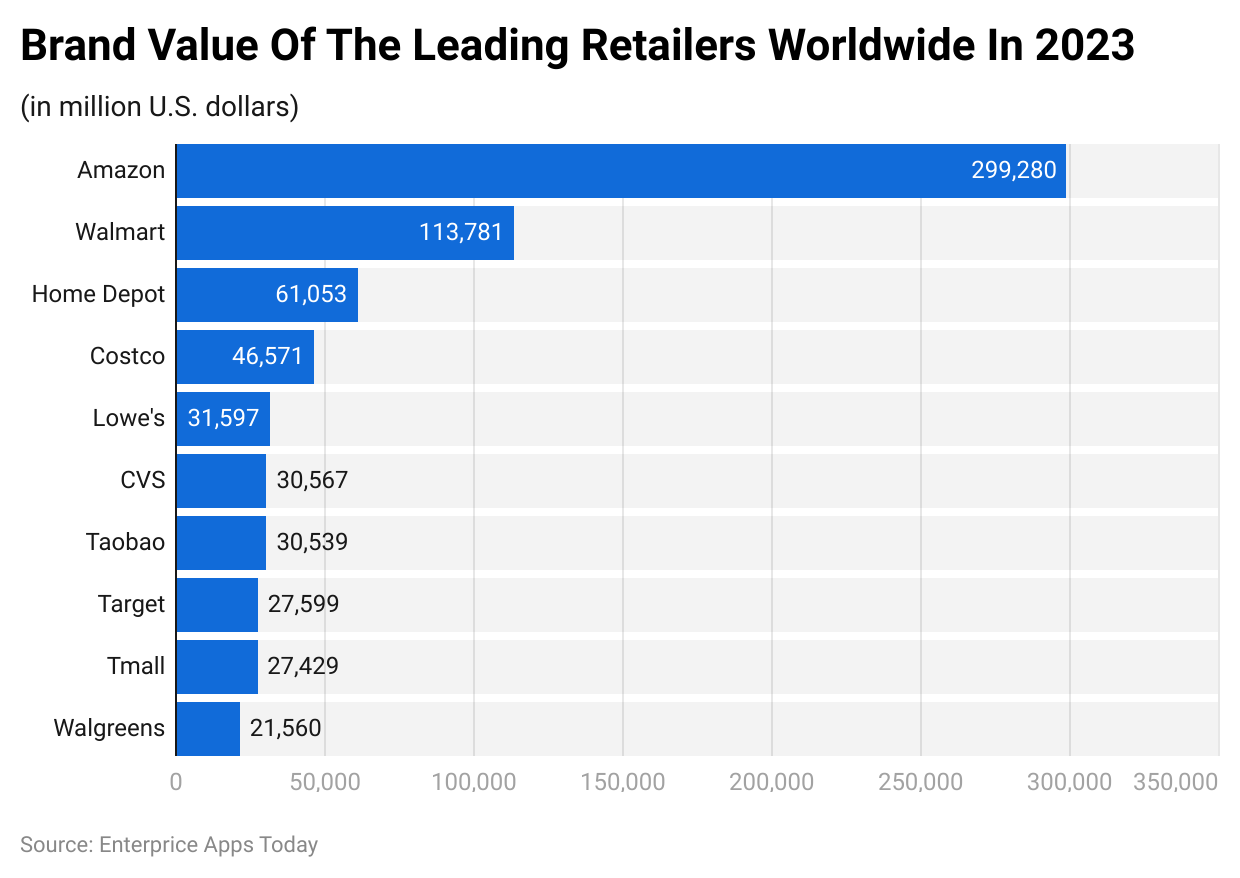
By Brand Value Of Top Retailers In The USA
 (Reference: statista.com)
General Online Vs In-Store Shopping Statistics
- 75% of consumers around the world shop online at least once every month.
- 63% of shopping journeys are more likely to start online irrespective of whether consumers end the journey by shopping in-store or online.
- 40% of shoppers complete their shopping in-store at least once every week, on the other hand, it is 27% of online shoppers.
- According to 80% of shoppers, they are more likely to make a purchase online because in-stores do not provide a convenient return policy.
- According to Online Vs In-Store Shopping Statistics 2023, retailers with physical stores increased their online sales as follows health and personal (4.7%), Food and beverage stores (5.1%), and general merchandise stores (8.7%).
- On the other hand, similar to the above statements, online sales for the following categories reduced, furniture and home furnishing (16.2%), motor and vehicle parts dealers (3.2%), electronics and appliance store (1.6%).
- As of 2023, 6 out of 10 shoppers around the world said it is easier to return the product in-store as compared to online.
- 45% of consumers do online as well as offline shopping.
- The rate of return for online products is more than for products purchased in-store resulting in 31% and 8.89% respectively.
By Product Category
- 81.8% of consumers in the USA buy groceries online instead of going to the store.
- 50% of shoppers prefer to buy personal care and beauty products in stores.
- In addition, in-store purchases are preferred for footwear and apparel (40%) and home goods (28%).
- 75% of consumers prefer to buy perishable products in stores.
By Market Share And Revenue
As of Q2 of 2023, product categories made the following retail e-commerce sales
- General merchandise stores, 10.1% ($27 billion),
- Motor and vehicle parts dealers, 5.4% ($15 billion),
- Electronics and appliances stores, 4.6% ($13 billion),
- Non-store retailers, 61.8% ($168 billion),
- Clothing and clothing accessories stores, 6.2% ($17 billion),
- Furniture and home furnishings stores, 1.6% ($4 billion),
- Food and beverage stores, 2.8% ($7 billion),
- Miscellaneous, including gasoline stations, 1.8% ($ 5 billion),
- Health and personal care stores, 0.7% ($2 billion),
- Building materials, garden equipment, and supplies dealers, 3.7% ($10 billion),
- Sporting goods, hobbies, musical instruments, and bookstores, 1.3% ($4 billion).
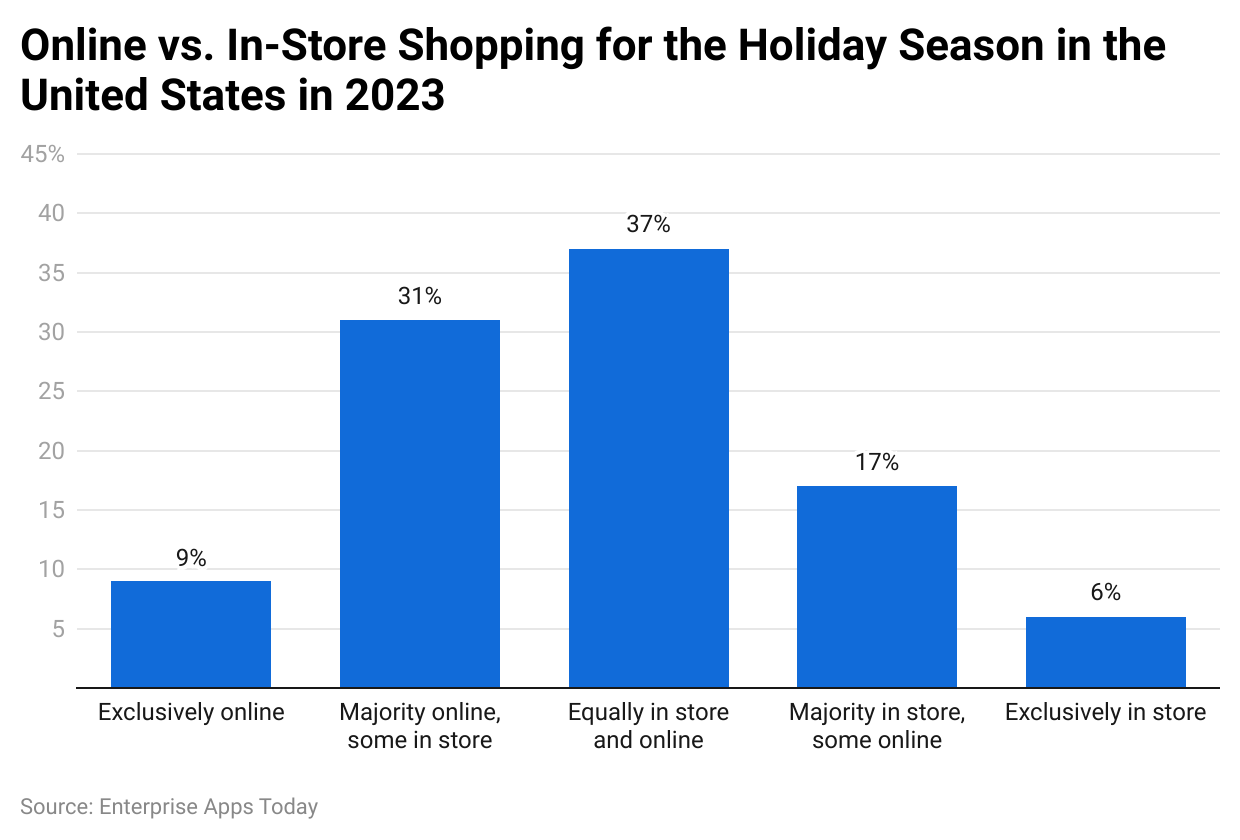
by Holiday Shopping Preference
 (Reference: statista.com)
As per Online Vs In-Store Shopping Statistics 2023, in the USA, most consumers preferred to shop equally in-store and online. Furthermore, 31% of Americans majorly shopped online as compared to in stores. However, the comparison of both methods shows there is a slight difference in shopping online as compared to in-store.
By Projected Holiday Budget Spent
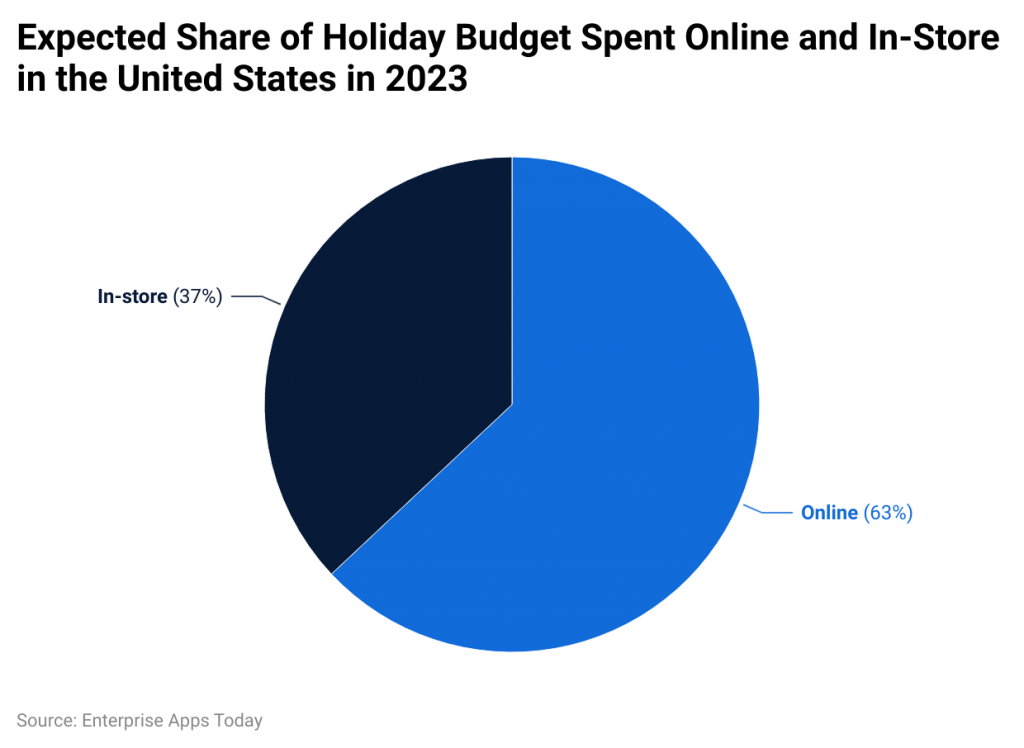
(Reference: statista.com)
As of 2023, in the USA, consumer spending on online shopping was more as compared to in-store shopping resulting in 63% to 37% respectively.
By Country
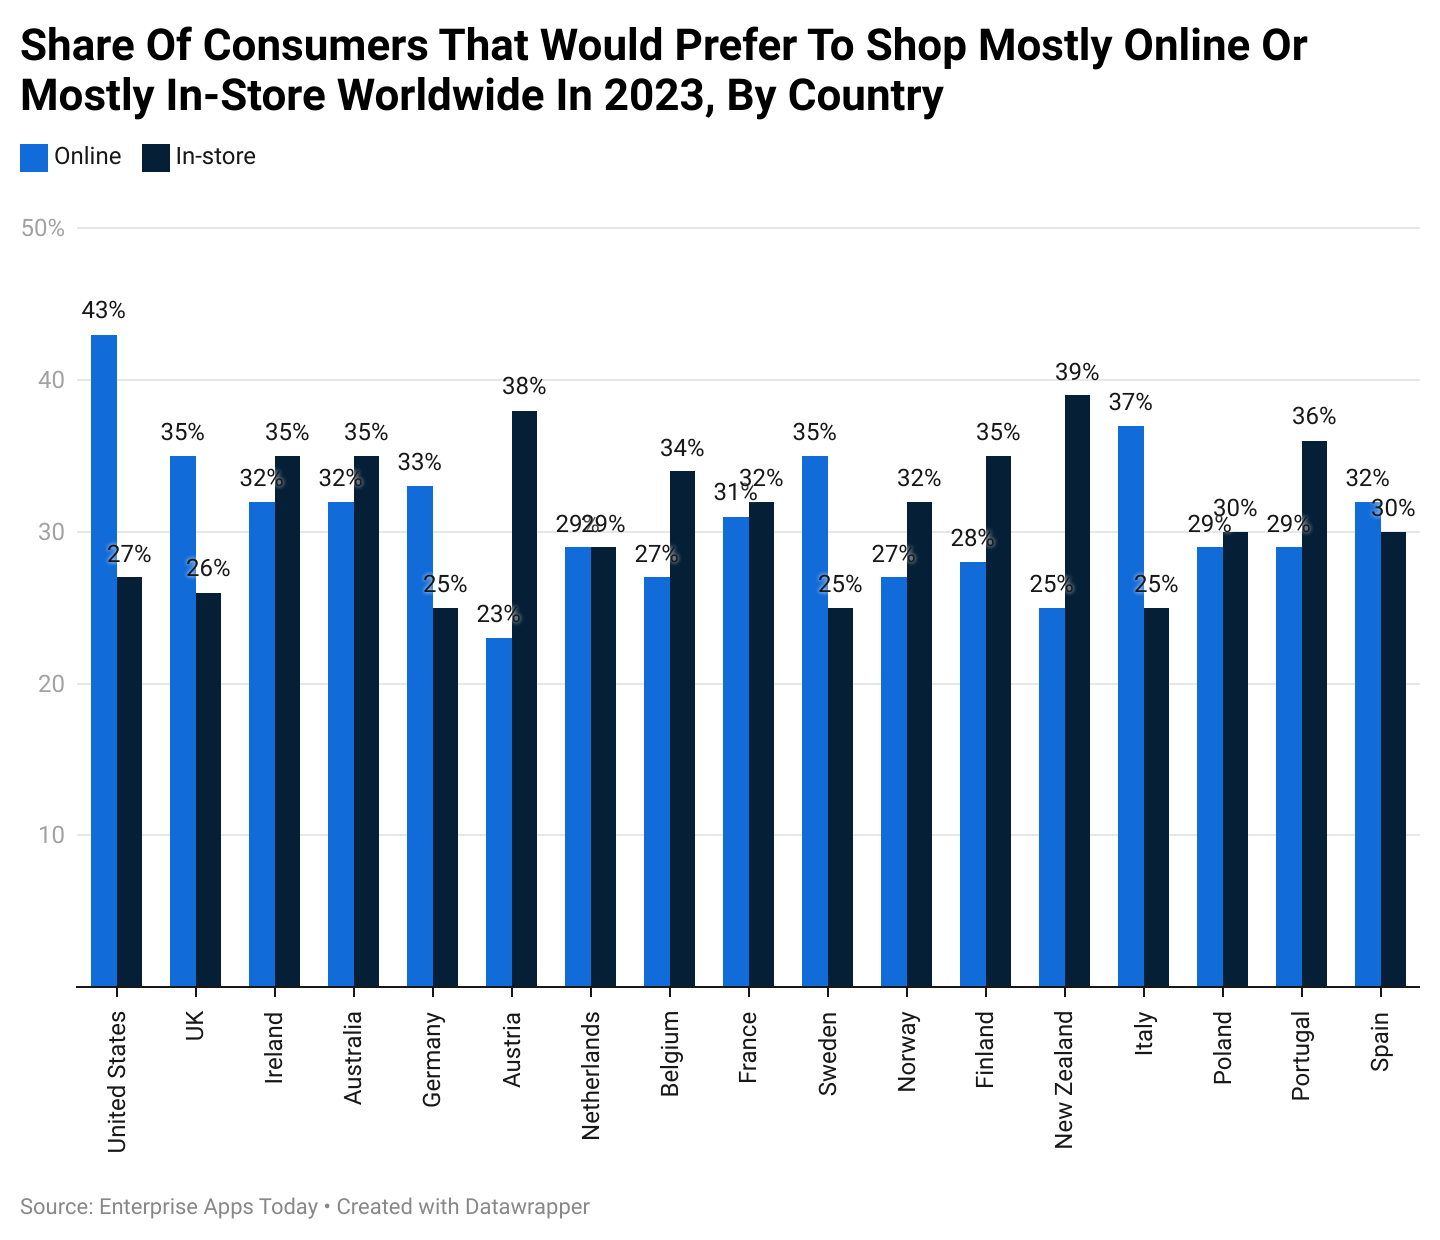 (Reference: statista.com)
In 2023, compared to other countries, shoppers in the United States preferred online shopping resulting in 43%, while in other countries huge preference was given to in-store shopping. Zew Zealand has the majority of the shoppers who prefer in-store shopping. Each of the shopping methods in selected countries is comparatively more or less, but preferred by everyone.
By Biggest Spending Locations
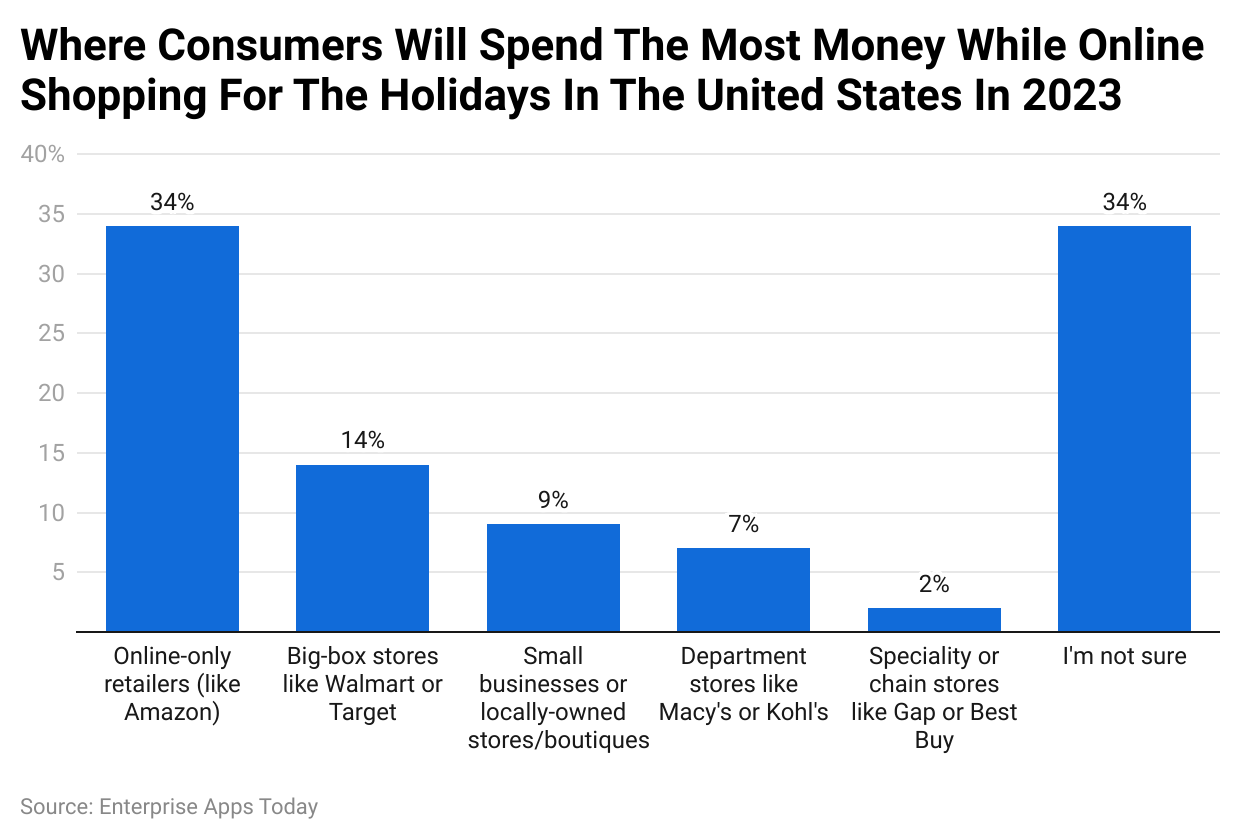 (Reference: statista.com)
Online Vs In-Store Shopping Statistics 2023 reported that a huge number of shoppers in the USA were likely to shop online only for example Amazon, similarly 34% of Americans needed clarification about where they wanted to shop.
By Holiday Shopping Research Plans By Channel
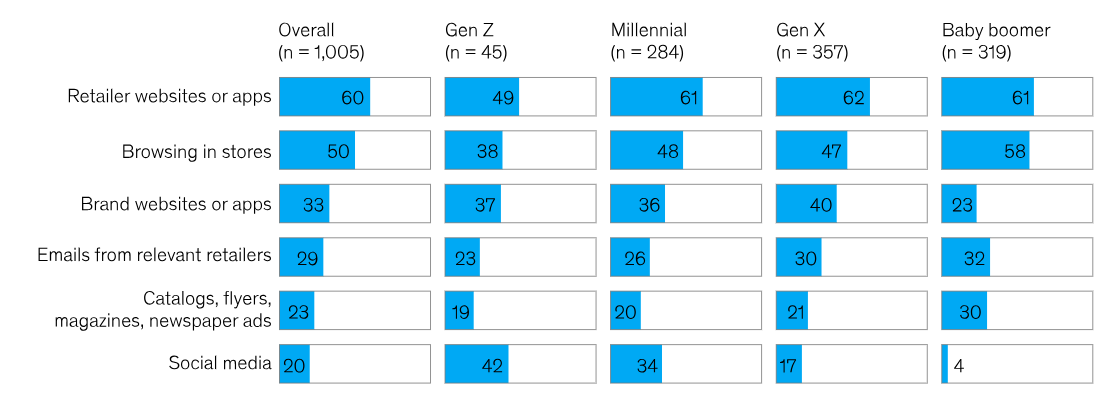
(Source: mckinsey.com)
According to a survey conducted by McKinsey, US Holiday Shopping 2023, the research for shopping in all generations was more seen on retailer websites or apps and browsing in stores. Similarly, consumers in Gen Z and millennials also preferred social media to research products for shopping.
By Fulfillment Method
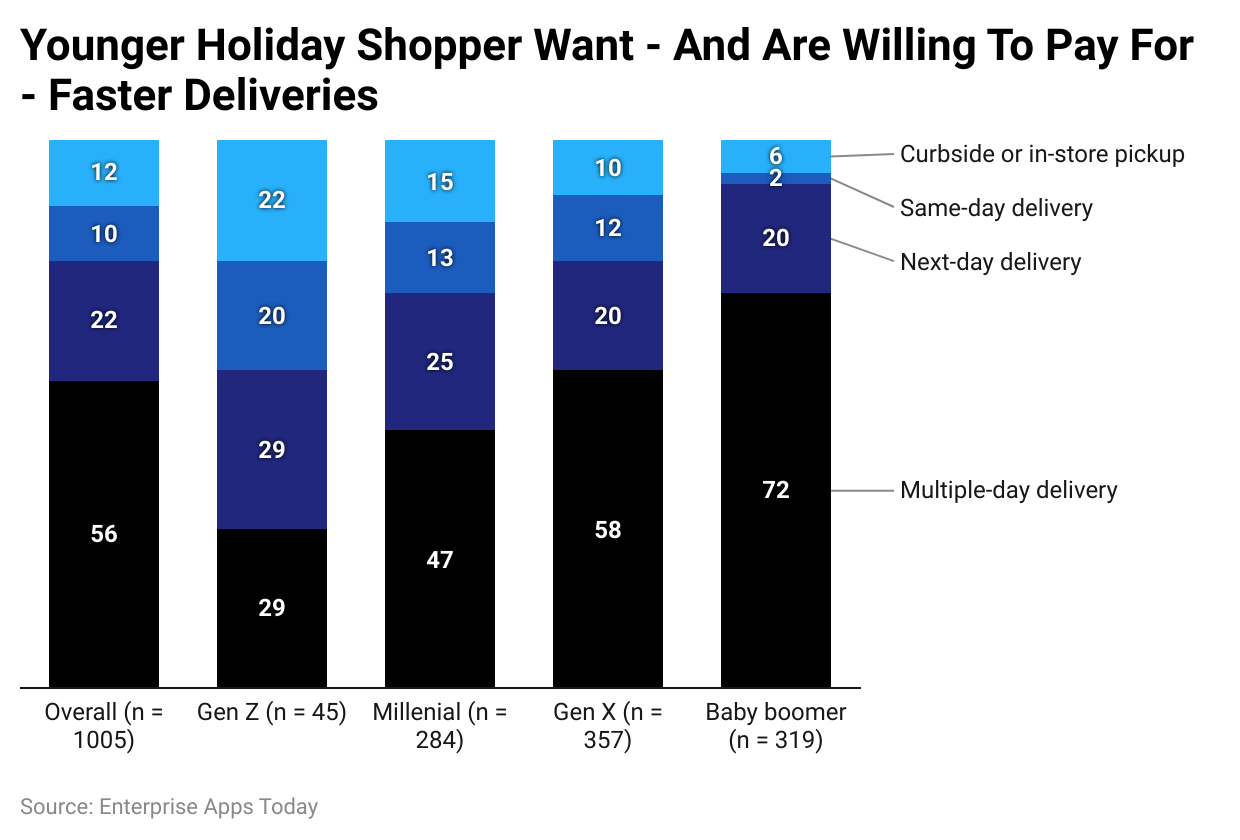 (Reference: mckinsey.com)
According to a report by McKinsey, US Holiday Shopping 2023, with the online shopping trend, Americans preferred multiple-day delivery in all generations. However, in-store pick is more preferred by Gen Z as compared to shoppers in a similar category resulting in 22%.
By Holiday Season
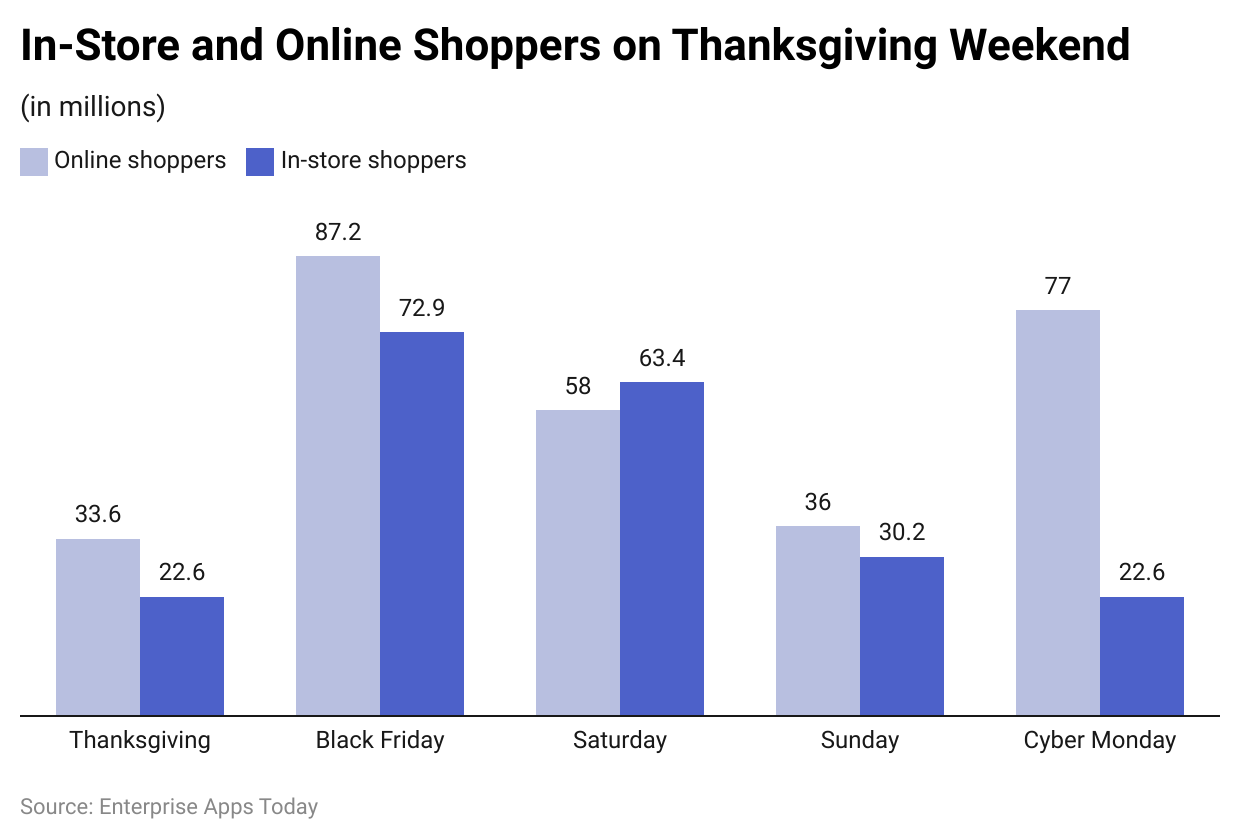 (Reference: forbes.com)
According to Online Vs In-Store Shopping Statistics 2022, during holidays majority of the consumers preferred to shop online. However, Between Black Friday and Cyber Monday, the scenario changed to more in-store shopping on Saturday.
By The Behavior Of Shoppers
- While shopping in-store, 60% of shoppers depend on social media or blogs to make purchase decisions.
- 65% of shoppers do price comparisons on their mobile devices while shopping in stores.
- 51% of shoppers are more likely to be influenced by checking price comparisons of in-store and online products before making a purchase decision.
- More than half of shoppers have a habit of checking product reviews online and then locating the store to purchase it.
By Retail Sales
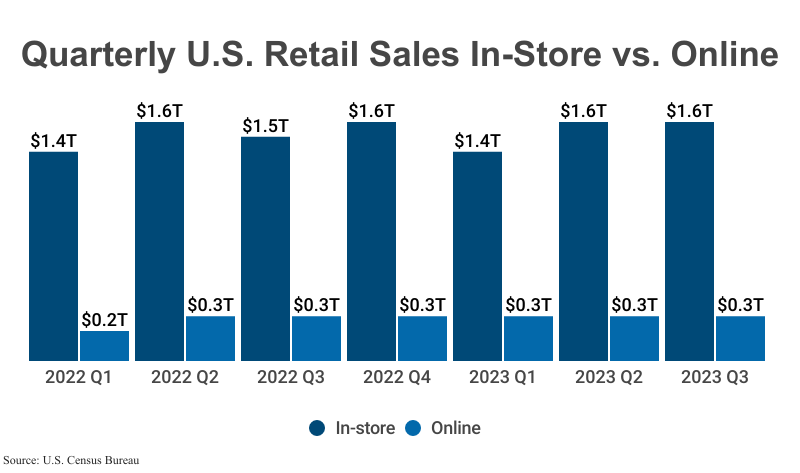 (Source: capitaloneshopping.com)
Since 2022, Online vs. in-store Shopping Statistics show that there has been considerable sales in in-store as compared to online shopping. During above mentioned period, consumers however also preferred to shop online but was comparatively lower than the other shopping methods. In addition, each shopping method's sales were valued at a trillion dollars.
By Footfall or Traffic For Selected Retailers
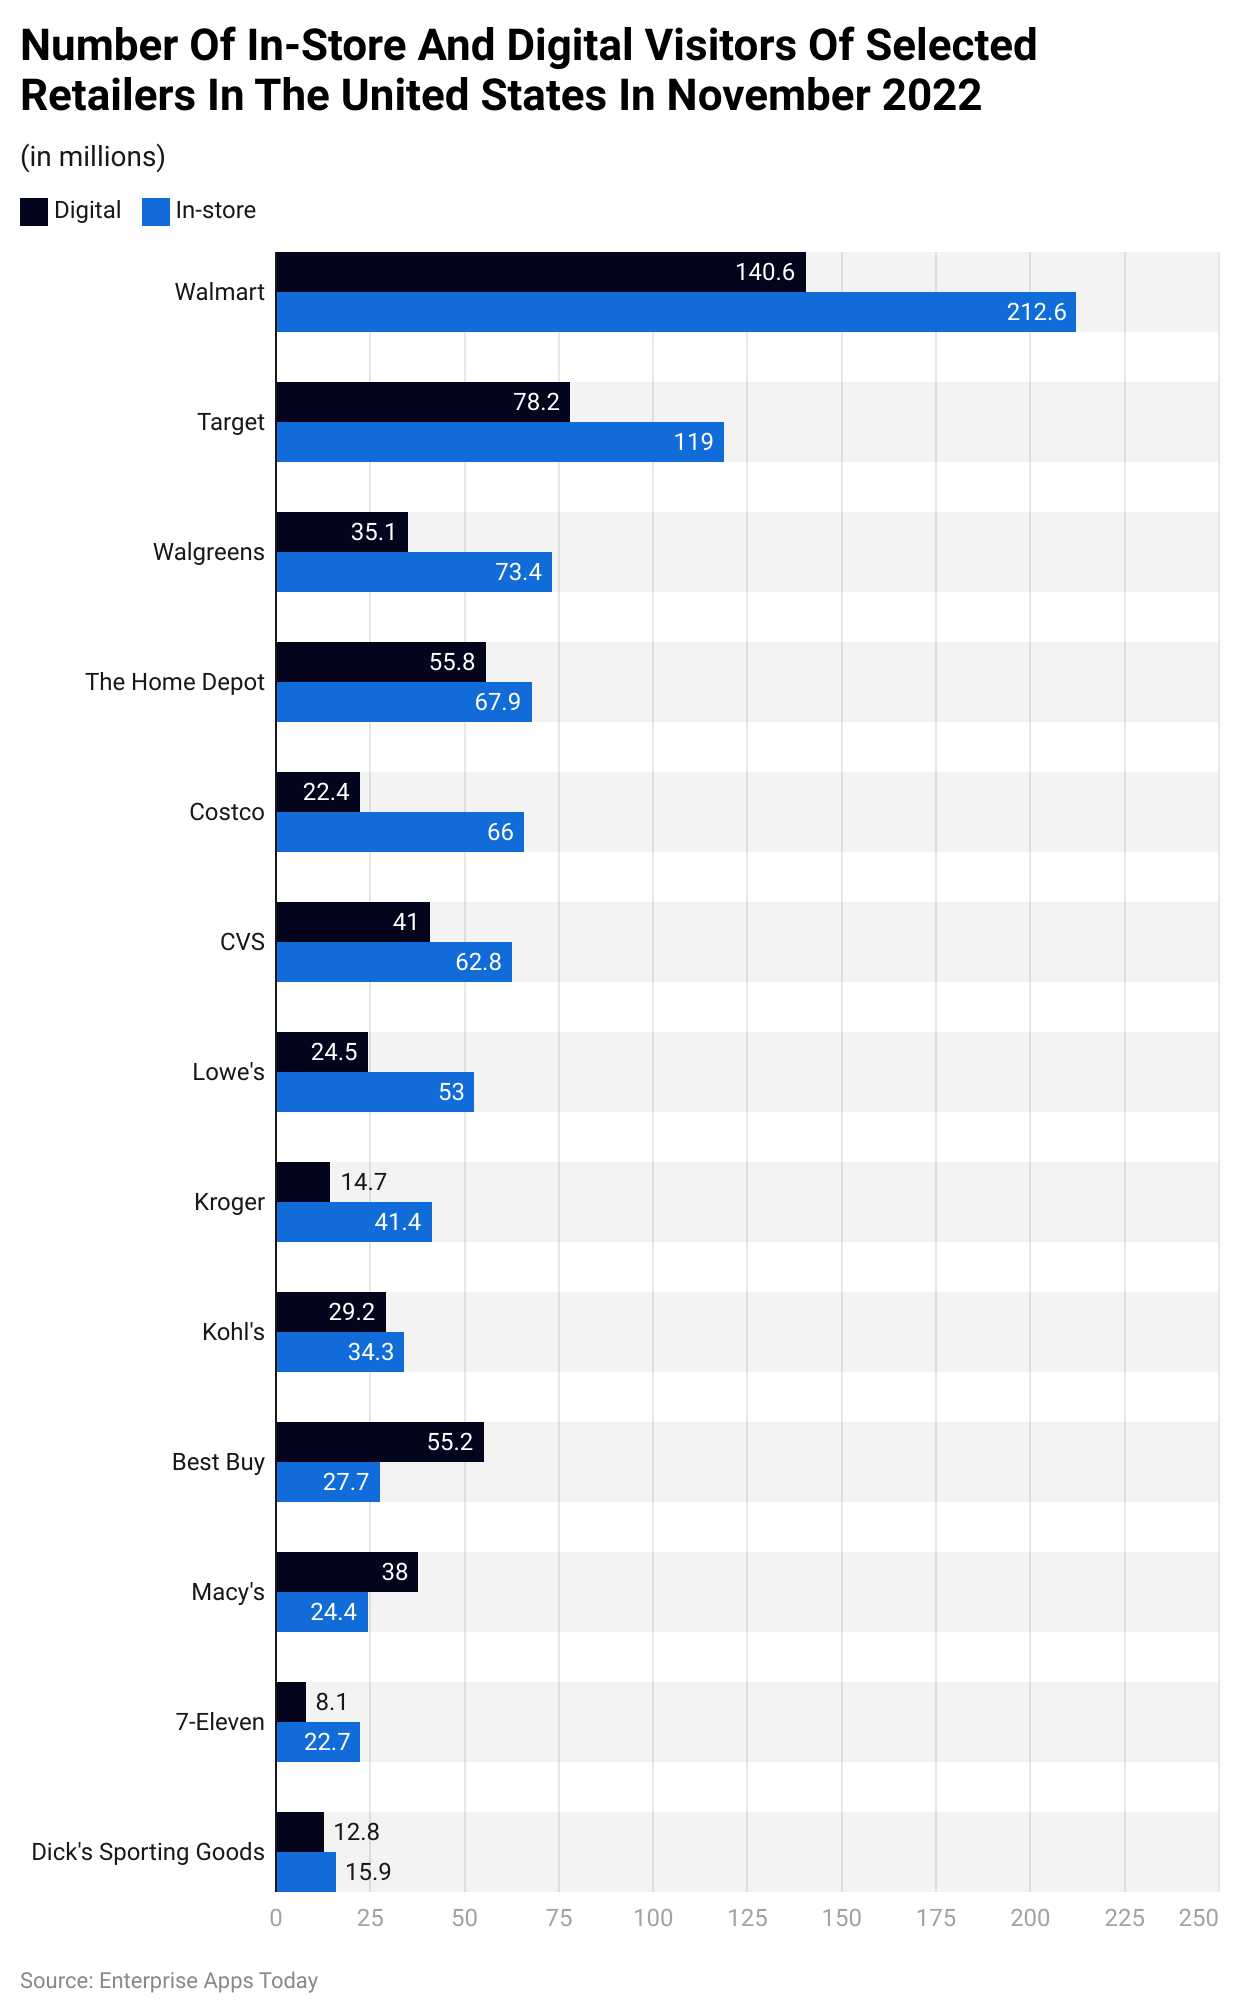 (Reference: statista.com)
Understand online vs offline shopping, there’s a greater trend for in-store shopping for the majority of the well-known brands in the USA. As of 2022, Walmart, Target, Walgreens, The Home Depot had the highest number of footfalls. On the other hand, Best Buy and Macy’s were the only 2 retailers with the largest online shopping.
By Generation
- 36% of consumers in Gen Z shop in-store as well as online.
- Furthermore, about 38% of adults in Gen Z prefer online shopping.
- 30% of millennials are regular shoppers online and in-store, on the other hand, 38% of them choose in-store shopping.
- Similarly, 30% of GenX and 22% of baby boomers prefer to shop online.
- On the other hand, 23% of Gen X and 18% of baby boomers prefer to shop both, online and in-store.
By Return Process
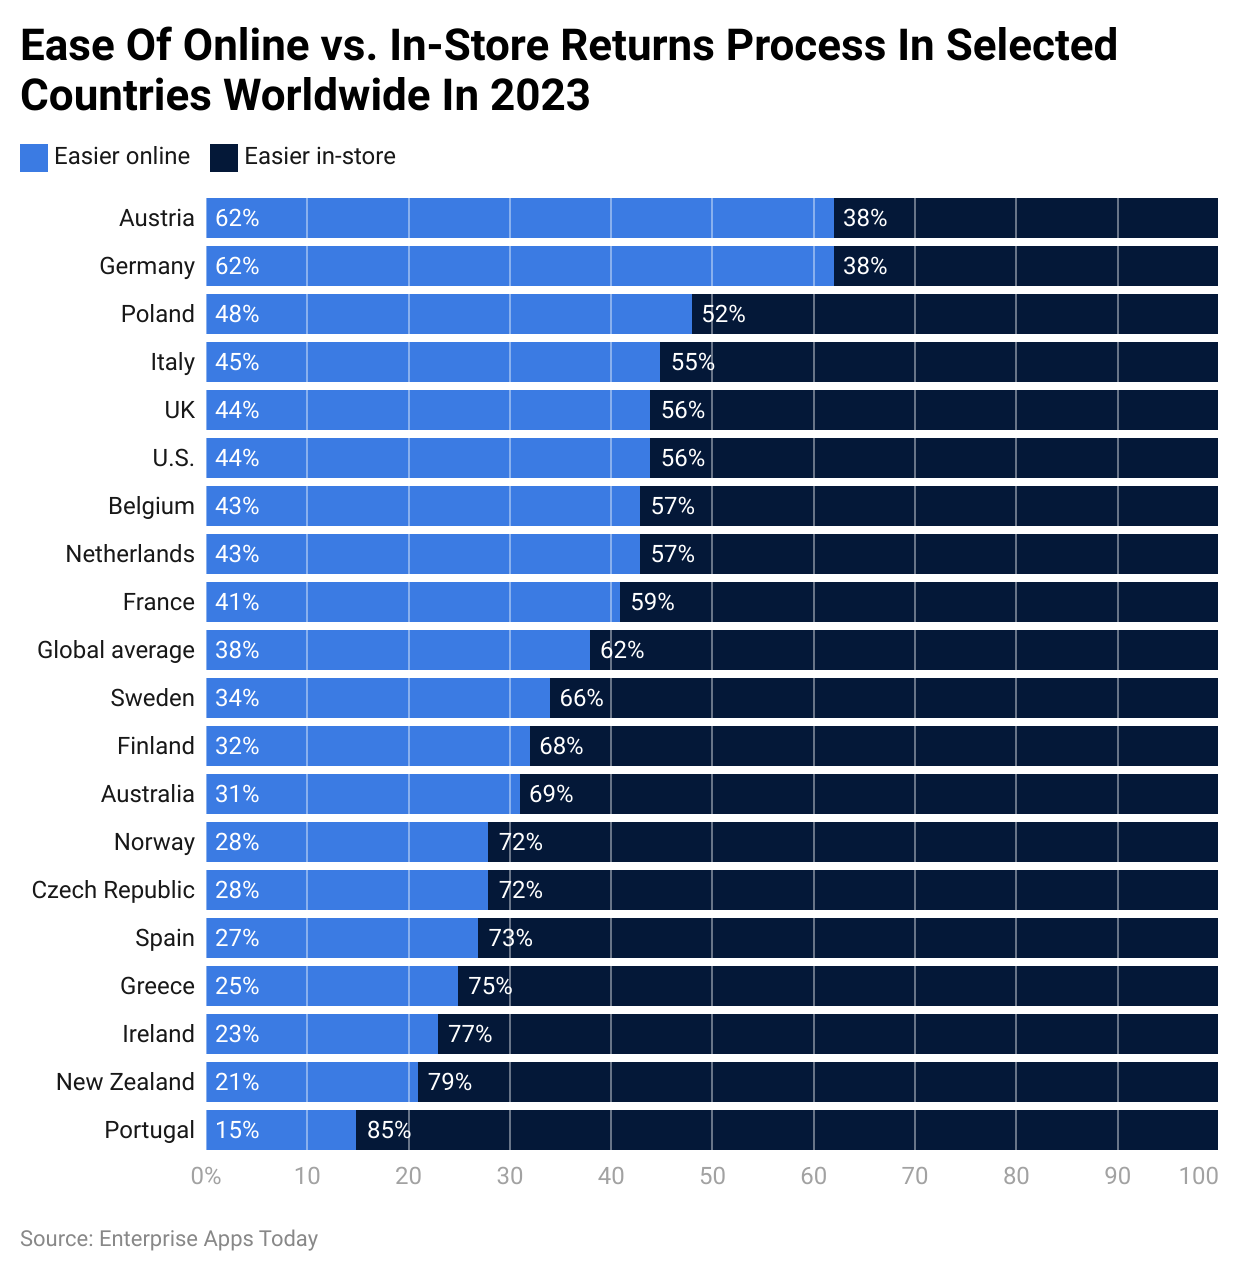 (Reference: statista.com)
Compared to other selected countries in a survey by Statista, Austria and Germany have more easier online return process as told by 62% of respondents each. However, other countries agree to the opposite and say the in-store product return process is much easier.
By Preferred Method
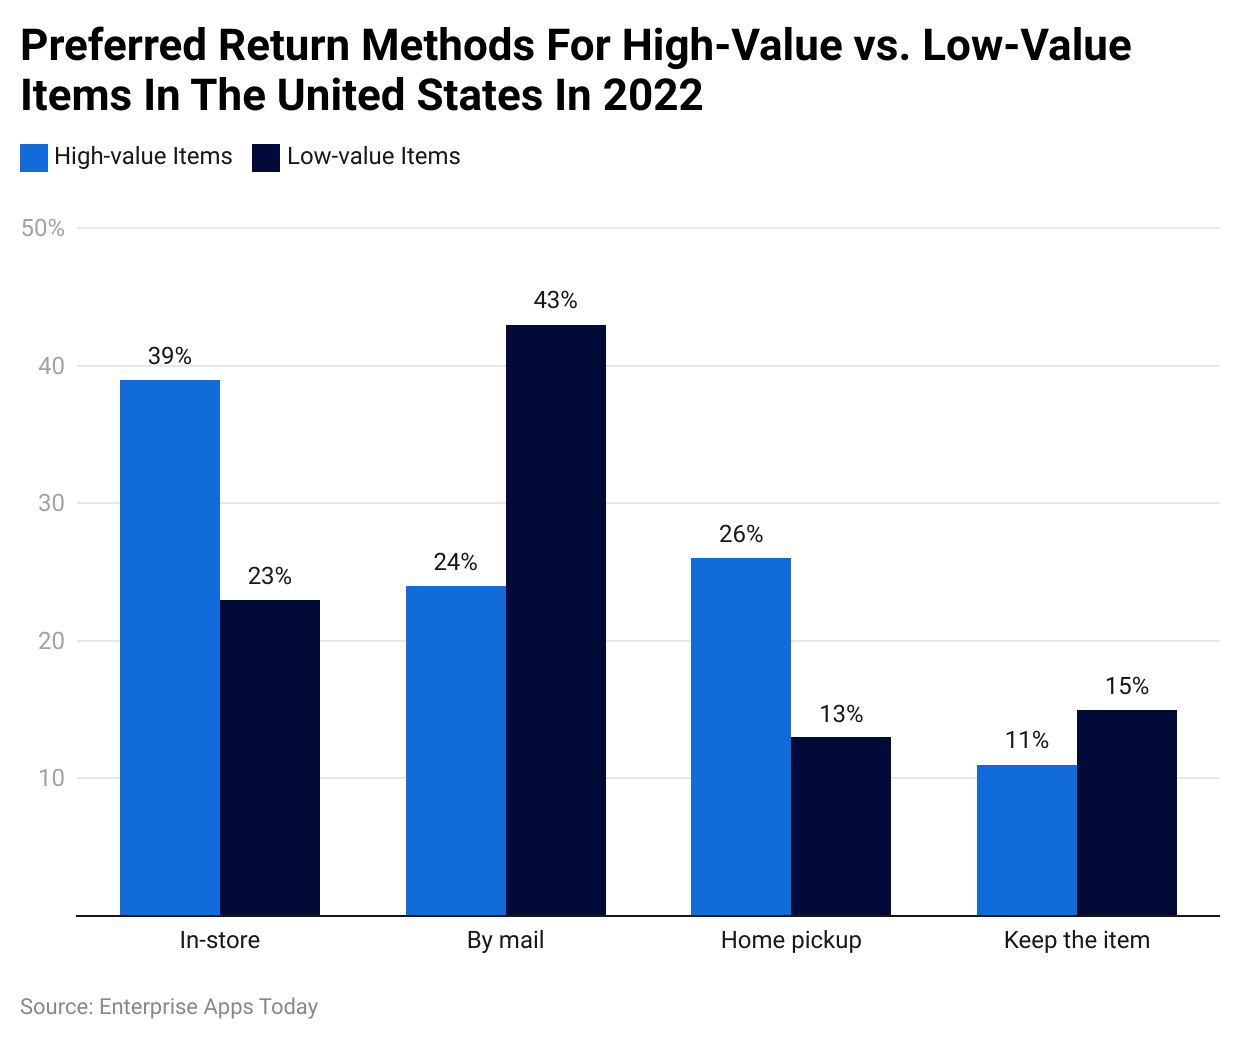 (Reference: statista.com)
In the USA, as of 2022, online as well as in-store shoppers preferred to return low-value items by mail (43%), while high-value items were returned in-store (39%). On the other hand, 11% of respondents to the Statista survey said they keep the high-value items, while the same answer was given by 15% of shoppers for low-value items.
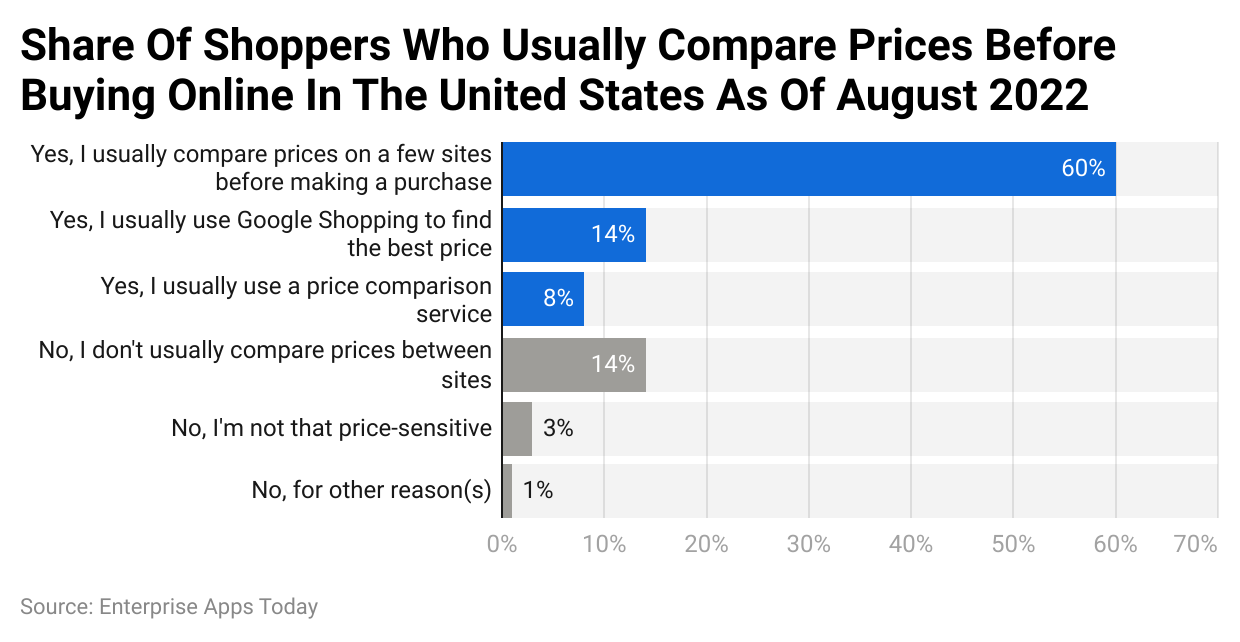 (Reference: statista.com)
The majority of shoppers in the US in 2022, did an online comparison of prices for the product before making the purchase representing 60%, while 14% preferred to visit the Google Shopping website to find the best price. 3% of shoppers did not do any price comparison, while 14% said, they use a price comparison service before purchasing a product.
Conclusion
Shopping is a never-ending process. And in-store and online shopping have their pros and cons. In-store shopping offers authentic products, consumers can see and feel them, electronic goods can be tested before purchase, and products can be owned once the payment is made. However, online shopping is a game of patience.
Consumers can not see or touch the product, they cannot verify the authenticity before purchase. In addition to these, online product policies are complicated as compared to in-store return policies. Well, nothing can affect the habit of shopping, as stated by Online vs. in-store Shopping Statistics.
Sources
FAQ.
Online shopping is more convenient and accessible than physically driving to stores and standing in queues for payments. However, eCommerce stores have n number of authentic products. Before purchasing the same, authenticity should be checked to avoid any damage.
Online products are sold at cheaper prices because there is a low number of middlemen. Thus it is possible to provide deals and discounts, free shopping directly from the manufacturer.
Depending on the company, products can be delivered in half an hour to less than 24 hours. Extra charges for the express delivery are required to be paid by the consumers.
Depending on the company, the delivery charges range from less than $10 to more.

Barry is a lover of everything technology. Figuring out how the software works and creating content to shed more light on the value it offers users is his favorite pastime. When not evaluating apps or programs, he's busy trying out new healthy recipes, doing yoga, meditating, or taking nature walks with his little one.