
Pet Ownership Statistics 2024 By Types Of Pets, By Region, Country and Demographics

Page Contents
Introduction
Pet Ownership Statistics: Pet ownership has been on the rise in recent years, with 67% of households in the United States owning a pet, according to the American Pet Products Association (APPA) in 2021. Americans are increasingly willing to invest in their furry companions, with total pet expenditures reaching USD 103.6 billion in 2020, a 6.7% increase from the previous year, as reported by the APPA
Dogs remain the most popular pet choice, with 63.4 million households owning at least one dog, followed by cats, with 42.7 million households, according to the American Veterinary Medical Association (AVMA) in 2020. Pet owners prioritize the health and well-being of their animals, spending USD 32.46 billion on veterinary care and products in 2020, according to the APPA
The COVID-19 pandemic has further fueled pet ownership, with an estimated 11.38 million U.S. households adopting a pet during the pandemic, according to a survey conducted by the APPA.
Editor’s Choice
- Approximately 68% of households in New Zealand own at least one pet, indicating a significant presence of furry companions in Kiwi homes.
- In the United States With 90 million households in the United States owning at least one type of pet, the U.S. pet ownership market is substantial and diverse.
- People from the millennial age group boast the highest percentage of pet ownership, comprising 33% of current pet owners, followed by Gen X (25%) and baby boomers (24%).
- The global pet population surpassed 83 million in 2021, highlighting the widespread love and care for animals across the world.
- A staggering 90% of American households prefer dogs over any other type of pet, making them the most popular choice among pet owners.
- Pet Market Growth: The global pet market was valued at USD 261 billion in 2021 and is projected to reach USD 350 billion by 2027, signifying significant growth and opportunities in the pet industry.
- In the U.S. alone, pet owners spent USD 136.8 billion on their pets in 2022, marking a substantial increase from the previous year.
- Despite the importance of pet health, only 2% of pet owners in the U.S. have pet insurance, indicating potential for growth in this sector.
- While 42% of dog owners and 43% of cat owners acquire their pets from stores, a significant portion (38% of dog owners and 40% of cat owners) opt for animal shelters or rescues.
- Essential dog expenses average around USD 1,533 annually, highlighting the financial commitment associated with pet ownership.
- 70% of households in the U.S. own a pet, reflecting the widespread affection for animal companionship in American homes.
- There are approximately 844 million cats and dogs living as pets worldwide, underscoring the significant presence of these animals in households across the globe.
- A staggering 69 million households in the U.S. own dogs, making them one of the most beloved pets in the country.
- Europeans own at least 80.8 million cats, highlighting the popularity of feline companionship in the region.
You May Also Like To Read
- Wine Industry Statistics
- Bicycle Industry Statistics
- Christmas Spending Statistics
- Coffee Industry Statistics
- Fashion Industry Statistics
- Tea Statistics
- Coca-Cola Statistics
- Home Improvement Industry Statistics
- Golf Industry Statistics
- Amazon Statistics
Facts About Pet Ownership
- Pet ownership continues to rise globally, with an estimated 70% of households worldwide owning at least one pet, reflecting the enduring popularity of animal companionship.
- The global pet market is experiencing robust growth, with its value reaching USD 261 billion in 2021 and projected to reach USD 350 billion by 2027, indicating significant opportunities for industry stakeholders.
- In 2022, pet owners in the U.S. spent a staggering USD 136.8 billion on their pets, up nearly 11% from the previous year, underscoring the importance of pet care in household budgets.
- The overall pet population is expected to exceed 83 million globally in 2024, indicating sustained growth in pet ownership worldwide.
- A significant 69 million households in the U.S. own dogs, reaffirming their status as one of the most beloved pets in the country.
What Refers To The Term Pet?
A pet or a companion animal is an animal kept at home without any intention of working animal, farming, or lab animal. The most common animals that get adopted are dogs and cats. Other types of animals that can also be kept as pets are hamsters, birds, turtles, frogs, and parrots.
Types Of Pets Around The World?
Multiple types of animals can be called pets. Following are some types of pets found usually in households around the world.
Traditional Pets:
These types of pets are bred in houses and do not live in wild locations. Traditional pets mature speedily. They have multiple seasons of breeding in one year. The most common types of these pets are dogs and cats. Their lifespan is also low, and dogs are commonly known as man’s most loyal friends.
Exotic Pets:
Many exotic pets are illegal to keep at home, but the rules differ from country to country. This type of pet includes lories, cockatoos, Amazons, African greys, and other birds, reptiles such as ornate box turtles, Chinese water dragons, Burmese pythons, anoles, bearded dragons, amphibians such as northern leopard frogs, dwarf clawed frogs, fire-bellied toads, and clawed frogs. And rodents such as gerbils, prairie dogs, ferrets, rats, mice, and chinchillas.
If you are considering keeping a pet, please look into the. type of house you own. Because many pets need bigger space to live, depending on their size. Moreover, it is also necessary to take care of the salary bracket. The average expense on them per year is around $1,000. Last but not least, pets are not for bullies, do not bully them or trouble them in any kind of way that leads to death or bleeding, These actions may take you up in jail.
General Pet Ownership Statistics
- People from the millennial age group have the highest percentage of pet ownership.
- As per Pet ownership statistics, the USA has 60% of households own pets.
- There are 90 million households in the United States of America that own at least one kind of pet.
- The percentage of dogs getting insured is more than any other type of pet.
- Around 81.7% are dogs insured and only 18.3% are cats insured.
- A dog is more likely to go to the vet than any other type of pet.
- The number of vet visits for dogs is 2.4 for every household as compared to cats 1.3, birds (0.3), and horses (1.6).
- As of 2021, households in America spent around $123.6 billion on overall pets.
- Birds have the highest rate of adoption as compared to dogs or cats.
- Dogs are more popular and more likely to get adopted than any other household around the world.
- As per the pet ownership statistics, the number of households that own dogs is 69 million, cats (45.3 million), freshwater fish (11.8) million, and various pets such as horses, small animals, birds, and reptiles with an overall number of 10 million households.
- The overall pet population in the year 2021 exceeded 83 million around the world.
- Around 2.1 million cats and 2 million dogs get adopted every year around the world.
- 46% of the cat owners and 40% of the dog owners came to know about the adoption through word of mouth.
- As per pet ownership statistics, there is either one cat or dog for every 2.4 people considering one household.
- 90% of American households prefer dogs over any other type of pet in their family.
- 36% of American households give their dogs presents on their birthdays.
- According to pet ownership statistics, owning a pet improves human health.
- The global pet market in the year 2021 was $232.5 billion which is expected to rise by a CAGR of 7.4% with 332.9 billion by the year 2026.
 (Reference: spots.com)
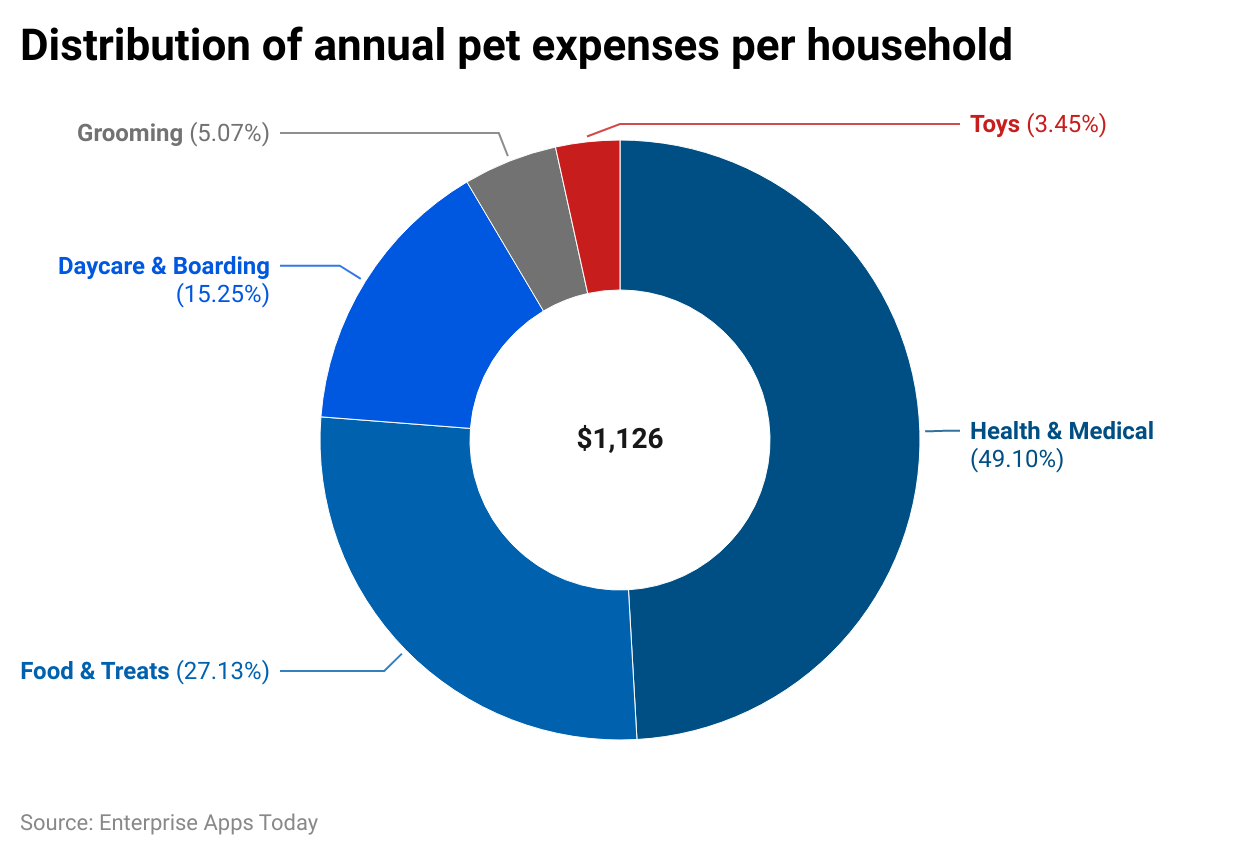
- On average a pet owner spends around $1,126 on pets.
- These expenses are divided into Daycare and boarding (15.25%), Toys (3.45%), Food and treats (27.13%), Grooming (5.07%), and Health and medical (49.10%).
- The maximum spent amount on pets every year is on health and medical resulting in 49.10%.
By Country
(Reference: Growth from knowledge)
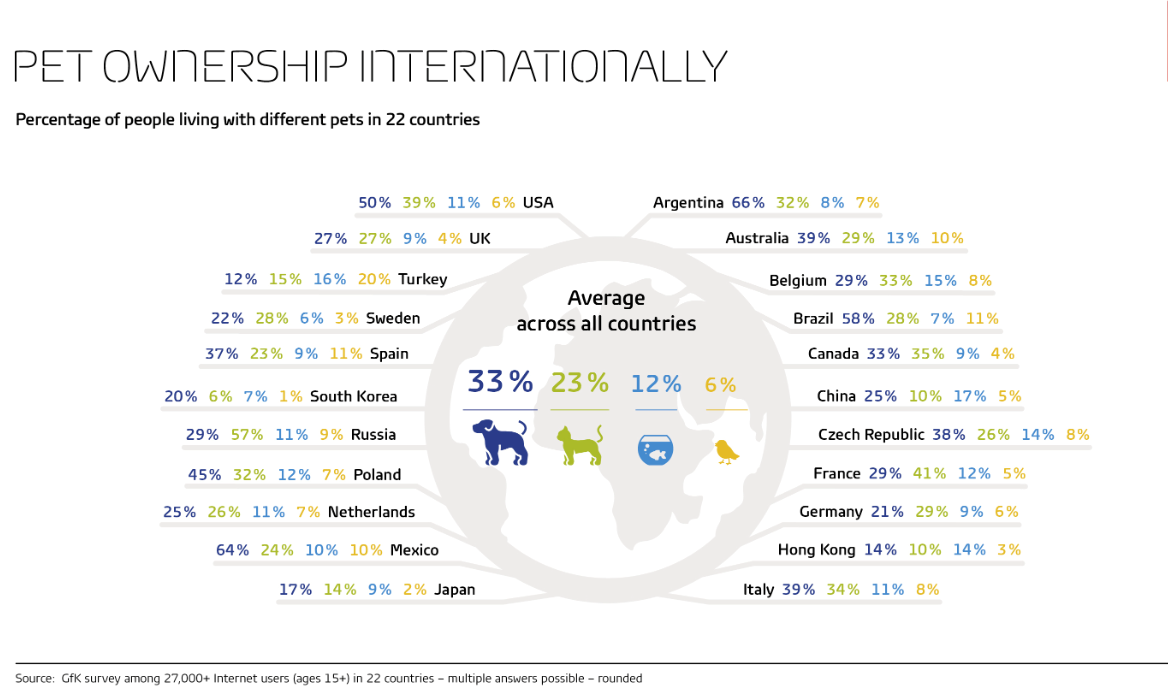
- The above chart explains the global percentage of pet ownership by country subcategorized by pet types.
- The average number of dog owners is 33%, whereas cat owners are 23%m fish and birds are adopted by 12% and 6% of households around the world.
- In Europe, around 90 million households owned at least one type of pet in the year 2021.
- Cats are more likely to get adopted in European countries as stated by pet ownership statistics.
- As of 2021, there are more than 1,14,000 cats in European unions as compared to dogs.
- In the EU, there were 9.8 million pet reptiles in the year 2021.
- There is the highest number of cat owners in EU countries such as France Germany and Romania.
- Asia Pacific pet ownership market size is 11.7 billion with a growth rate of 6.9%.
- Similarly, as per the pet ownership statistics, the Middle East and Africa have 0.9 billion pet ownership markets with a growth rate of 4.5%.
- Eastern Europe stands with a 5.7 billion market size at a growth rate of 5.4%.
- North America, Latin America, and Western Europe have a market size of 48.8 billion, 10.9 billion, and 28.6 billion respectively, with a growth rate of 1.8%, 3.4%, and 0.8% each.
- In the United States of America, around 5% to 10% of homeless people also adopt animals, more specifically cats and dogs.
- 60% of the population in India has at least one pet.
- The number of cat pets in India is expected to reach more than 2.4 million by the year 2023 as per Pet ownership statistics.
- In India, there are more than 10,200,000 pet dogs.
- The overall number of pet dogs is expected to reach more than 31 million by the year 2023 in India.

(Reference: Statista)
- As of 2021, there are 48% of the households in Romania own at least one cat.
- Similarly, Latvia, Poland, Hungary, and France have a cat ownership percentage of 37%, 34%, 34%, and 33% respectively.
- Other states in the European Union with the percentage of cat ownership are Slovenia (32%), Lithuania (32%), Portugal (32%), Australia (28%), Belgium (27%), Germany (26%), Netherlands (25%), Bulgaria (25%), Finland (23%), Czechia (22%), Sweden (21%), Italy (21%), Denmark (19%), Estonia (18%), Ireland (18%), Spain (16%), Slovakia (15%), and Greece (13%).
- India has the fastest-growing dog population in the world.
- Fish pets are more popular in the United Kingdom.
- In Saudi Arabia, 70% of the dog population belongs to large breeds.
- 68% of the households in New Zealand own at least one pet.
- 53% of the Australian population is looking forward to owning a pet.
(Reference: PetSecure)
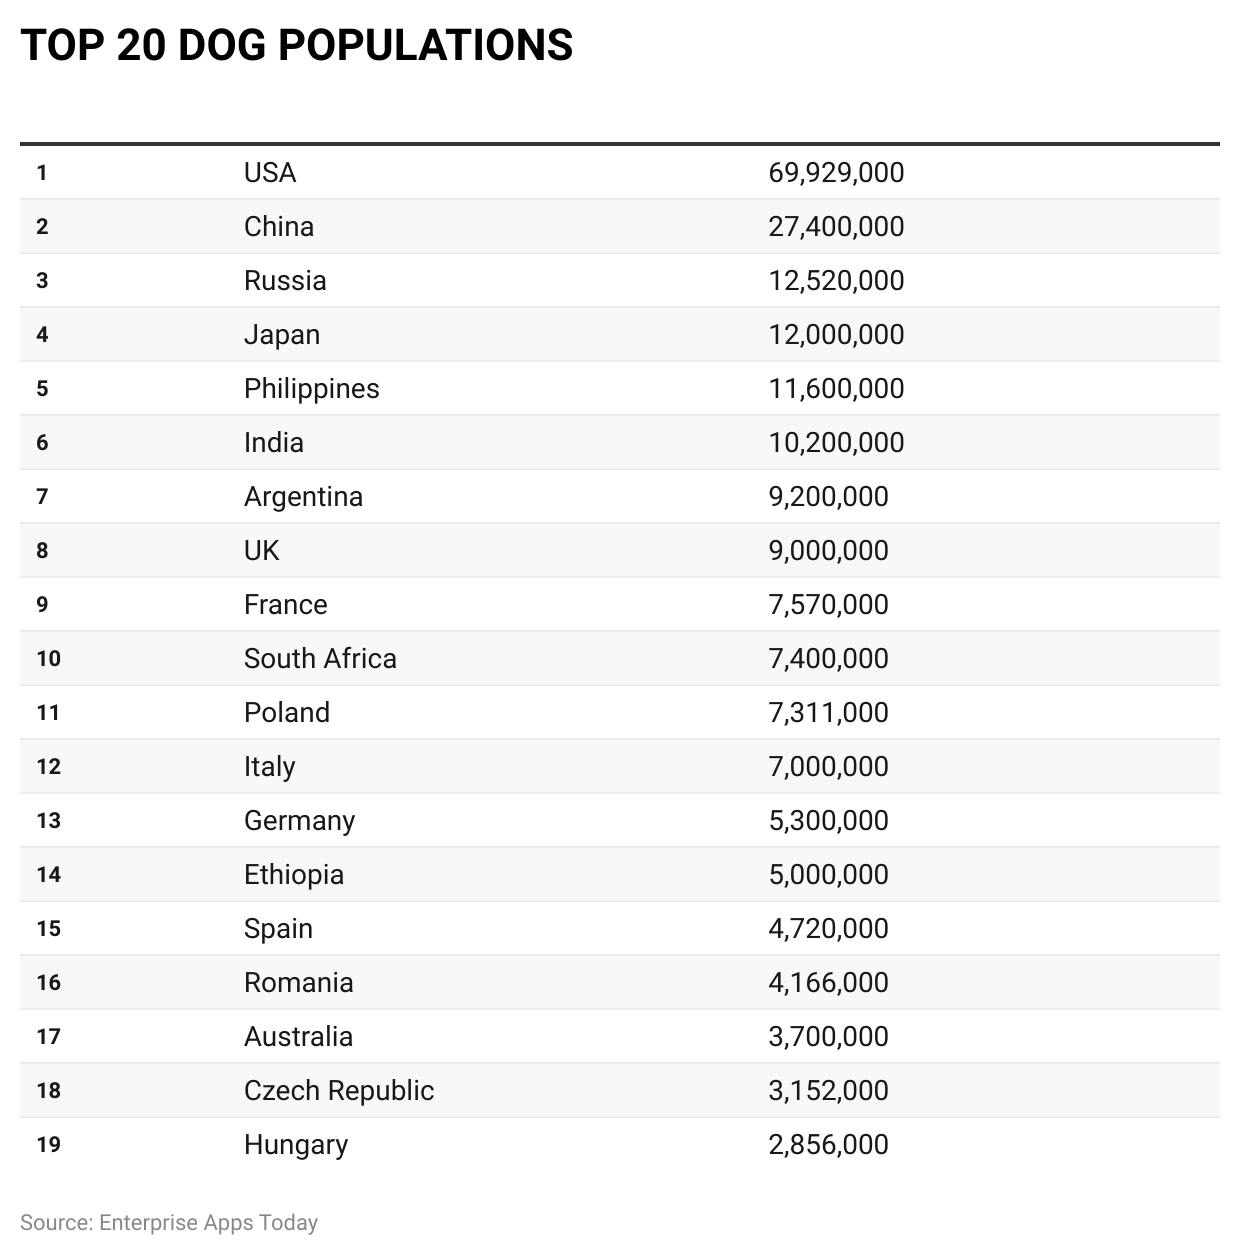
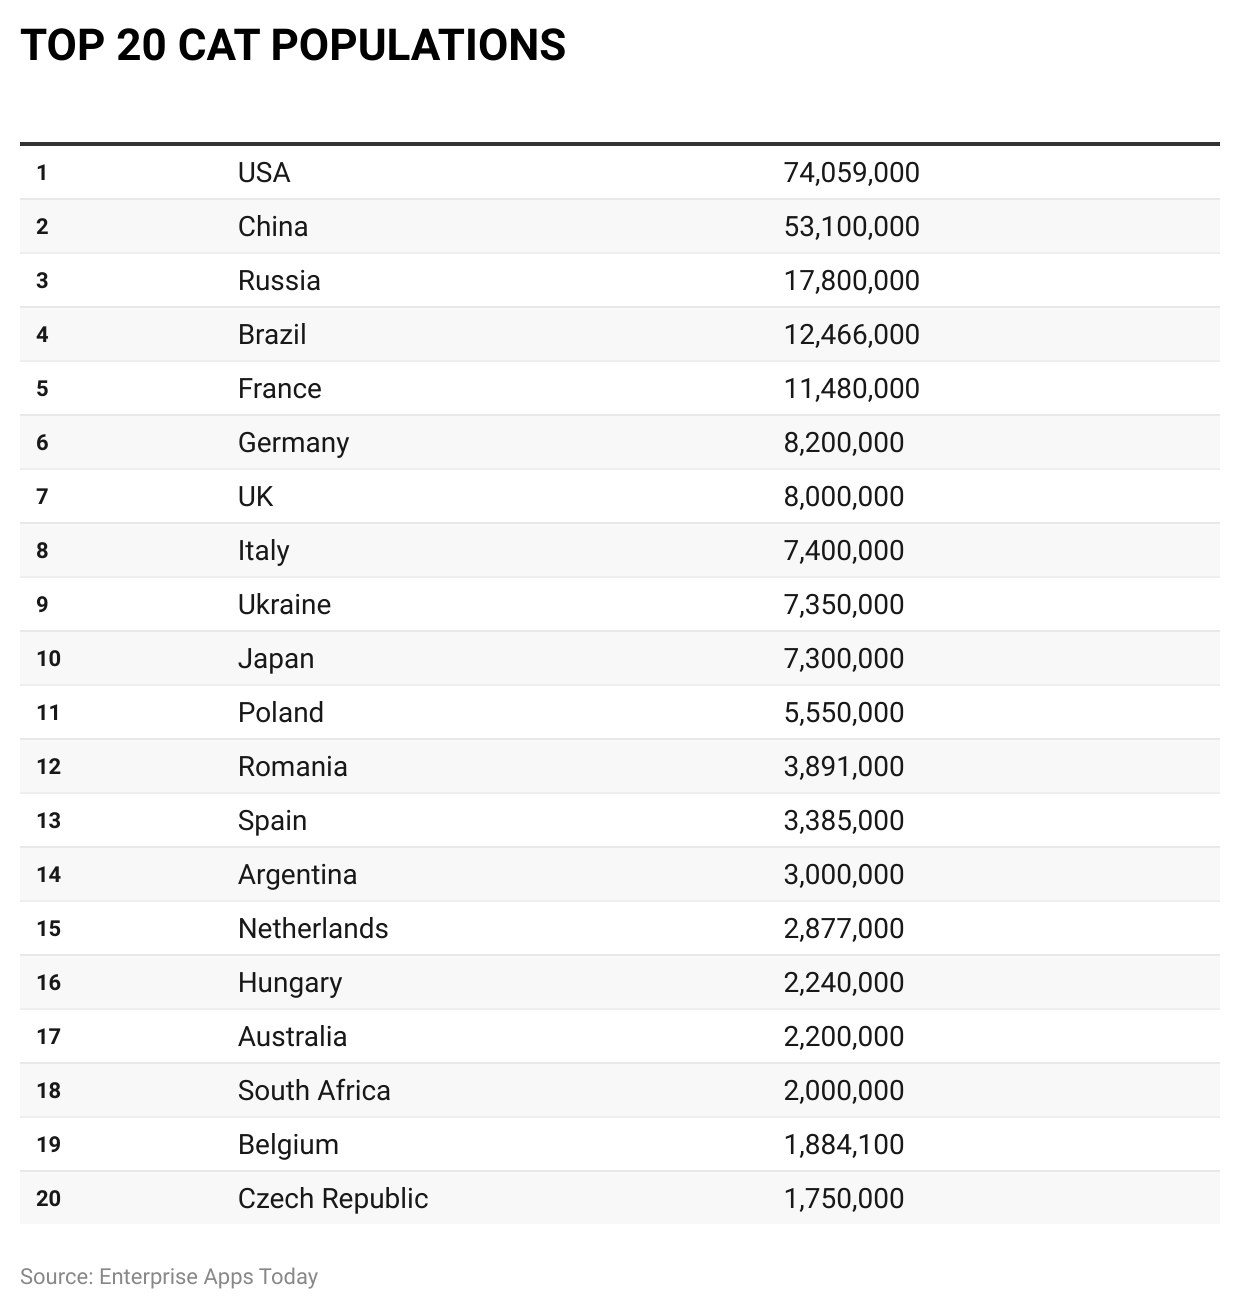
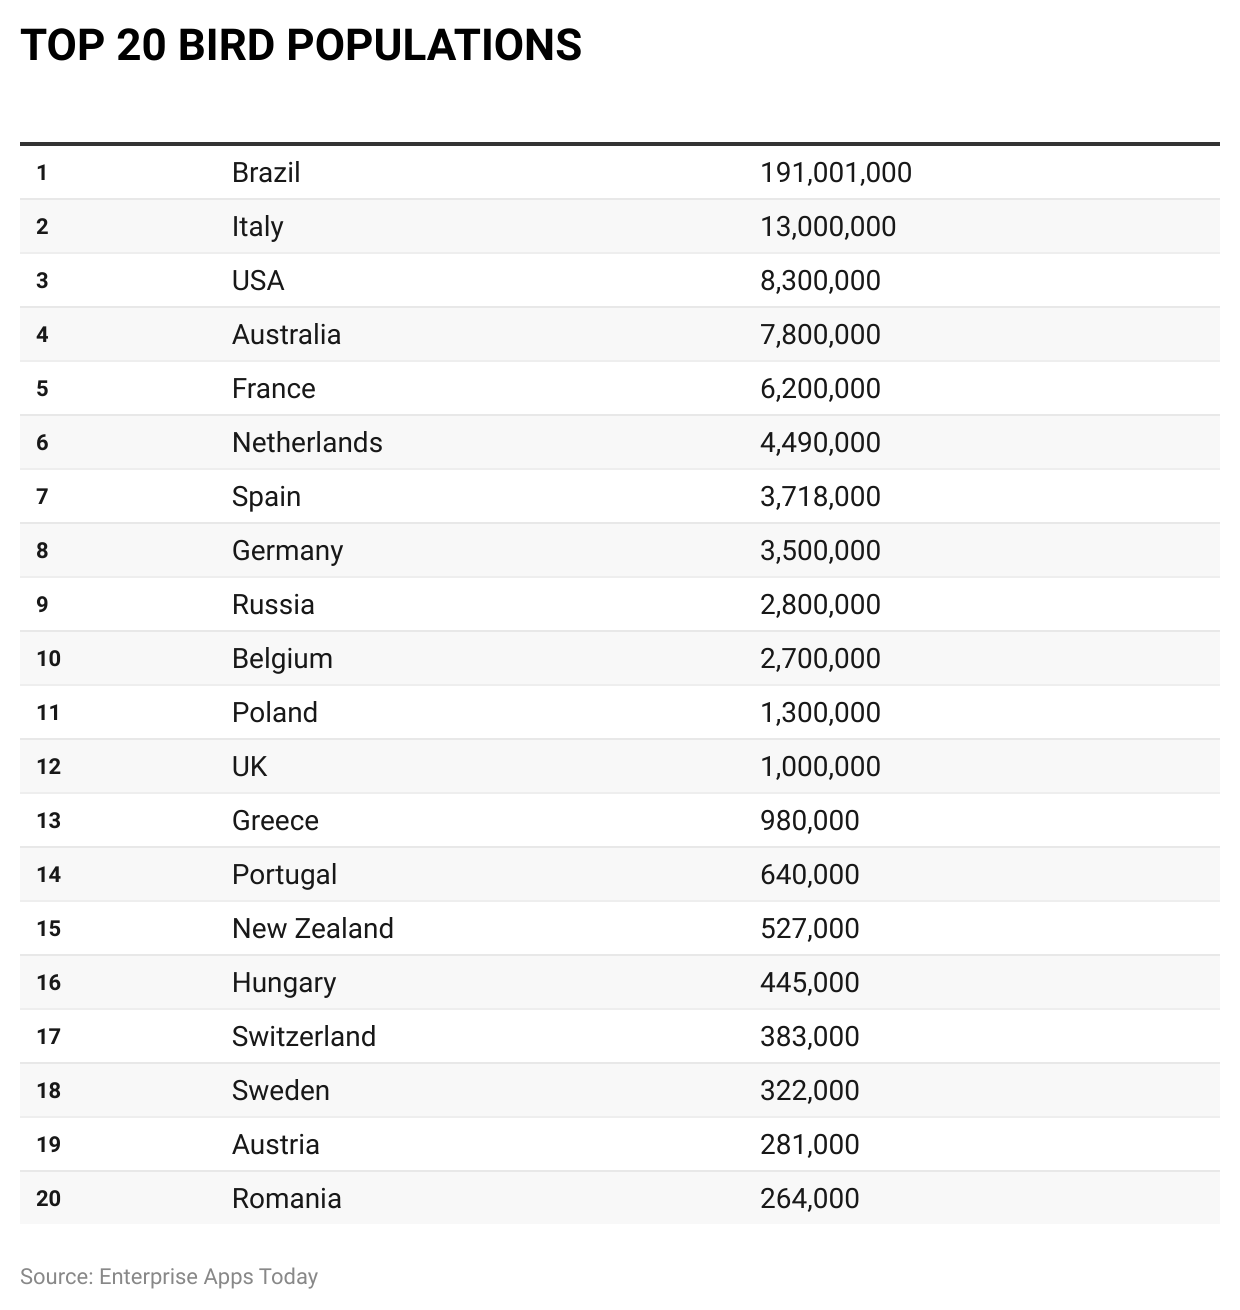
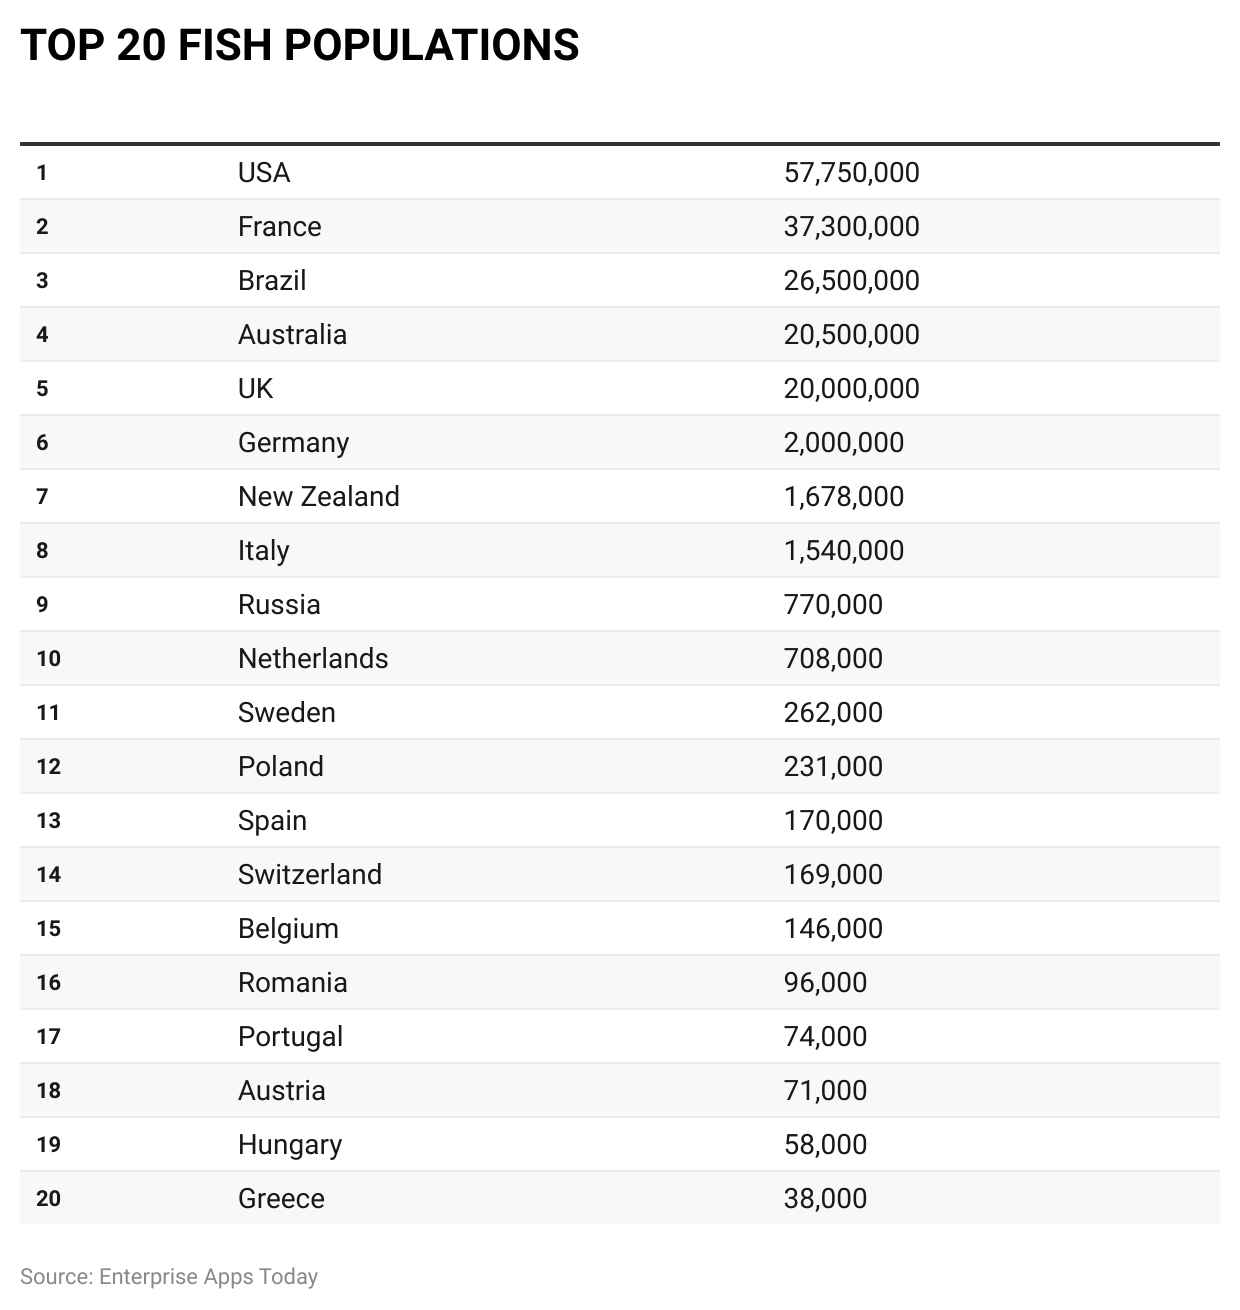
- As per the above chart, the United States of America ranks first place in the list of top 20 dog, cat, and fish populations in terms of owning a pet.
- Whereas China ranks second in the list of the top 20 dog and cat populations.
- Italy has the second rank in the top 20 bird populations and France has the top 20 fish populations rank in second place.
- Similarly, Russia ranks third in the list of top 20 dog and cat populations, whereas in the bird population, the third rank is acquired by the USA, and in the list of fish populations Brazil has grabbed the third place.
By Type
(Reference: Statista)
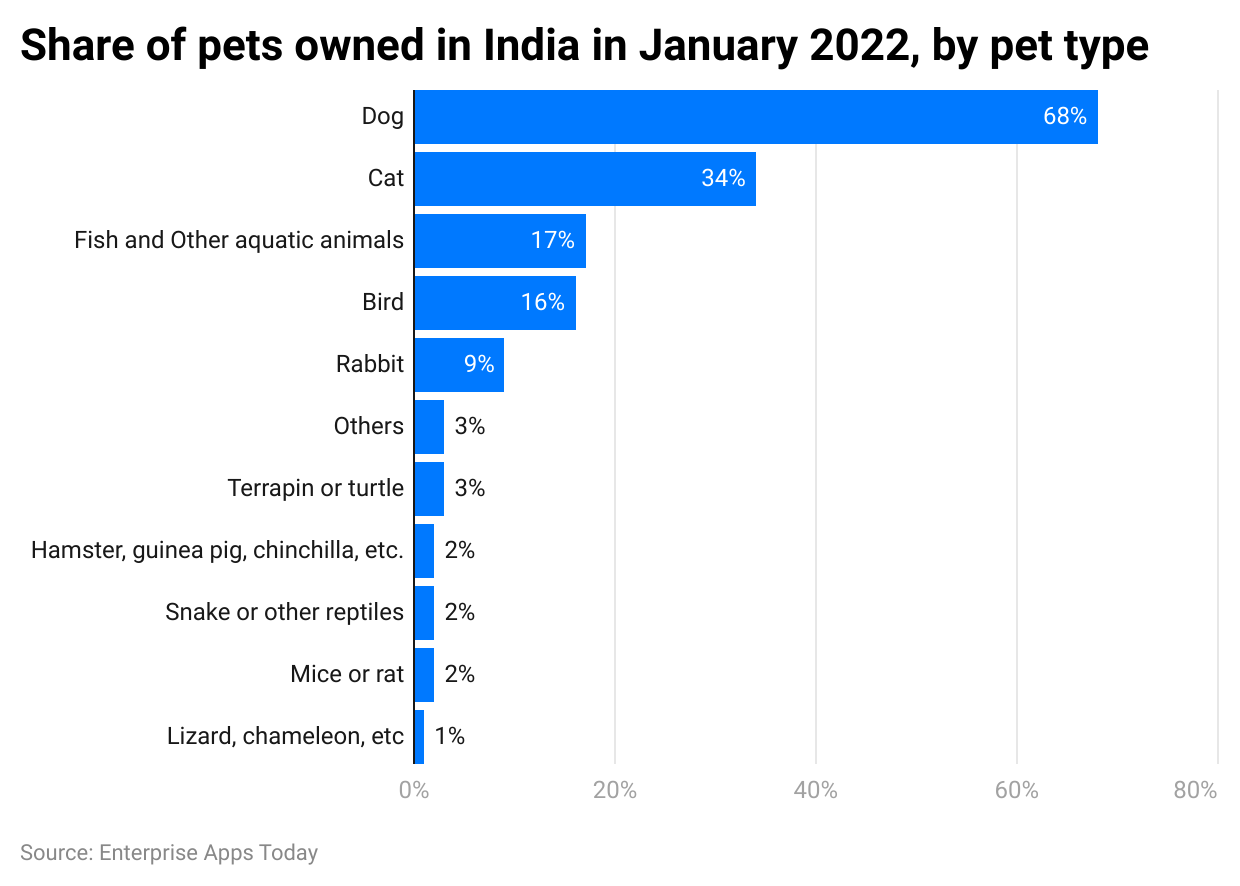
- As of January 2022, India has 68% of its share in owning dogs. There is a 34% share in the ownership of cats according to Pet ownership statistics.
- Other pets share the percentage by Fish or other aquatic animals (17%), Bird (16%), Rabbit (9%), Other types of pet (3%), Terrapin or turtle (3%), Hamster, chinchilla, and guinea pig (2%), Snake or other reptiles (2%), mice or rat (2%), Lizard, chameleon (2%) and insects such as ants, beetles, etc (1%).
- An average freshwater fish owner keeps 12 fish.
 (Reference: TopdogTips)
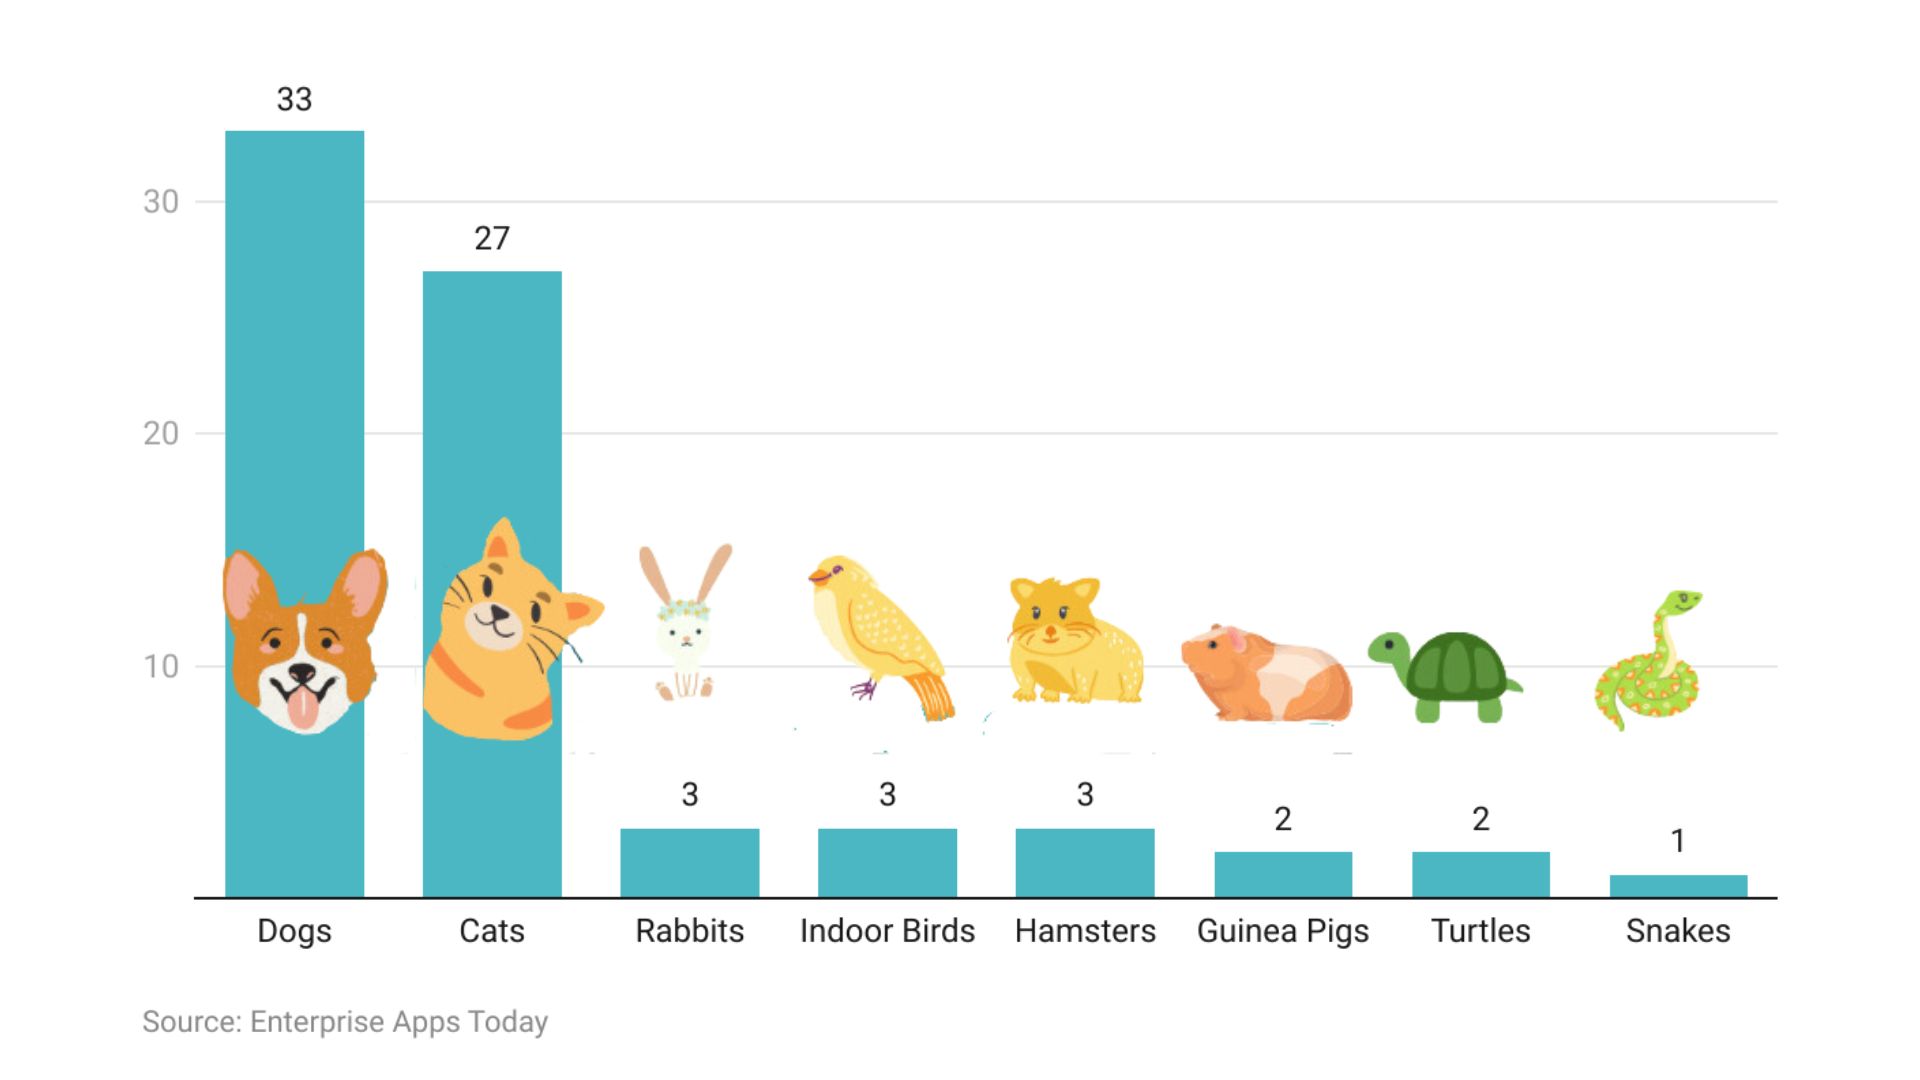
- In the United States of America, 33% are dog owners and 27% are cat owners.
- Rabbits, Indoor birds, and Hamsters are similarly adopted with an overall 3%.
- Guinea Pigs and Turtlers are being adopted by 2% and snakes by 1%.
- Pitbulls and Chihuahuas have the lowest rate of adoption.
- Similarly, as stated by pet ownership statistics, black-colored cats also experience a low level of adoption.
- Ferrets found a home in 3,26,000 households in the United States of America.
- There are 2,49,651,000 pet birds around the world.
- 76% of Aussie dogs and 92% of Aussie cats are mostly kept inside the house.
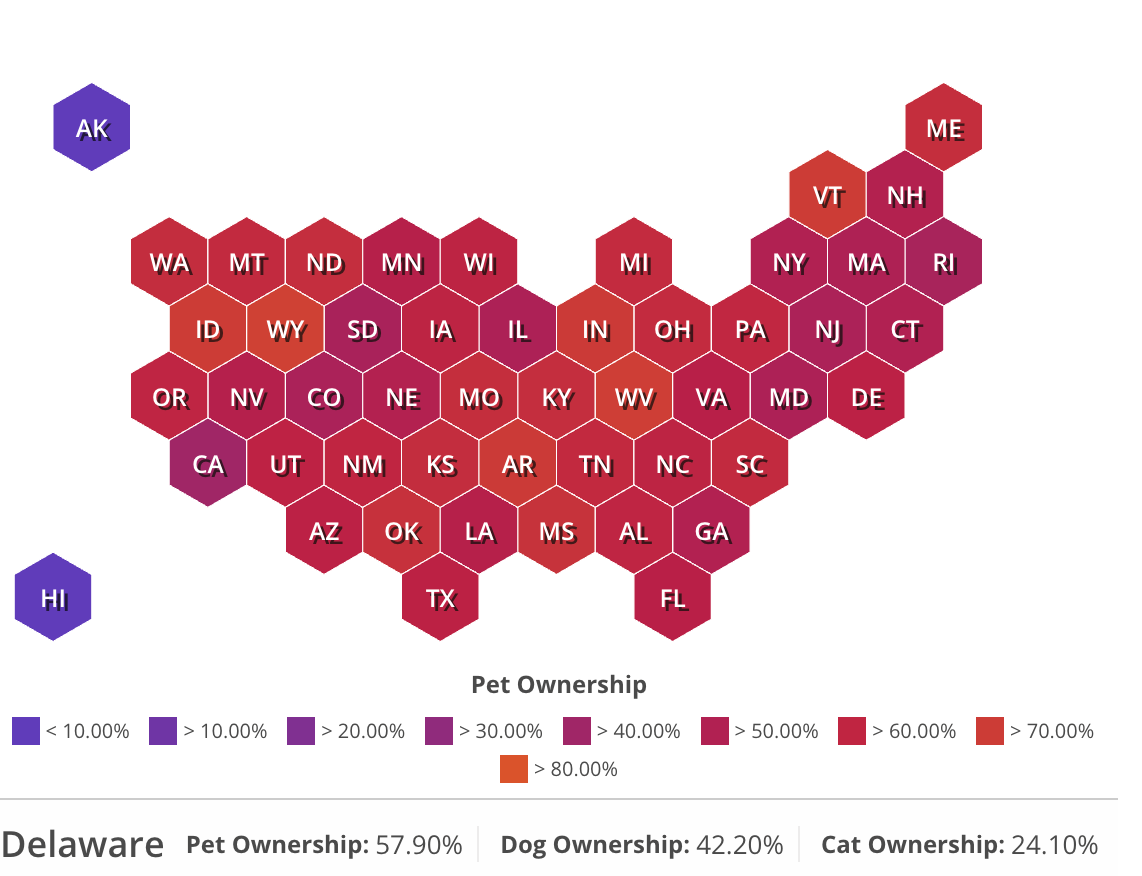
By State
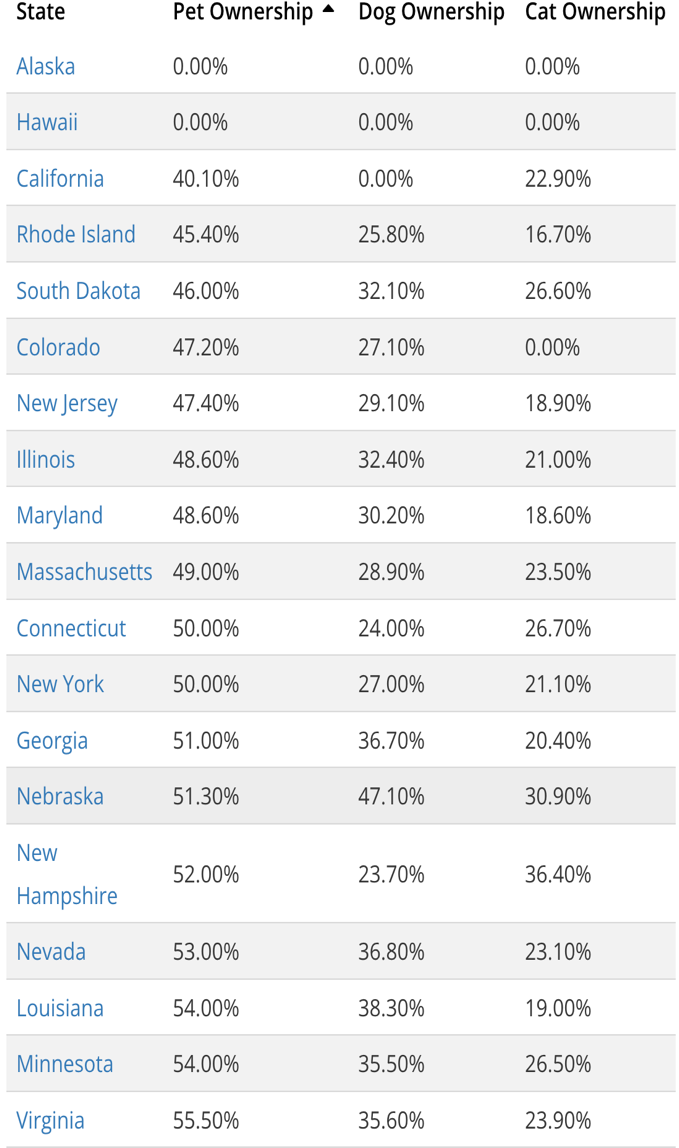
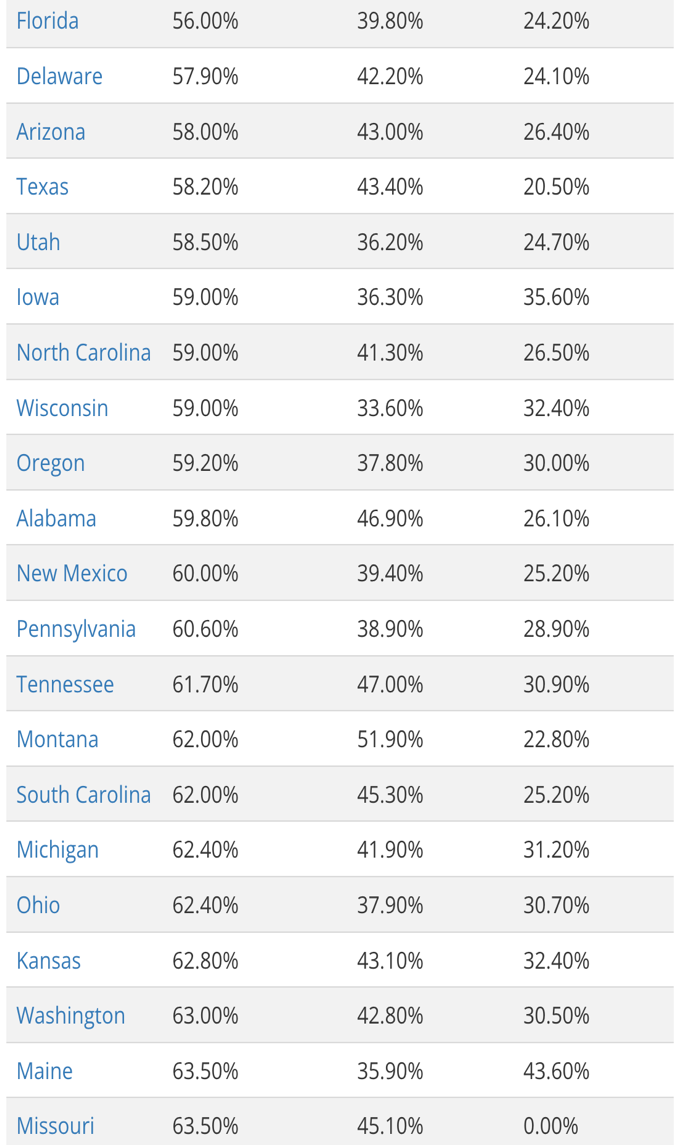
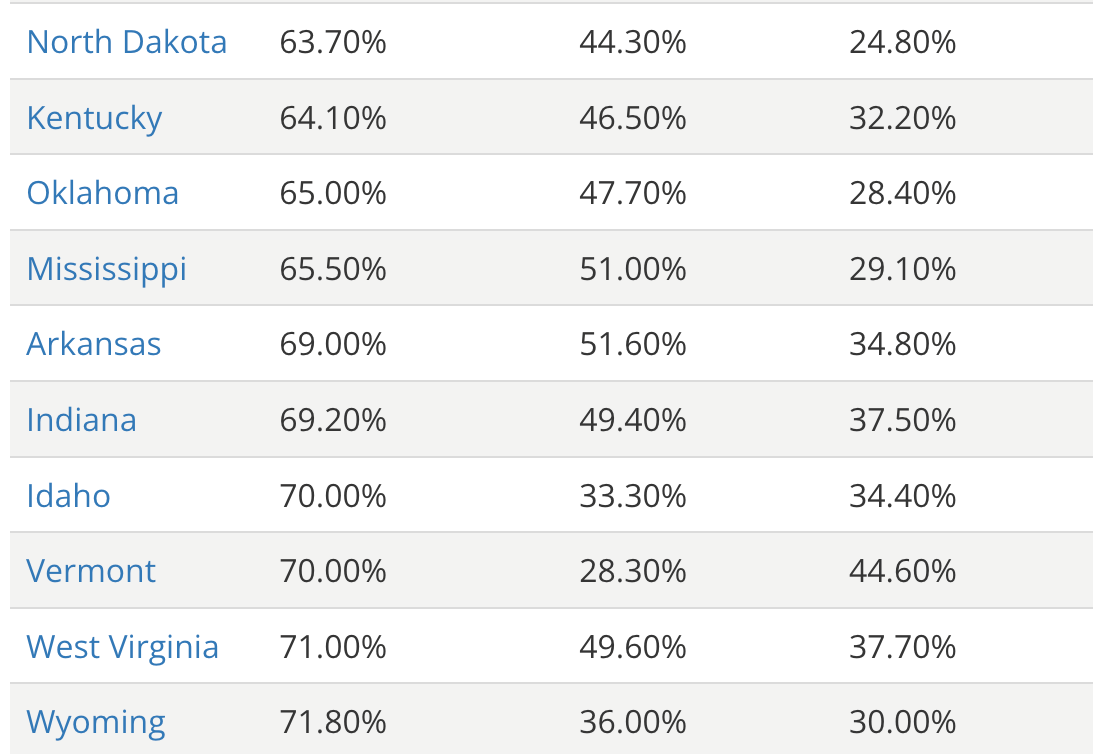
(Reference: World Population Review)
 (source: World Population Review)
- As of 2022, till today there are a total of 57.90% of Pet owners in the United States of America.
- Out of these 42.20% are dog owners and 24.10% are cat owners as stated by Pet Ownership Statistics.
- The top five states in the United States of America that own pets are Wyoming (71.80%), West Virginia (71%), Idaho (70%), Vermont (70%), Indiana (69.20%), Arkansas (69%), Mississippi (65.50%), Oklahoma (65%), Kentucky (64.10%) and North Dakota (63.70%) as stated Pet Ownership Statistics.
- Columbia has the lowest rate of overall pet ownership.
By Demographics
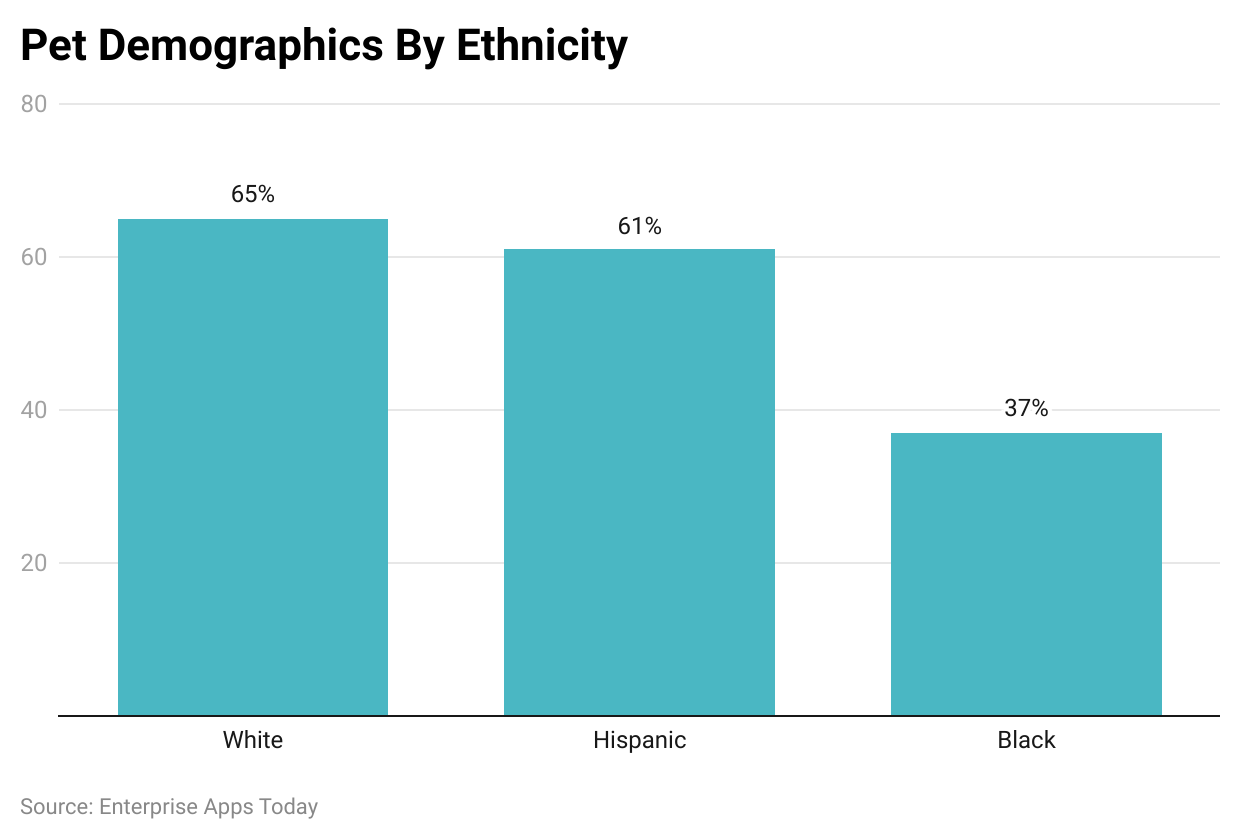
(Reference: TopdogTips)
- There is 64.7% of the people from white households, are pet owners the highest.
- As per Pet Ownership statistics, Hispanics contribute to pet owners around 61.7%, whereas black households contribute around 36.9% being the lowest.
- Moreover, the population in the millennial group is more likely to adopt a pet by 32%.
- People in the baby boomers club are contributing to overall pet adoption by 27%.
- While people from Gen Z and Gen X are adopting pets by 14% and 24% respectively.
Generations of Pet Owners
Pet ownership statistics show that millennials have the highest proportion among pet owners within the U.S:
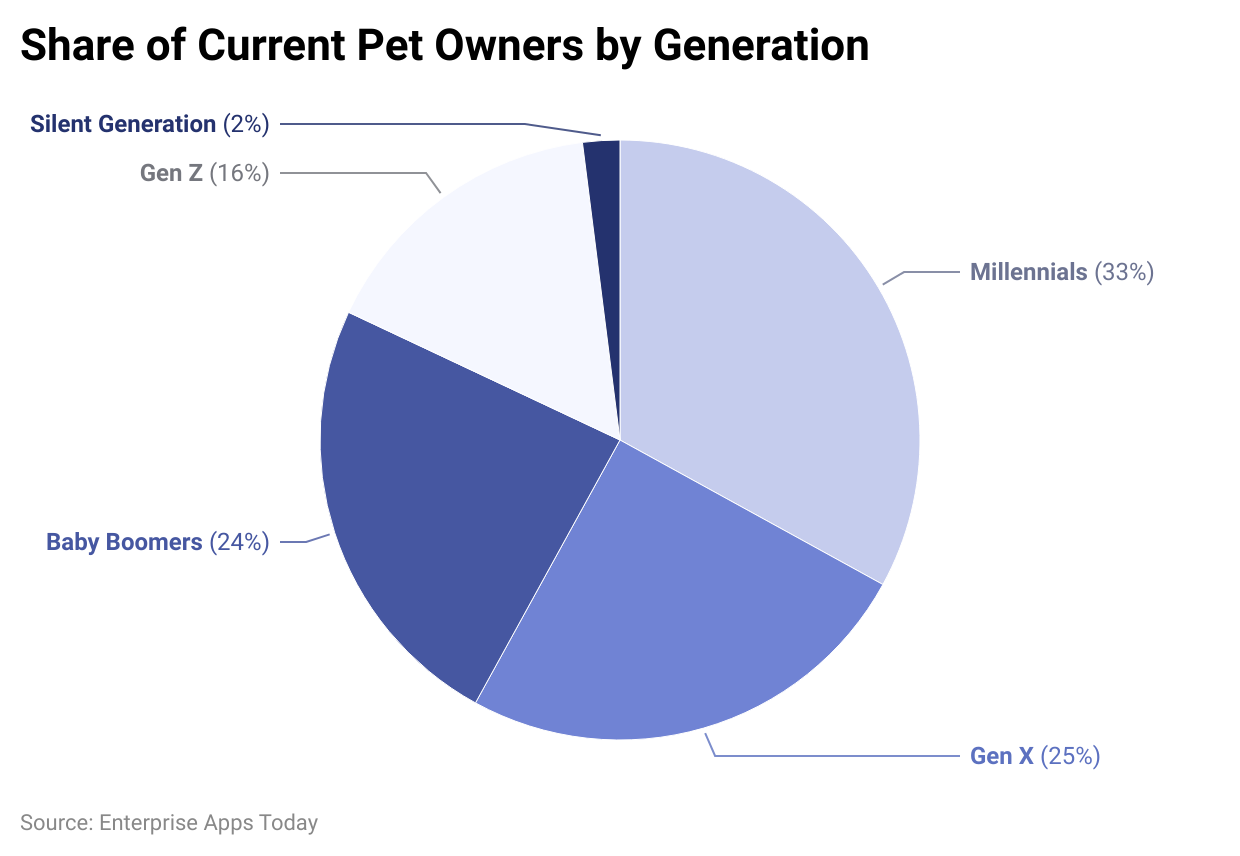
(Reference: Forbes.com)
The millennials comprise the highest portion of pet owners (33 %) then Gen X (25%) and baby boomers (24 %).
Generation Z owners (ages 18-25) are higher than the other groups to have a wide range kinds of pet
Gen pet owners (ages 42-57) are among the most unlikely to have pets other than pets like hamsters, fish, and birds.
Recent Development about Pet Ownership Statistics
- Global Pet Ownership Trends: Recent data suggests a steady increase in pet ownership worldwide, with more households opting to bring animals into their homes for companionship and emotional support.
- Shift towards Adoption: There is a noticeable shift towards pet adoption from animal shelters or rescues, reflecting growing awareness of animal welfare issues and a desire to provide loving homes to pets in need.
- Rise in Pet Expenditure: Pet owners are increasingly willing to invest in their pets' well-being, as evidenced by a rise in pet care expenditure. This includes spending on premium pet food, veterinary care, grooming services, and pet accessories.
- Technological Innovations: The pet industry is witnessing the emergence of innovative technologies aimed at enhancing pet care and owner convenience. This includes smart pet products such as automatic feeders, GPS trackers, and health monitoring devices.
- Growing Importance of Pet Insurance: With rising healthcare costs for pets, there is a growing recognition of the importance of pet insurance among owners. More pet owners are opting to purchase insurance plans to safeguard against unexpected veterinary expenses.
- Impact of the Pandemic: The COVID-19 pandemic has accelerated pet ownership trends, with many individuals turning to pets for companionship and emotional support during periods of isolation and uncertainty.
- Market Opportunities: The pet industry presents lucrative opportunities for businesses involved in pet food manufacturing, veterinary services, pet grooming, pet insurance, and pet technology. Understanding evolving consumer preferences and market trends is key to capitalizing on these opportunities.
Conclusion
The global pet market, valued at USD 261 billion in 2021, is projected to reach USD 350 billion by 2027, reflecting steady growth and ample opportunities for industry stakeholders.
The hashtag adopt and not shop is most important because it is necessary to give homes to stray animals rather than breed animals. In today’s world, rather than having actual babies as kids, people are adopting a pet as their child, isn’t that surprising?
Despite rising expenditures, only 2% of pet owners in the U.S. have pet insurance, highlighting a gap in coverage and potential for growth in this sector.
Pet owners in the U.S. spent $136.8 billion on their pets in 2022, underscoring the significant financial commitment associated with pet care.
Sources
FAQ.
Owning a pet may cost around $125 to $824 every month depending on the type of pet.
A microchip is an implanted chip under the dog or any other pet which provides information on the ownership details if the pet is lost. The process of microchipping can be performed by certified veterinary persons. It is a painless procedure and is recommended to perform on pets to keep them safe.
Owning a pet gives a sense of companionship, therefore the percentage of loneliness reduces. Playing with pets lets humans have physical activities, therefore keeping the overall body healthy.
Please always consider adopting as stray animals also need forever homes.

Barry is a lover of everything technology. Figuring out how the software works and creating content to shed more light on the value it offers users is his favorite pastime. When not evaluating apps or programs, he's busy trying out new healthy recipes, doing yoga, meditating, or taking nature walks with his little one.