
Christmas Spending Statistics – By Demographic, Platform, Type of Gifts, Shopping Method, Average Numbers

Page Contents
- Introduction
- Editor’s choice
- General Christmas Spending Statistics
- Christmas Spending Statistics by platform
- Christmas Spending Statistics by demographic
- Which parts of the world wait for Christmas?
- Christmas Spending Statistics by Type of Gifts
- Christmas Spending Statistics by shopping Method
- Christmas Spending Statistics by Average total spending in Countries
- Christmas Spending Statistics by average numbers
- Christmas Spending Statistics by reasons to purchase gifts early
- Christmas Spending Statistics by the Method of Borrowing Money
- Christmas Spending Statistics by gifts
- What does Christmas Spending Statistics say more?
- Conclusion
Introduction
Christmas Spending Statistics: Everyone's favorite season, Christmas occurs every year and enlightens the heart of families and friends. Just by the tradition of gifting, people are spending way more than expected every year. The global Christmas decorations and lights market is expected to grow at a CAGR of 9.6% by the year 2027. Nowadays, not only in other countries but worldwide Christmas is observed.
These Christmas Spending Statistics took into consideration insights from 2022 by segmentations of various aspects of spending habits of shoppers in the United States of America.
Editor’s choice
- As of 2022, the total spending on gift shopping in the United States of America was projected to reach $178 billion.
- 81% of the shoppers in the US will research products online before purchasing in stores.
- According to Christmas Spending Statistics of 2022, 20% of the shoppers used Buy Now, Pay later option (BNPL).
- In the year 2022, 72% of shoppers said, they used credit cards to shop during Christmas resulting in $103 billion in credit card purchases.
- Due to inflation in 2022, 79% of Amazon Prime early access sale members purchased on other platforms than Amazon.
- 46% of the gift receivers lie about liking the gift they have received.
- Men are 10% more likely to spend than women. On average, men spend $94 on holiday purchases.
- 1 out of 18 shoppers, resulting in 12% of residents in the United States of America waiting until mid-week of December to begin shopping.
- 2% of women love to have credit for the shops they love, while 35.8% of women love handmade gifts.
- It was estimated that Christmas Spending in 2022 would make up 18.4% of total US holiday retail sales.
- According to Christmas Spending Statistics, 30% of people travel globally.
General Christmas Spending Statistics
- 34% of the shoppers in the United States of America, during Christmas, believe that this year (2023), they are more likely to go into debt than the previous year (2022).
- 29% of the shoppers in the United States of America said they would be buying gifts on sale only.
- In the year 2022, 72% of shoppers said, they used credit cards to shop during Christmas resulting in $103 billion in credit card purchases.
- 15% of Americans believe that they need more savings to purchase all the holiday gifts.
- It was estimated that Christmas Spending in 2022 would make up 18.4% of total US holiday retail sales.
- On Amazon, during Christmas, more than 100 million items were sold.
- As of 2022, Christmas Spending Statistics state that $932 is the average spending on holiday shopping.
- As of 2022, the total spending on gift shopping in the United States of America was projected to reach $178 billion.
- 40% of the Christmas sales happen between the 15th to 24th
- 65% of Christmas Spending is contributed by presents.
- In the United States of America, gift cards contribute to around 1 out of 5 gift spending habits.
- 81% of the shoppers in the US will research products online before purchasing in stores.
- On the other hand, 87% of the residents in the US do online shopping during Christmas.
- Men are 10% more likely to spend than women. On average, men spend $94 on holiday purchases.
- 43% of the population in the United States of America starts holiday shopping by the end of October.
- 1% of the population do Christmas shopping in the month of January.
- On the other hand, 1 out of 18 shoppers, resulting in 12% of residents in the United States of America waiting until mid-week of December to begin shopping.
- According to Christmas Spending Statistics, 1 out of 5 Americans go into debt after spending on holiday shopping.
- According to Holiday Spending Statistics, friends have been voted the worst gift-givers for unwanted gifts.
- Every year, $15.2 billion is the estimated total allocated to unwanted gifts.
- In the United States of America, it has been observed that around 61% of people receive unwanted gifts resulting in 154 million gift-takers.
- The biggest expenses for any individual stated are gifts for family members followed by food and decorations.
- Around 61% of Americans disclose their personal information to get special deals on gifts.
- 2% of residents in the United States of America sell their possessions to gain money for Christmas Spending.
- 66% of holiday shoppers are more likely to pay extra for sustainable products, resulting in 2 out of 3 people.
- 51% of the people buy gifts for themselves.
- Furthermore, Christmas Spending Statistics state that 19% of Americans spend money on unplanned purchases.
- 5% of American spend above $300 on Christmas gifts for spouses.
- On the other hand, 35.3% do not buy any gifts for their friends.
- 23% of the shoppers in the United States of America, review products on social media before shopping.
- 5% of men feel unloved or ignored if no gifts are received for Christmas.
- 4% of women prefer jewelry for Christmas.
- On the other hand, 42.2% of women love to have credit for the shops they love, while 35.8% of women love handmade gifts.
- 46% of the gift receivers lie about liking the gift they have received.
- Women are more likely to lie than men resulting in 51.4% to 35.5%.
- Around 49% of Americans don’t buy Christmas decorations.
- In the United States of America, the YoY growth of Christmas holiday retail sales is 6%.
- According to the Christmas Spending Statistics, in the United States of America, the overall budget is spread as food and drinks (27.5%), gifts (37.8%), decorations (15.6%), Charity (10.6%), and Transportation (12.6%).
Christmas Spending Statistics by platform
- Due to inflation in 2022, 79% of Amazon prime early access sale members purchased on other platforms than Amazon.
- On the other hand, 31% of Amazon prime members already purchased half of the gifts they wanted to buy.
- 93% of the shoppers in the United States of America planned to purchase gifts on Amazon.
- According to Christmas Spending Statistics of 2022, 20% of the shoppers used Buy Now, Pay later option (BNPL).
Christmas Spending Statistics by demographic
- Around 49% of people aged 65 years and above buy Christmas decorations.
- On the other hand, there are 73% to 80% of people aged below 55 years purchase decorations.
- 24% of millennial online shoppers in the United States of America, expect delivery of the purchased items within 24 hours or less.
- On average, women spend around 20 hours on Christmas shopping.
- 3% of men prefer gift vouchers to gifts.
By Generation
| Generation | Planned holiday gift spending |
|---|---|
| Gen Z | $558 |
| Millennials | $855 |
| Gen X | $832 |
| Baby Boomers | $769 |
(Source: zippia.com)
- According to Christmas Spending Statistics, millennials spend more than any other generation resulting in $855 on average.
- Further, Gen X follows the spending habit of an average amount of $832.
- Baby Boomers spend on Holiday shopping $769, and Gen Z spends around $558.
By Age
| Age Group | Spend |
|---|---|
| 18-24 | $649.81 |
| 25-34 | $888.98 |
| 35-44 | $1,083.74 |
| 45-54 | $1,161.98 |
| 55-64 | $999.22 |
| 65+ | $1,077.41 |
(Source: explodingtopics.com)
- The average Christmas Spending statistics state that shoppers aged between 45 years to 54 years spend around $1,161.98 on gifts.
- Furthermore, people aged between 35 to 44 years spend on average $1,083.74, followed by shoppers aged 65 years and above resulting in $1,077.41.
- $999.22 are spent by shoppers aged between 55 to 64 years.
- Furthermore, people aged between 25 to 34 years and 18 to 24 years spend on average $888.98 and 649.81 respectively.
By Budget for a child
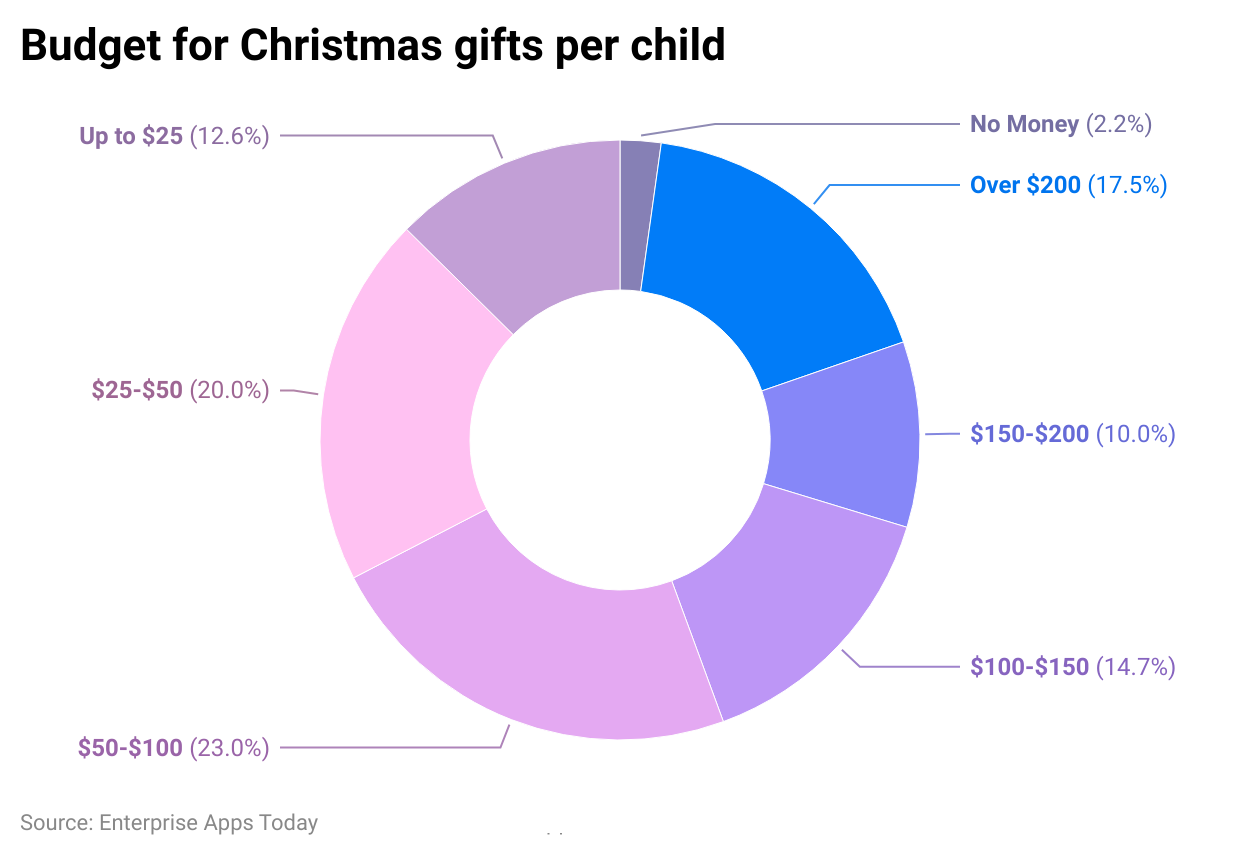
(Reference: headphonesaddict.com)
- According to the Christmas Spending Statistics, on average the budget for 23% of families with a single child in the United States of America is $50 to $100.
- 20% of American families have a budget for Holiday spending between $25 to $50, whereas 14.7% of families kept their budget between $100 to $150 per child.
- 6% of families and 10% of families have a budget range of up to 25$ and $150 to $200 respectively.
- 5% of families kept their Christmas spending budget at more than $200.
- On the other hand, 2.2% of American families said, they don’t have money and therefore don’t have the budget.
Which parts of the world wait for Christmas?
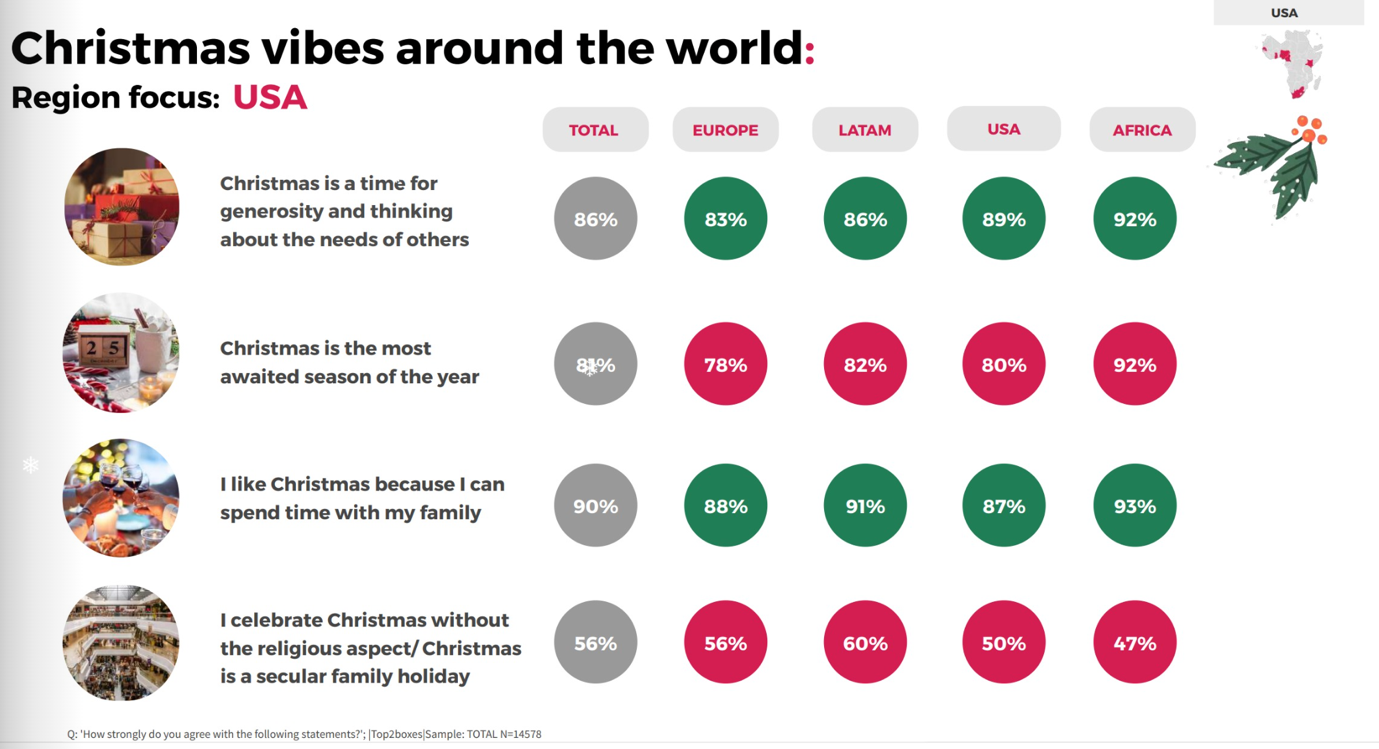
(Source: tgmresearch.com)
Christmas Spending Statistics by Type of Gifts
For themselves
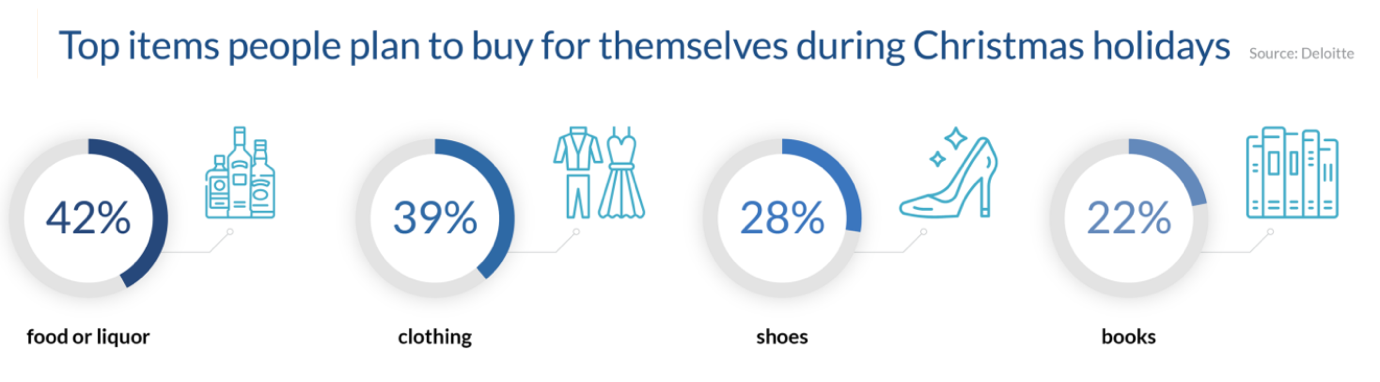
(Source: financesonline.com)
- In the United States of America, majority of the people buy themselves a gift during Christmas.
- 42% of them love to purchase food articles or liquor, while 39% go for clothing.
- 28% of the people purchase shoes and 22% of the people buy themselves a variety of books to read.
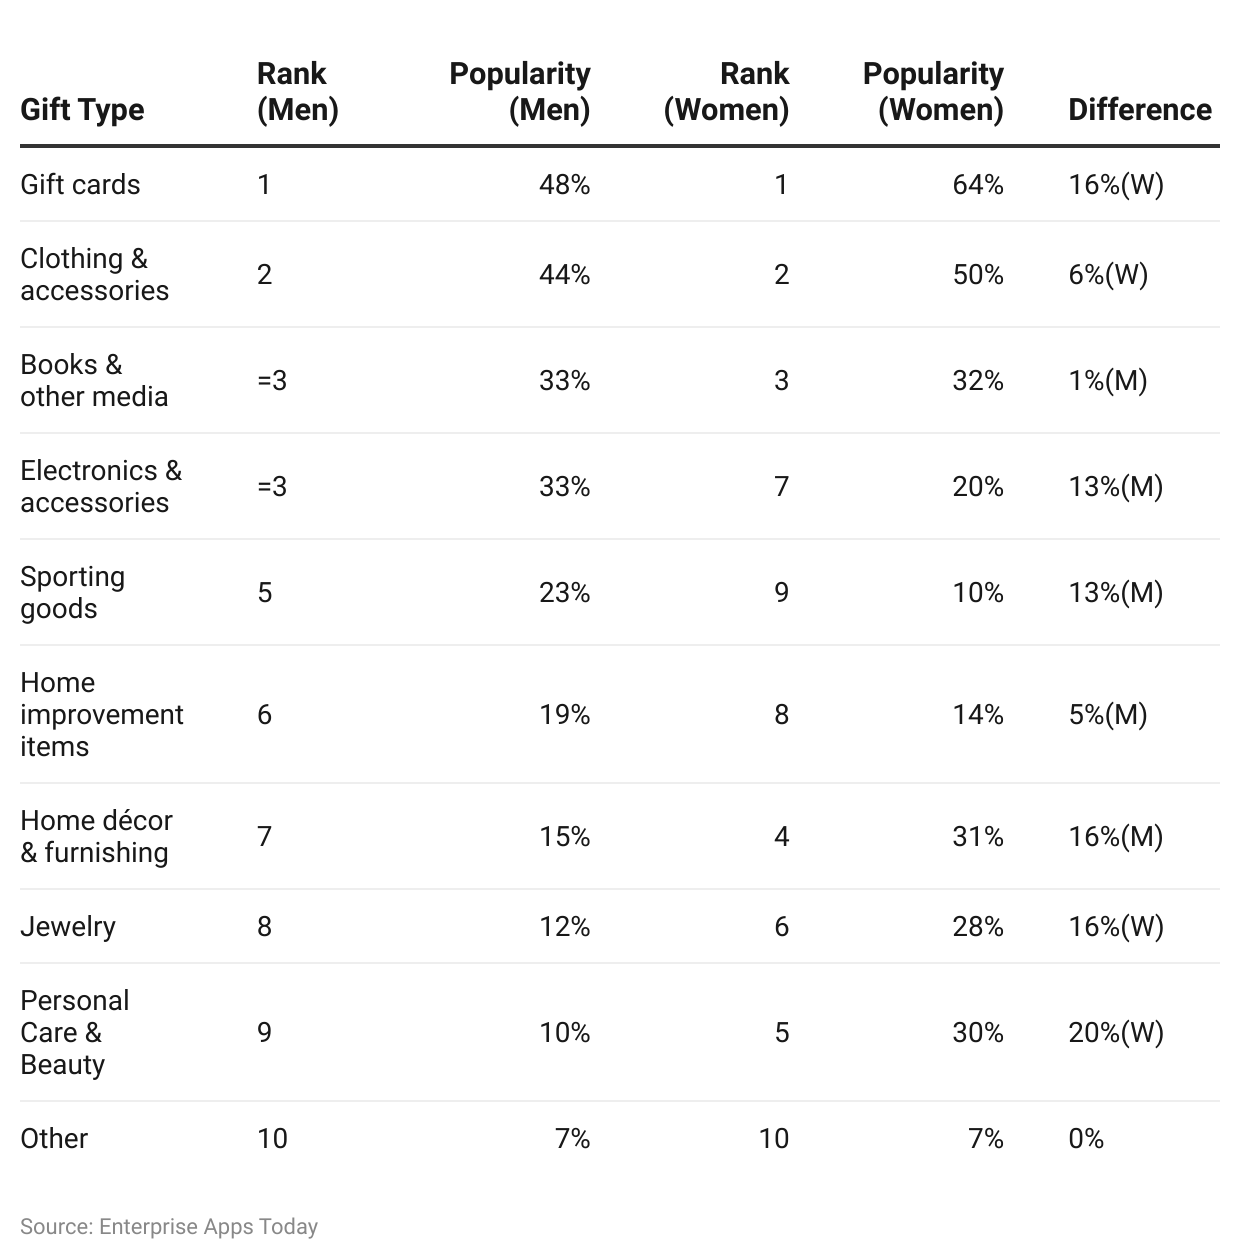
(Reference: explodingtopics.com)
- According to the Christmas Spending Statistics, the above chart shows distinctive figures between the shopping trends between men and women.
- On the other hand, the top 3 types of gifts preferred by both genders are gift cards, clothing and accessories and books, and other media.
- The least preferred gift by men is personal care and beauty products while the least wanted gift by women is sporting goods.
- The most commonly wanted gift by both genders is books and other media.
Christmas Spending Statistics by shopping Method
(Reference: explodingtopics.com)
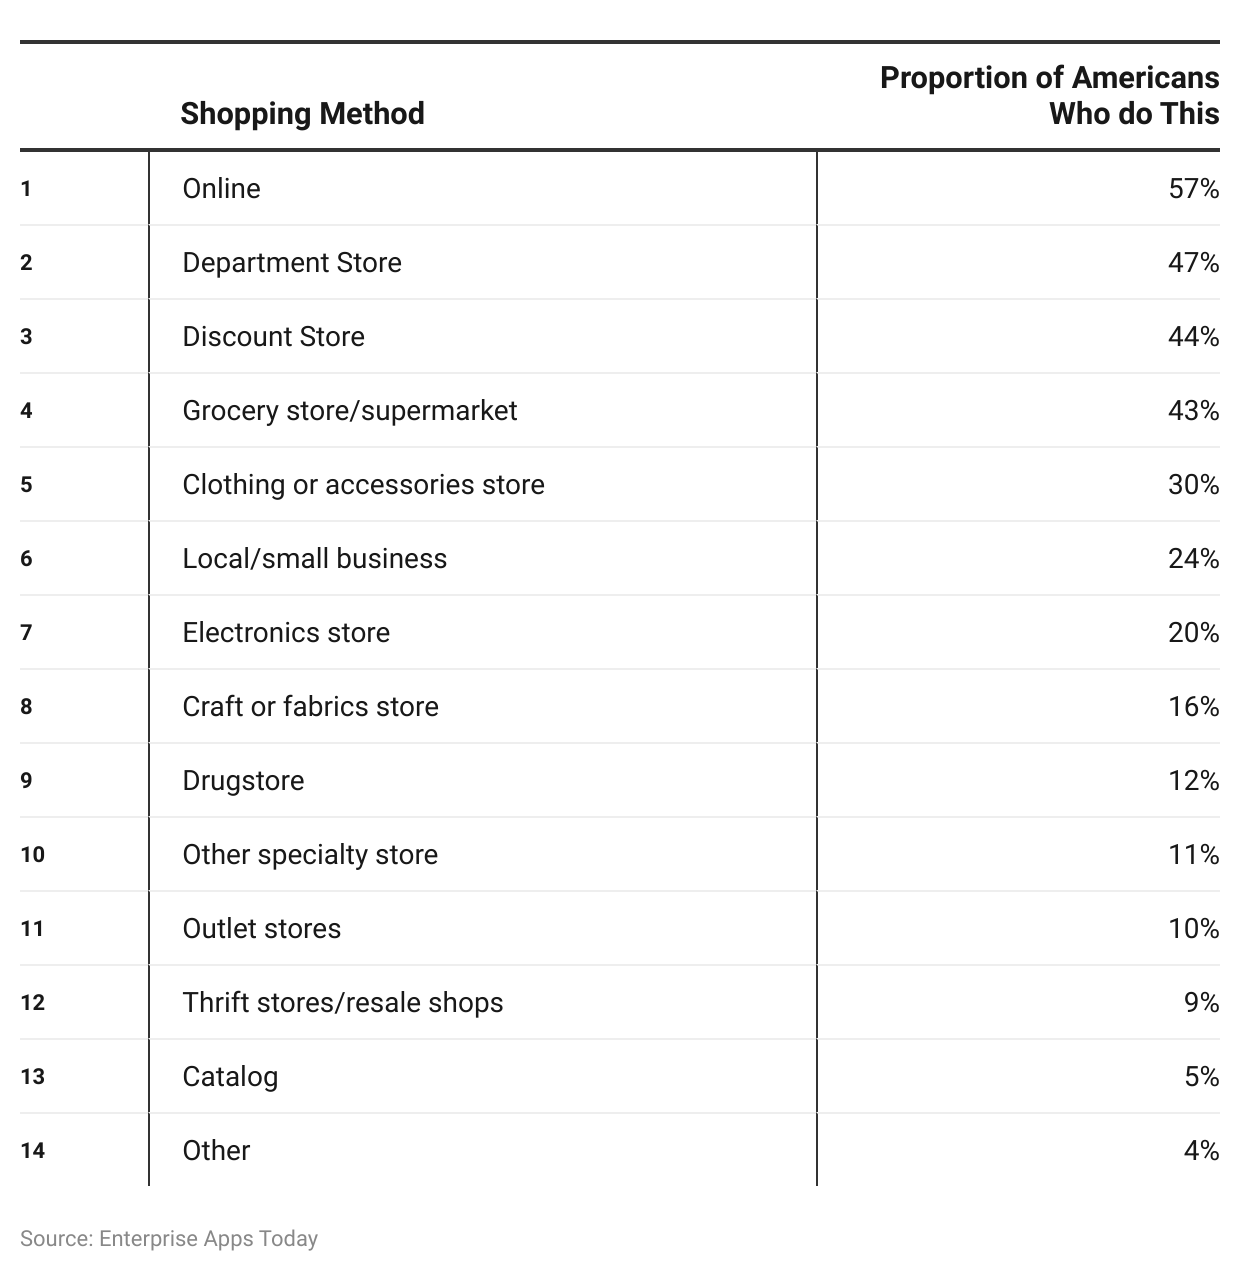
- As of 2022, the top three locations to shop for Christmas gifts are online (57%), by going into a department store (47%), and by going to a discount store (44%).
- Other methods to shop during the Holiday season in the United States of America include Grocery stores/Supermarkets (43%), Clothing or accessories (30%), Local or small businesses (24%), electronics stores (20%), Crafts or fabrics store (16%), Drugstore (12%), Other specialty stores (11%), Outlet stores (10%), Thrift stores/ Resale shops (9%). Catalog (5%) and other (4%).
Christmas Spending Statistics by Average total spending in Countries
(Reference: explodingtopics.com)
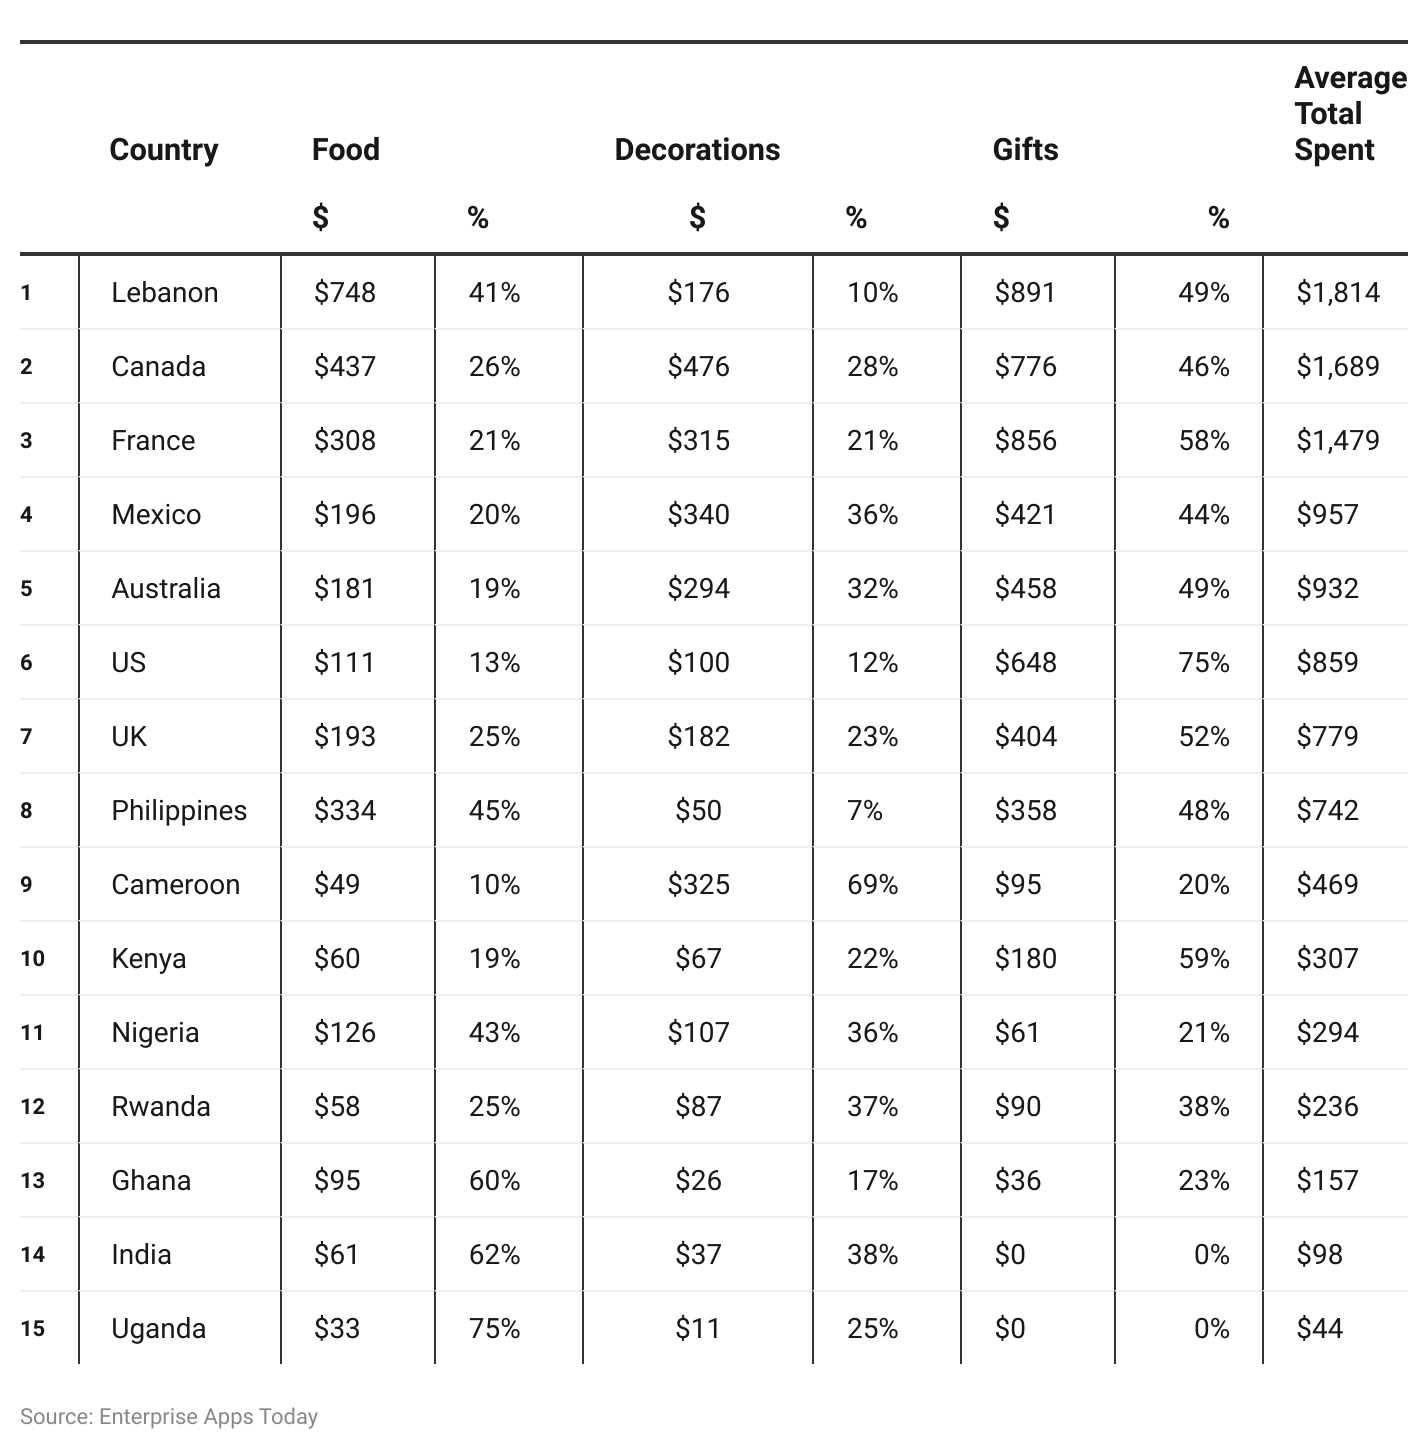
- The above chart explains in detail the variety of average total spending according to the country during the Christmas season.
Christmas Spending Statistics by average numbers
By average spent on gifts
(Source: explodingtopics.com)
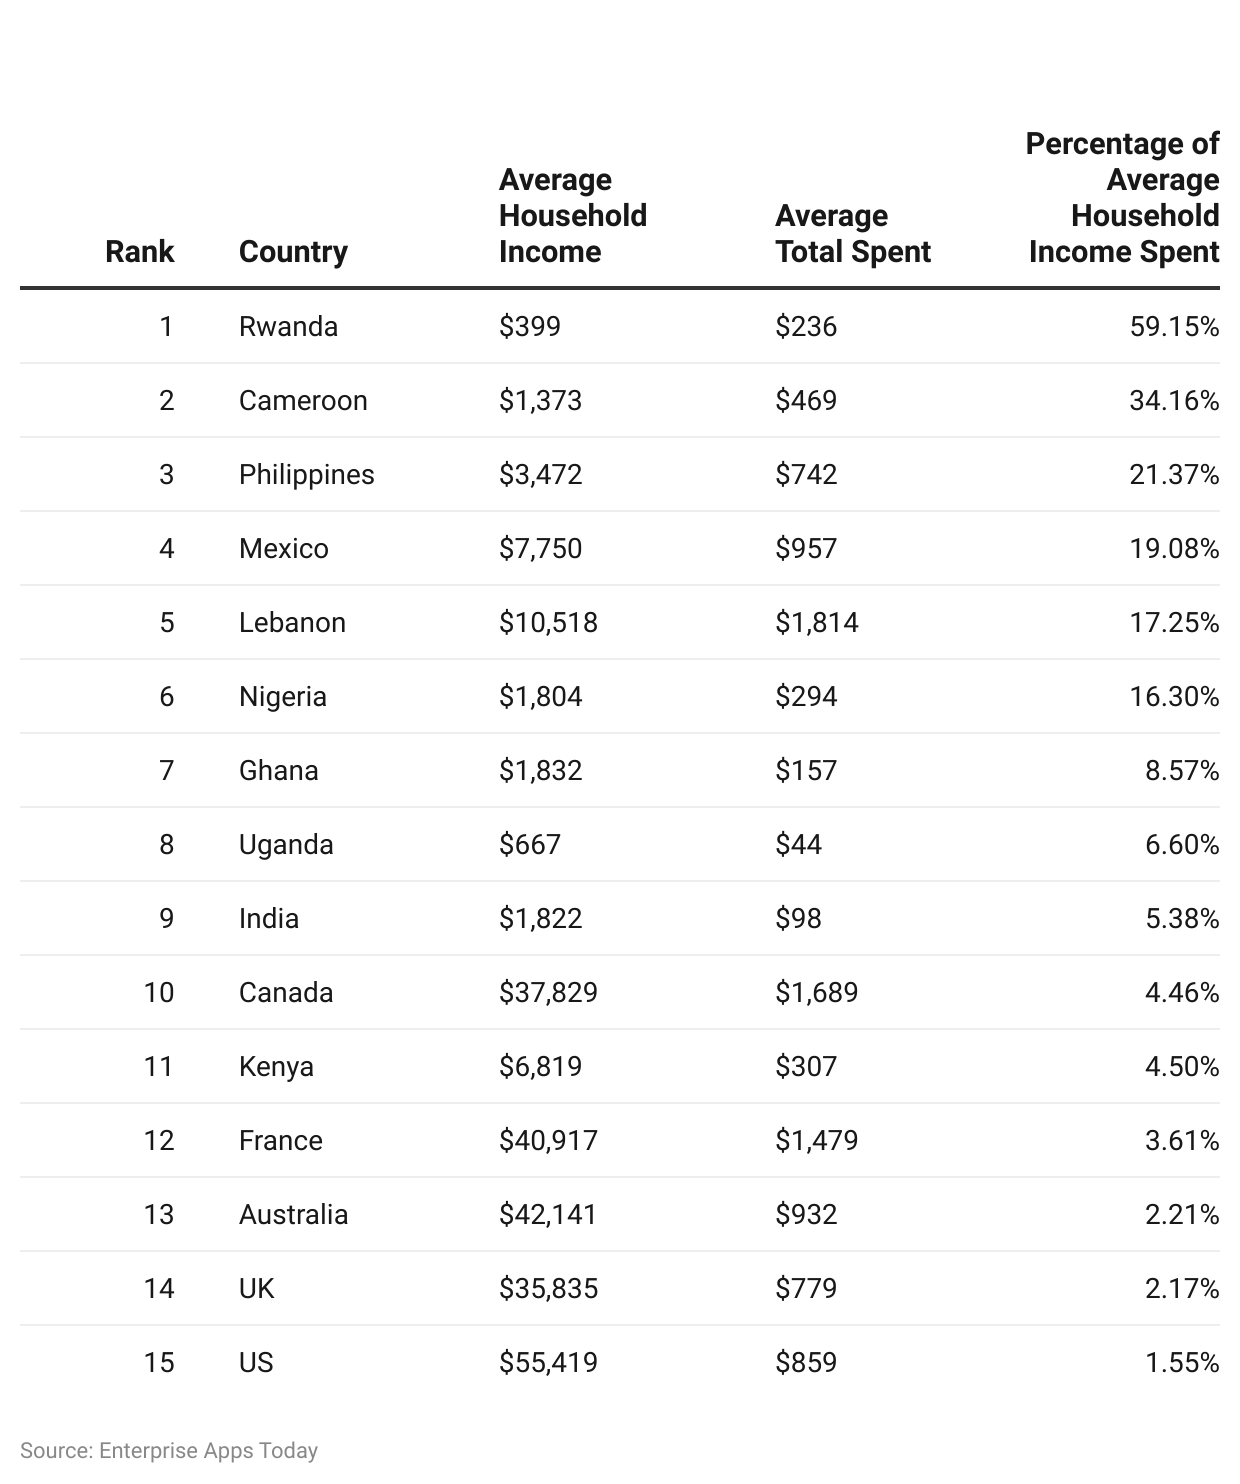
The above chart explains the average spending during Christmas as compared to the average annual household income. The top three countries with the maximum average household income spent are Rwanda, Cameroon, and the Philippines. While Australia, the United Kingdom, and the United States of America seem to save more of their household income.
By average Spent per person
(Reference: headphonesaddict.com)
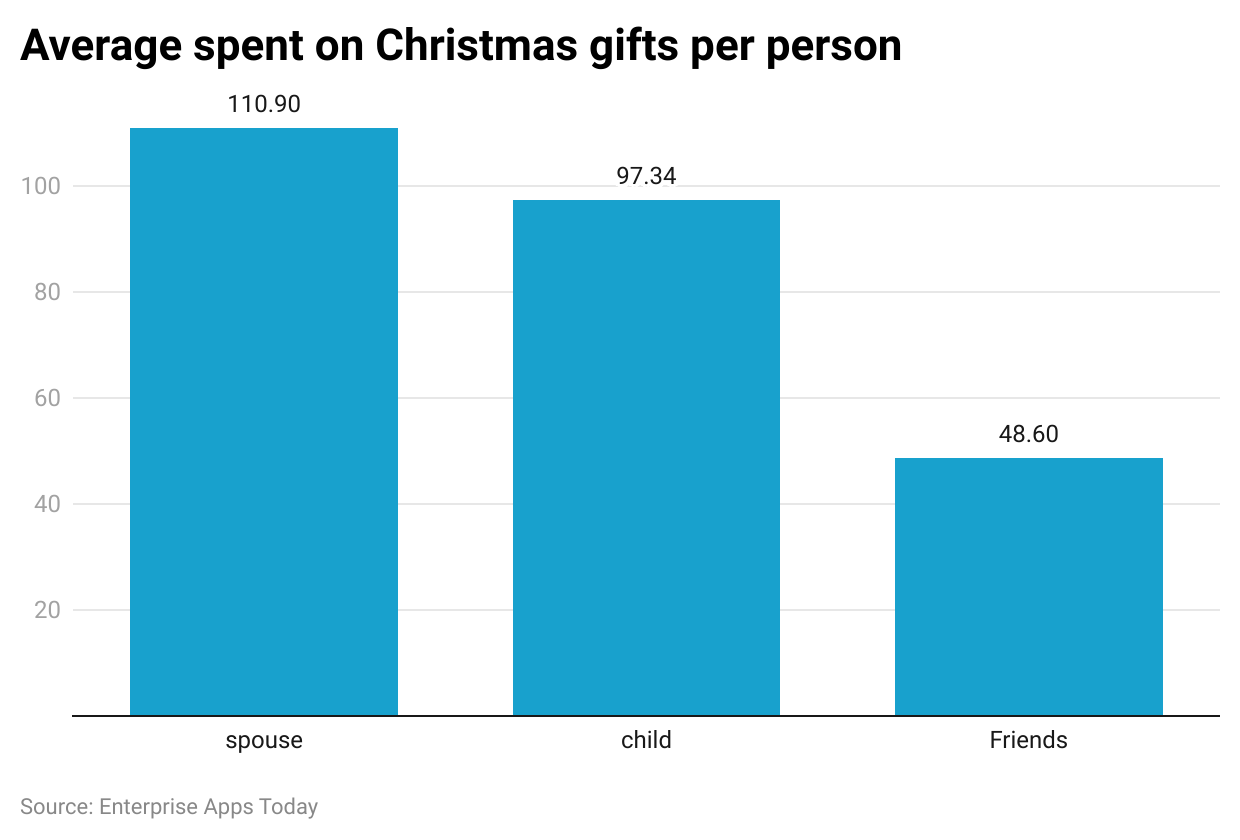
- In the United States of America, a person spends on average $110.9 for their spouse for Christmas gifts.
- Whereas, $97.34 and $48.6 is spent on child and friends by the average person living in the US.
By Average spending in the country
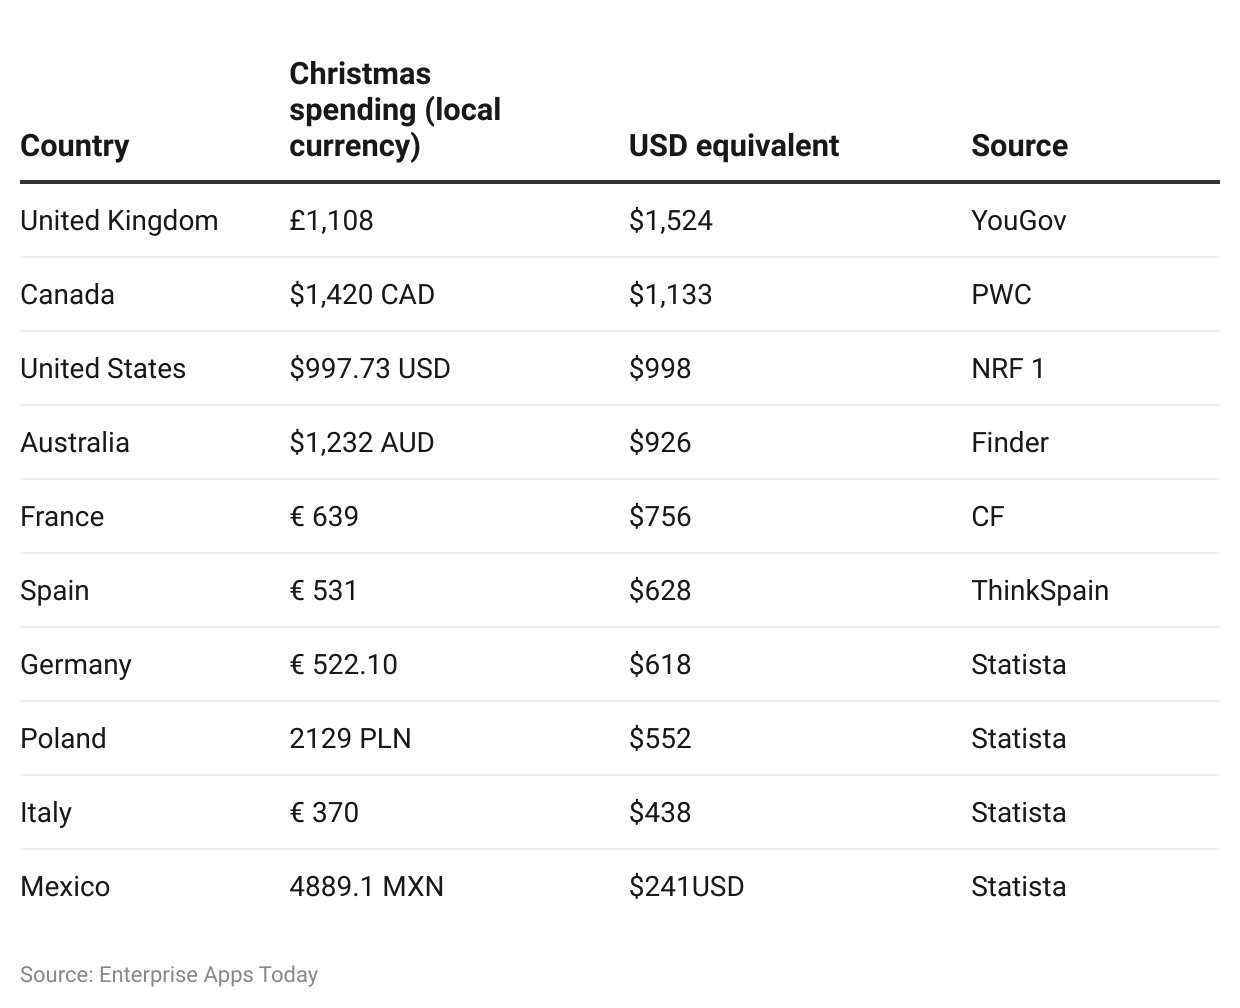
(Reference: headphonesaddict.com)
- According to the Christmas Spending Statistics, in the United Kingdom, on average people spend around $1,524.3 on shopping.
- Furthermore, in the United States of America and Australia shoppers spend around $997.73 and $925.6 during the holiday season.
- In France and Spain, people spend on average around $755.9 and $628.2 respectively.
- People in Germany and Poland usually spend on Christmas shopping around $617.6 and $551.8.
- Furthermore, Poland, Italy, and Mexico spend on average, $551.8, $437.7, and $241 respectively.
Christmas Spending Statistics by reasons to purchase gifts early
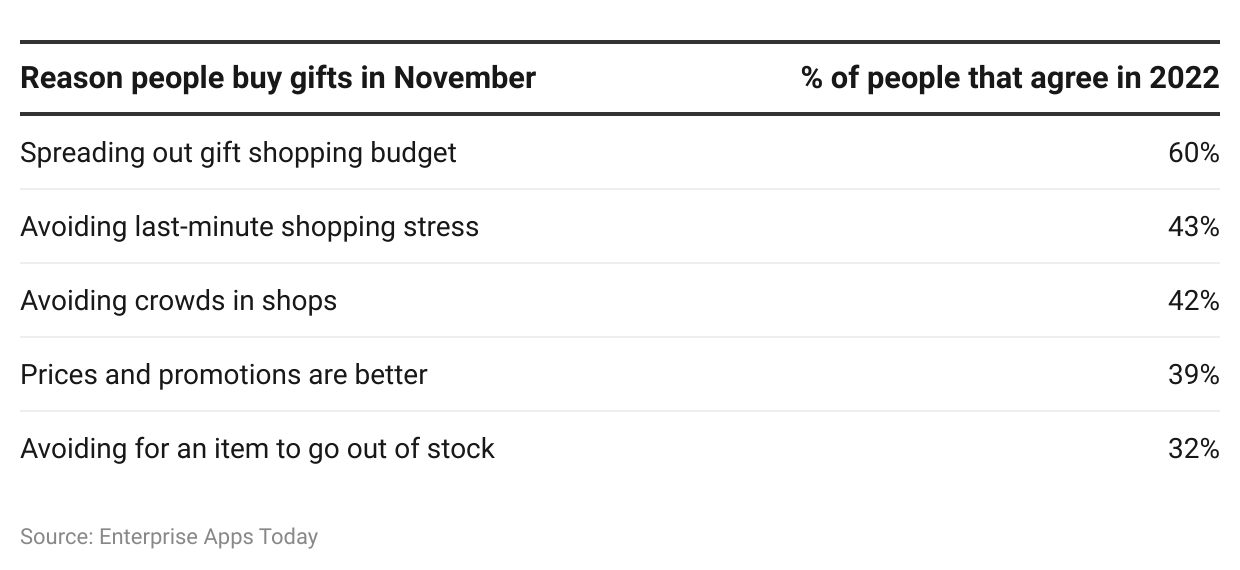
(Reference: headphonesaddict.com)
- As of 2022, 60% of the people purchased Holiday gifts in November stating the spreading out gift shopping budget as the main reason.
- Whereas 43% of the shoppers went shopping in advance to avoid last-minute shopping stress.
- With a minor difference, 42% of the people shop in advance to avoid crowds in the shops.
- 39% of the shopper said they get better prices and promotions while 32% of the people stated they want to avoid the wanted gift going out of stock.
Christmas Spending Statistics by the Method of Borrowing Money
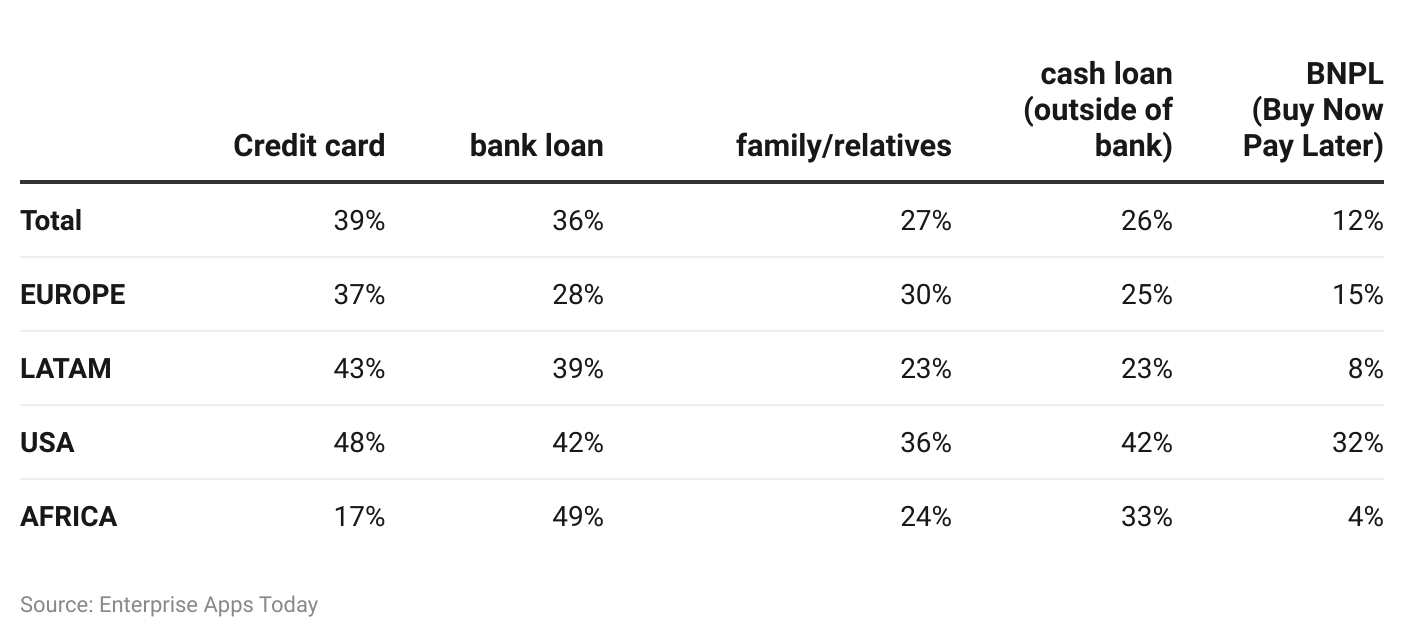
(Reference: tgmresearch.com)
- Christmas Spending Statistics state that, the maximum number of people in overall regions will purchase gifts using credit cards resulting in 39%, while 36% of the shoppers are thinking to take a bank loan.
- On the other hand, collectively of the worldwide population, 27% of shoppers will borrow from family/relatives.
- There 26% of shoppers are thinking of taking cash loans other than banks.
- And only 12% of shoppers will use Buy Now, Pay Later (BNPL) option.
- Further, the chart explains in detail every possible option opted for by shoppers in various regions.
Christmas Spending Statistics by gifts
| How many gifts do you give on Christmas? | Share of answers |
|---|---|
| 1-3 gifts | 16% |
| 4-5 gifts | 19% |
| 6-10 gifts | 24% |
| 11-15 gifts | 14% |
| 16-20 gifts | 8% |
| More than 20 gifts | 11% |
| Don't Know | 8% |
(Reference: headphonesaddict.com)
- In the United States of America, the highest number of people resulted in 24% giving 6 to 10 gifts during Christmas.
- There 16% of gift-givers give 1 to 3 presents while 19% of Americans give 4 to 5 gifts during the holiday season.
- 14% of people give 11 to 15 gifts while 8% give 16 to 20 gifts.
- There are around 11% gift givers with more than 20 gifts giving habits.
- And 8% of the population don’t have any idea.
By popularity
| Gift | Popularity |
|---|---|
| Gift cards | 56% |
| Clothing and accessories | 47% |
| Books and other media | 32% |
| Electronics, including headphones | 26% |
| Home Decoration | 23% |
| Personal care products | 20% |
| Jewelry | 20% |
| Home Improvement | 16% |
| Sporting goods | 16% |
| Other | 7% |
(Reference: headphonesaddict.com)
- The top 3 demanding gifts for Christmas in the United States of America are Gift cards, clothing and accessories and books, and other media resulting in 56%, 47%, and 32% respectively.
- Electronics, along with headphones and home decorations have a popularity rate for Christmas gifts at 26% and 23%.
- Personal care products and Jewelry are in demand by 20%.
- The last type of gifts preferred by people in the United States of America are home improvement gifts, sporting goods, and other types of gifts at 16% and 7%.
When do Americans start holiday shopping?
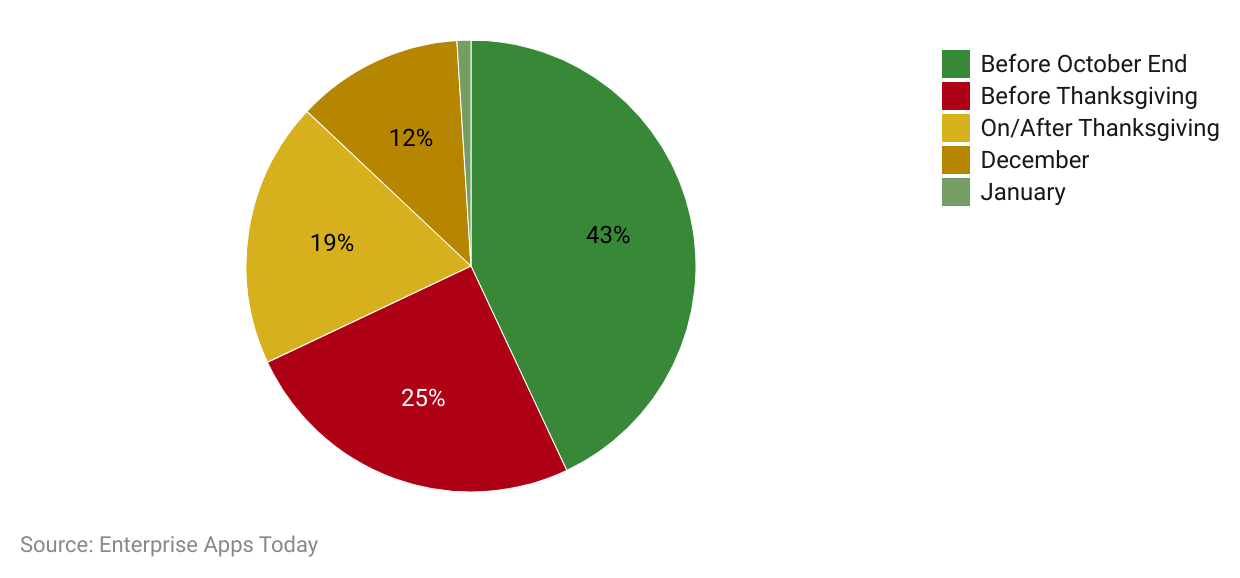
(Reference: finmasters.com)
- 43% of the shoppers in the United States of America purchase gifts before the end of October.
- On the other hand, 25% of the people go Christmas shopping before thanksgiving, while 19% of the shopper go on or after thanksgiving.
- 12% of people do Holiday shopping in December and only 1% of people do Holiday Shopping in January.
What does Christmas Spending Statistics say more?
Most desired gifts in the United States of America, 2022.
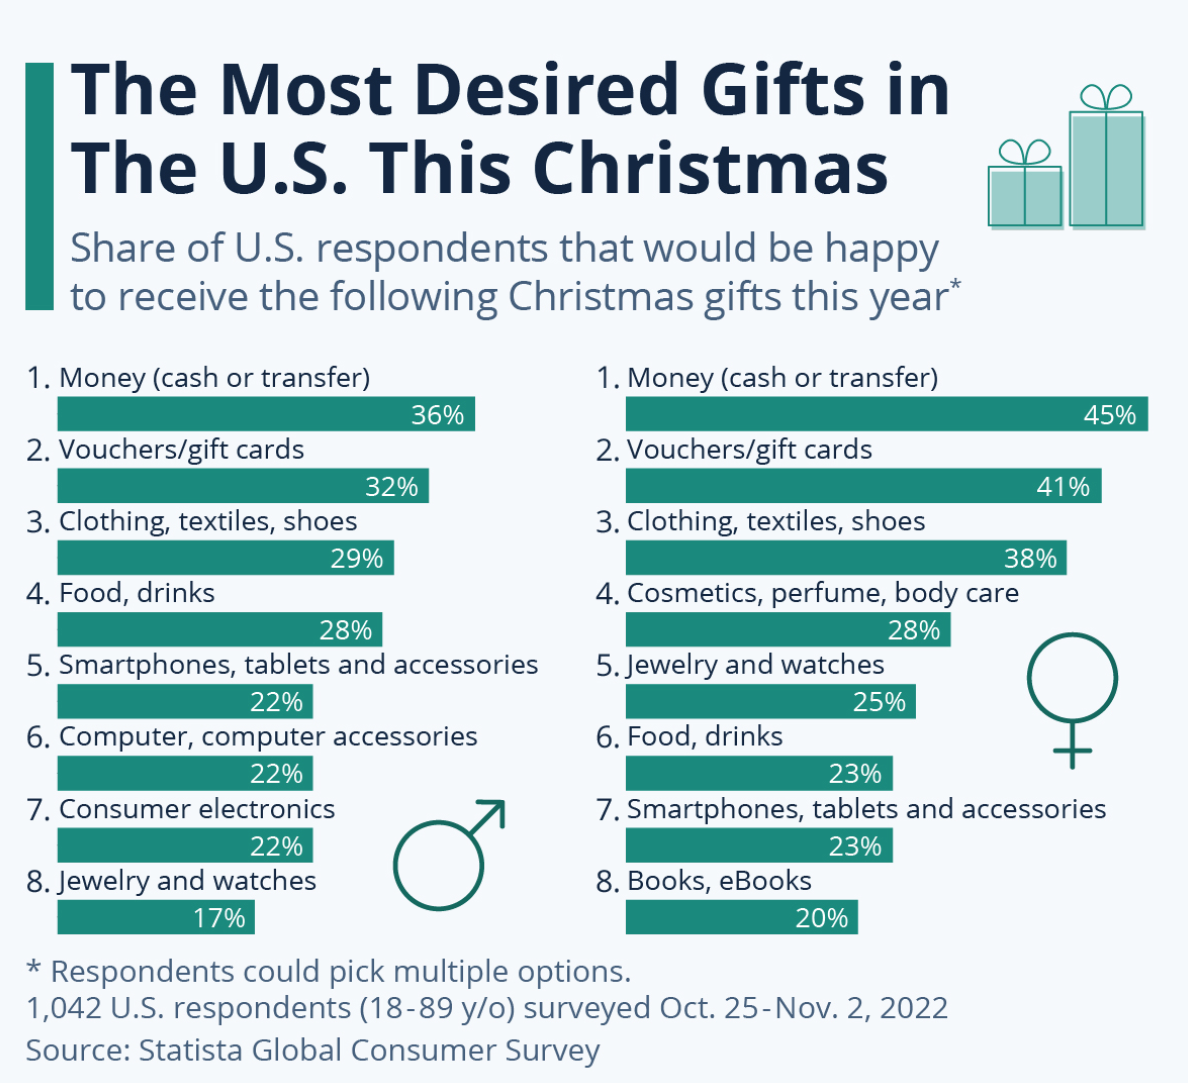
(Source: statista.com)
The Christmas cost for Dinner in the United Kingdom in 2022
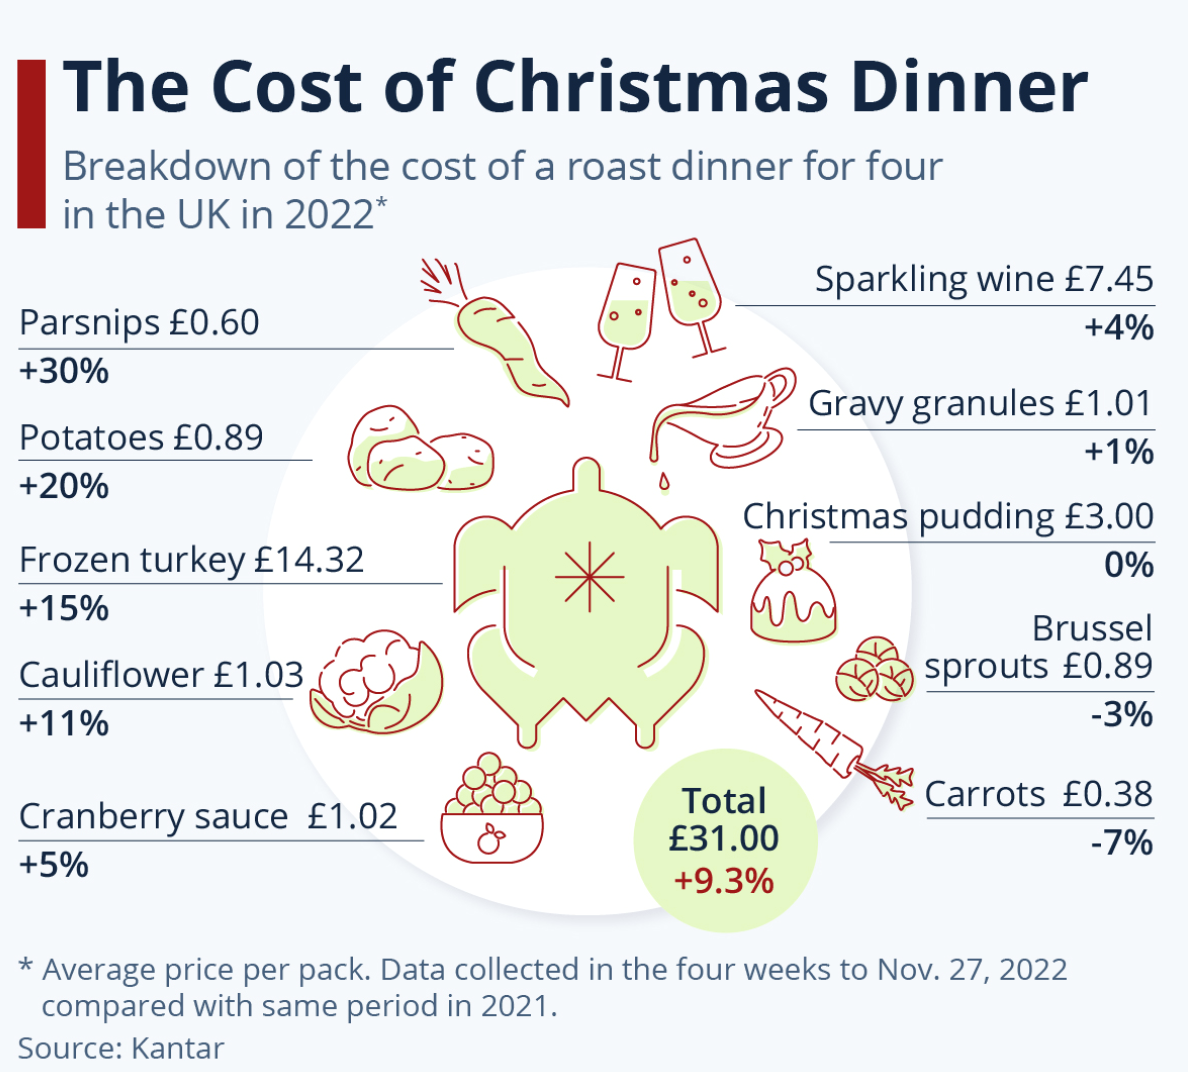
(Source: statista.com)
Reasons to Celebrate a Perfect Christmas in America in 2022
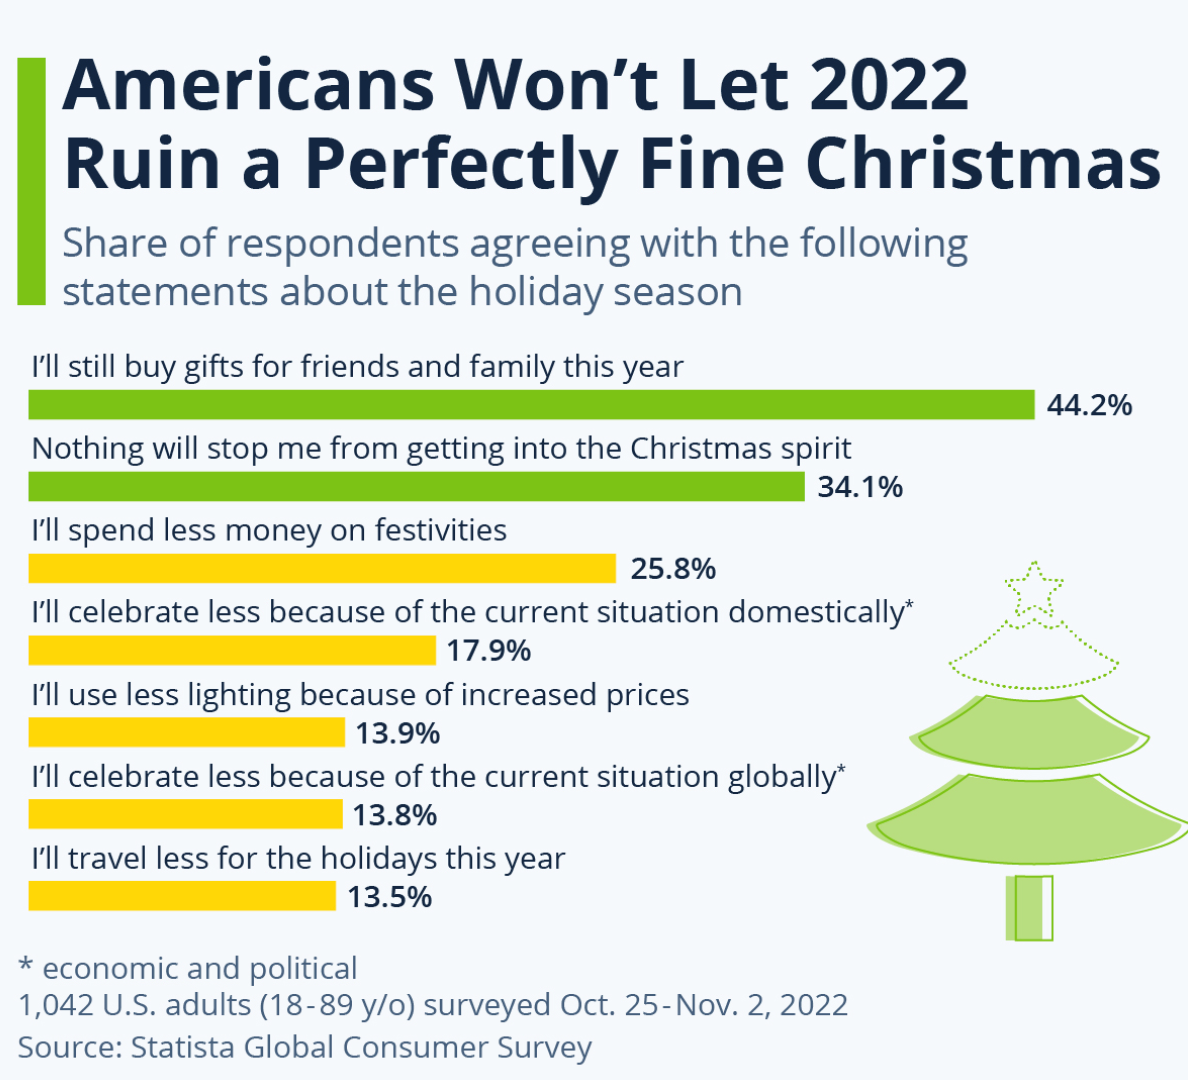
(Source: statista.com)
Who doesn’t support the Christmas holidays?
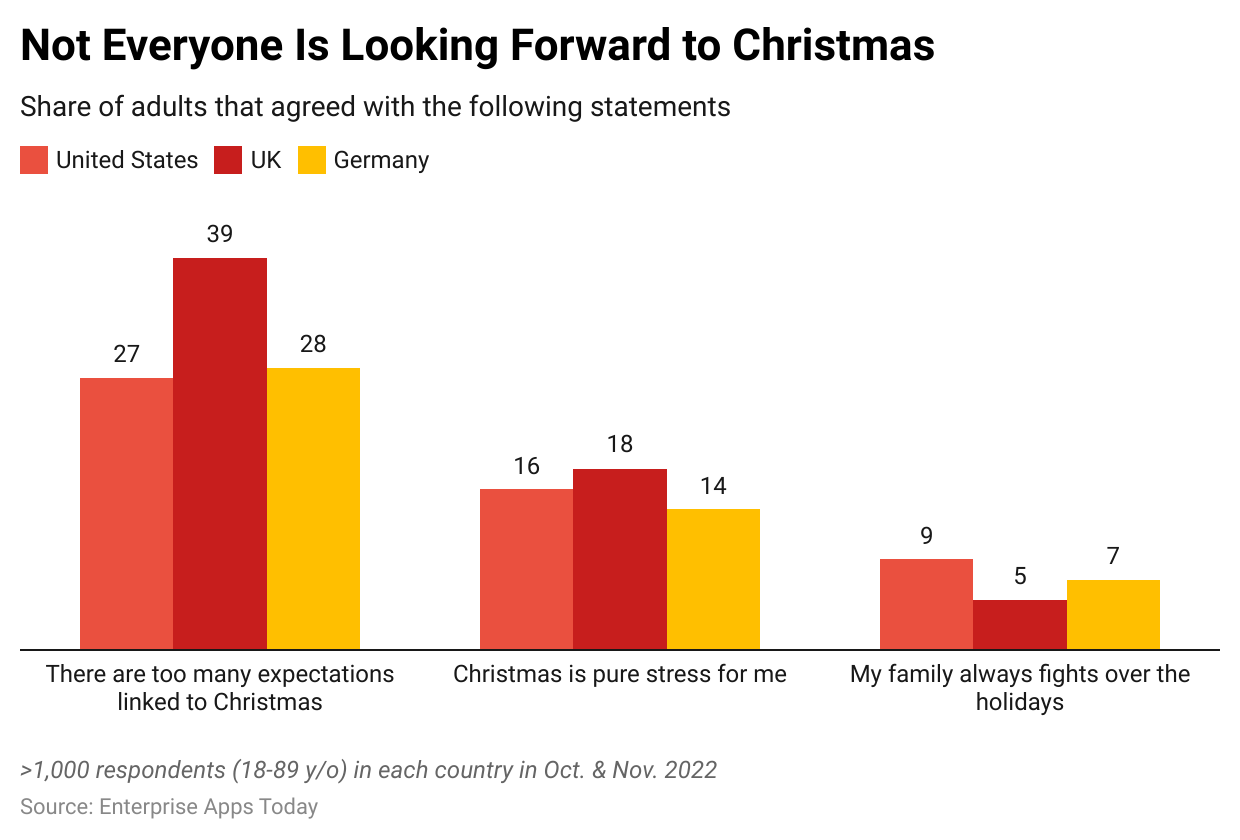
(Reference: statista.com)
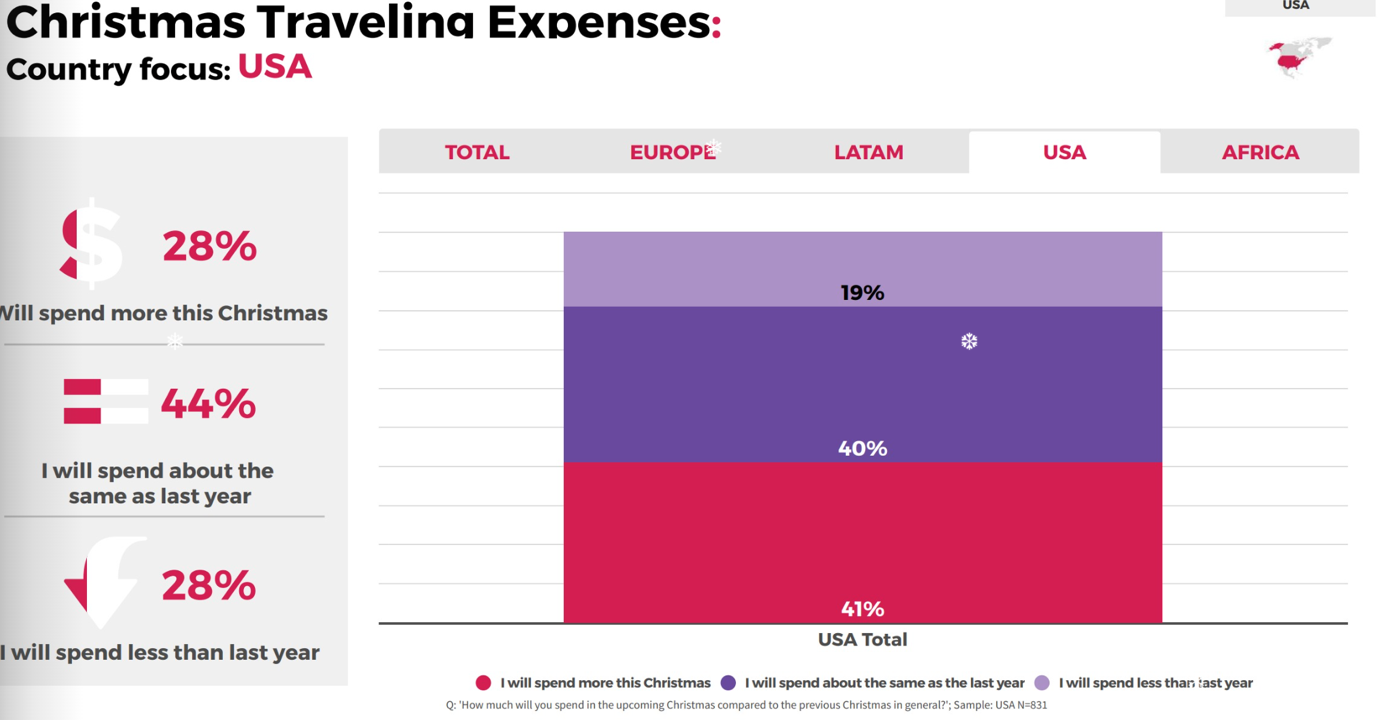
Traveling expenses during Christmas in the United States of America
(Reference: tgmresearch.com)
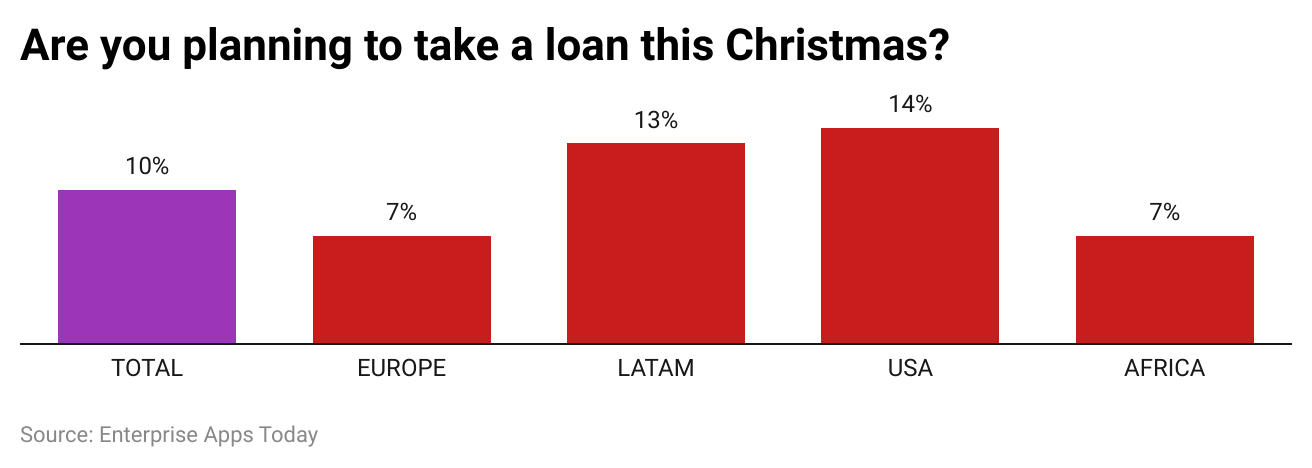
Planning to take a loan for Christmas?
(Source: tgmresearch.com)
Conclusion
Christmas is the most wonderful time of the year according to the majority of people in the United States of America. This is the time when friends and family come together and actually spend quality time with each other. Looking at the Christmas Spending Statistics, even though the world is going through bad times, people are not forgetting the tradition to celebrate Christmas. This just made us go back to last year’s Secret Santa game in our office and made our boss drink a glass of beer!
Sources
FAQ.
If you want to save money on Christmas, you can set a spending limit, and purchase products online because they are less priced. You can re-gift your old items in the house.
Santa’s bag is a helpful app that can aid in managing your budget as well as managing the name of the gift recipients, planning, and shopping further.
A book for readers, or mobile phone for techies, or any video game or Play station are some of the best gifts for Christmas.

Barry is a lover of everything technology. Figuring out how the software works and creating content to shed more light on the value it offers users is his favorite pastime. When not evaluating apps or programs, he's busy trying out new healthy recipes, doing yoga, meditating, or taking nature walks with his little one.