
Online Shoppers Statistics – By Holiday Shoppers, Social Media, Email Marketing, Demographics, Country and Online Behavior
Page Contents
- Introduction
- Editor’s Choice
- What is online shopping?
- Features of online shopping
- General Online Shoppers Statistics
- Online Shoppers Statistics by holiday shoppers
- Online Shoppers Statistics by Email Marketing
- Statistics by social media
- Statistic by Payment Methods
- Statistics by Demographics
- Online Shoppers Statistics by Country
- Online Shoppers Statistics by Region
- Online Shoppers Statistics by Online Behaviour
- Online Shoppers Statistics by brand awareness in the United States of America in 2022
- Conclusion
Introduction
Online Shoppers Statistics: Online shopping has become a daily habit, as we scroll through our phones, we order milk and other grocery items easily. These online facilities are increasing the customer database, and many shoppers prefer doorstep deliveries. Today, on the internet millions of websites have loaded their goods and products, and it has become a rat race between SEO wars of companies. All these things apart, there’s not a single item we can’t buy online, even insurance and bank account opening has become 100% online.
Check out these Online Shopping Statistics along with exclusive content of the most common brands in the United States of America by category, and let us know what you prefer online or offline shopping.
Editor’s Choice
- Interestingly, 21% of Americans have bought something online accidentally that they never wanted to have.
- 63% of online buyers prefer to buy products online if they have a positive in-store shopping experience.
- Moreover, 67% of consumers state, their spending on online shopping has increased after following a certain brand on social media.
- The most preferred online product for purchase by women is clothes or Sports goods resulting in 46% whereas the preference rate for the same is 40% for men.
- Today, China is the largest eCommerce market generating $672 billion in revenue followed by the United States of America at $340 billion in revenue.
- 40% of consumers globally have stated that they have purchased a product advertised on YouTube.
- Online Shoppers Statistics show that, in 2023, expected eCommerce revenue will be generated in the Asian region resulting in $2.055 trillion.
- Around 31% of consumers buy products online once per month whereas, 24% buy once every 2 weeks.
- On average, in the United States of America, a shopper spends $3 for every visit on the eCommerce platform.
- 56% of consumers are more likely to return to the eCommerce website if they provide recommendations for products.
What is online shopping?
Online Shopping is a form of eCommerce (Electronic Commerce) that allows consumers to buy goods and services from sellers on the Internet. One of the most known online shopping experiences is Amazon.com. It has hundreds of product categories for which millions of products are added to the list. Moreover, to give a live example, during the pandemic, their physical stores were closed but consumers were able to order many products online. Online shopping platforms allow shoppers to purchase from various categories such as consumer electronics, fashion accessories, kitchen appliances, electronic devices, books, jewelry, footwear, and much more…
Features of online shopping
- Multiple choices of products are available in a similar category.
- No need to step outside of the home.
- Easy comparison between two similar products on eCommerce websites.
- You can send online gifts to another location, or simply vouchers.
- Easy payment options.
- You can choose to pay in installments.
- In addition, you can also Buy Now and Pay Later.
- Same-day delivery is possible.
- Genuine products.
- You get to read customer reviews before buying.
- Doorstep delivery of perishable goods within 30 minutes.
- Wide range of accepted payment methods.
General Online Shoppers Statistics
- By 2025, there will be 273 million eCommerce shoppers in the United States of America.
- 63% of online buyers prefer to buy products online if they have a positive in-store shopping experience.
- The total number of online purchases made by 2040 will be 95%.
- Today, China is the largest eCommerce market generating $672 billion in revenue followed by the United States of America at $340 billion in revenue.
- 96% of Americans have at least made one purchase online.
- 48% of consumers have shifted from in-store shopping to online shopping.
- 53% of consumers in America, prefer Amazon over other online shopping platforms.
- 48% of consumers have a habit of overspending while shopping on the Internet.
- 42% of online buyers have at least purchased one product that made them regret it.
- 40% of online transactions take place on mobile devices.
- Whereas, 22% of online buyers use tablets during online shopping.
- Interestingly, 21% of Americans have bought something online accidentally that they never wanted to have.
- $330,000 is the average monthly revenue for any eCommerce website.
- 86% of the shoppers who shopped after Christmas Week, used search for holiday-related shopping.
- On average, in the United States of America, a shopper spends $3 for every visit on the eCommerce platform.
- Whereas, on average, a shopper purchases 3 products per order.
- Around 56% of online shoppers watch online shopping videos every day.
- Clothing is the most frequently bought online product in 2022.
- There are 24 million -retail stores live around the world.
- There are more than 205 million online shoppers who shop on the Internet every day.
- According to Online Shoppers Statistics, the projected eCommerce sales value will reach 8,148 trillion by 2026, whereas it is expected that in 2023, the value will reach 6,310 million in eCommerce sales.
- Eggs, Oat Milk, Ramen, Prepared cocktails, and cold or flu and cough remedies are mostly purchased online in the United States of America.
- Books are the most popular category for online shopping in the United States of America.
Online Shoppers Statistics by holiday shoppers
- Shoppers in the United States of America planned to spend 60% of the total holiday season budget in September 2022.
- As of 2022, 78.2% of men spent on electronics shopping during Black Friday.
- Whereas, on Cyber Monday, 63.6% of women spent on clothes and accessories in the United States of America.
Online Shoppers Statistics by Email Marketing
- On average, the open rate for abandoned cart emails is 45%.
- 59% of online shoppers say email marketing about products makes them buy online.
- After sending abandoned cart emails, 18% of them are converted into sales.
- 80% of the users discover new products or brands on Pinterest.
- 77% of consumers buy from the brands they follow on social media networks.
- Before purchasing a product 74% of consumers refer to social media for reviews.
- Moreover, 67% of consumers state, their spending on online shopping has increased after following a certain brand on social media.
- 54% of buyers go on Social media to buy products.
- 40% of consumers globally have stated that they have purchased a product advertised on YouTube.
Statistic by Payment Methods
- 53% of online buyers use credit cards for purchases.
- On the other hand, 38% of online shoppers use debit cards for purchases.
- 45% of the purchases are made using Buy Now, Pay Later.
Statistics by Demographics
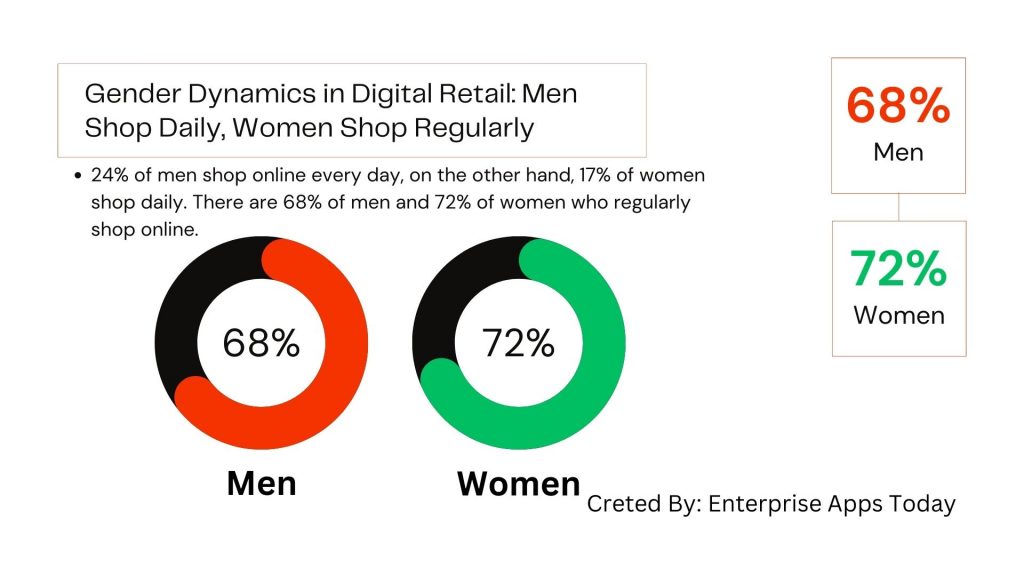
- 24% of men shop online every day, on the other hand, 17% of women shop daily. There are 68% of men and 72% of women who regularly shop online.
- In the United States of America, millennials are the largest group of online shoppers.
(Reference: optinmonster.com)
By age
- 41.8 million 25–34 years
- 36.5 million 35–44 years
- 35.1 million 65+ years
- 32.3 million 45–54 years
- 31.8 million 55–64 years
- 26.5 million 18–24 years
- 10.7 million 14–17 years
(Source: fitsmallbusiness.com)
- As of 2022, consumers aged between 25 to 34 years were the largest group of online shoppers resulting in 41.8 million.
- Furthermore, other age-wise distribution consumers in the top three most online shoppers belong to 35 to 44 years and 65 years and above resulting in 36.5 million and 35.1 million respectively.
- In addition, other consumers in other age groups contributed as follows 45 to 54 years (32.3 million), 55 to 64 years (31.8 million), 18 to 24 years (26.5 million), and 14 to 17 years (10.7 million).
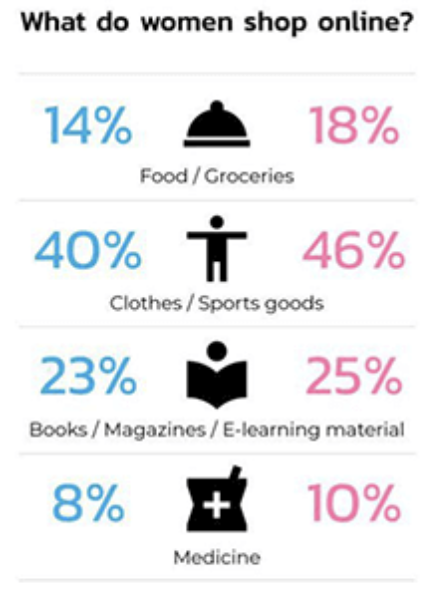
By Online Shopping Trend for Women
(Source: optinmonster.com)
- The most preferred online product for purchase by women is clothes or Sports goods resulting in 46% whereas the preference rate for the same is 40% for men.
- Other topmost preferred categories for online shopping by women are books/magazines/e-learning material (25%) and food/ groceries (18%), whereas for men, in similar categories the percentage is 40% and 14% respectively.
- The least preferred category to buy is medicines for women (10%) and men (8%).
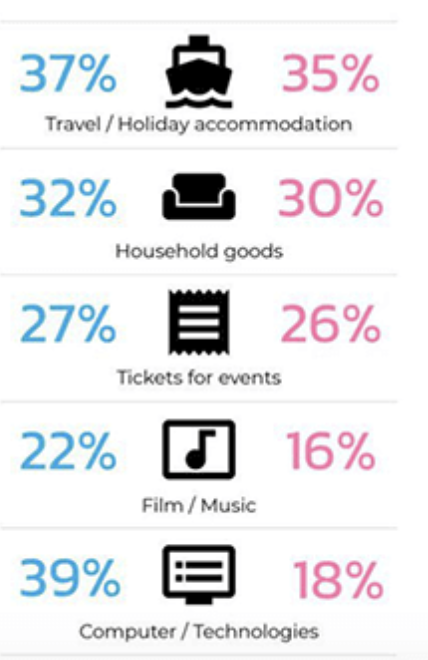
Online Shopping trend for men
(Source: optinmonster.com)
- On the other hand, the most preferred product by men to buy online is computer or technology-related products resulting in 39%, for women the second least preferred product resulting in 18%.
- The other two categories preferred by men are travel/ holiday recommendations (37%) and tickets for events (27%), for women in the similar category it is 35% and 26% respectively.
- In addition, household goods (32%) and film/ music are also purchased by men while women with a purchasing rate for similar categories at 30% and 16% each.
Online Shoppers Statistics by Country
(Reference: meetanshi.com)
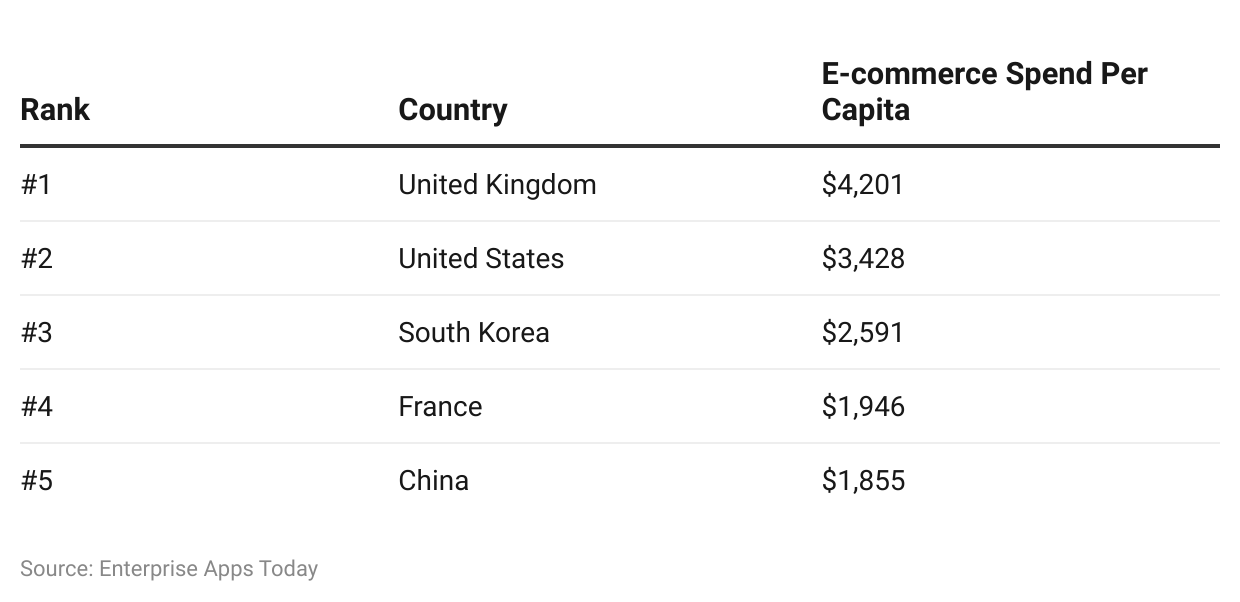
- According to the Online Shoppers Statistics, the United Kingdom does the most shopping online by spending $4,201 on average per capita.
- Other two countries in the top three list of most online shopping countries are the United States of America and South Korea resulting in $3,428 and $2,591 average spent per capita.
- In addition, France and China contribute to the average spent per capita by $1,946 and $1,855 respectively.
Online Shoppers Statistics by Region
(Reference: bloggingwizard.com)
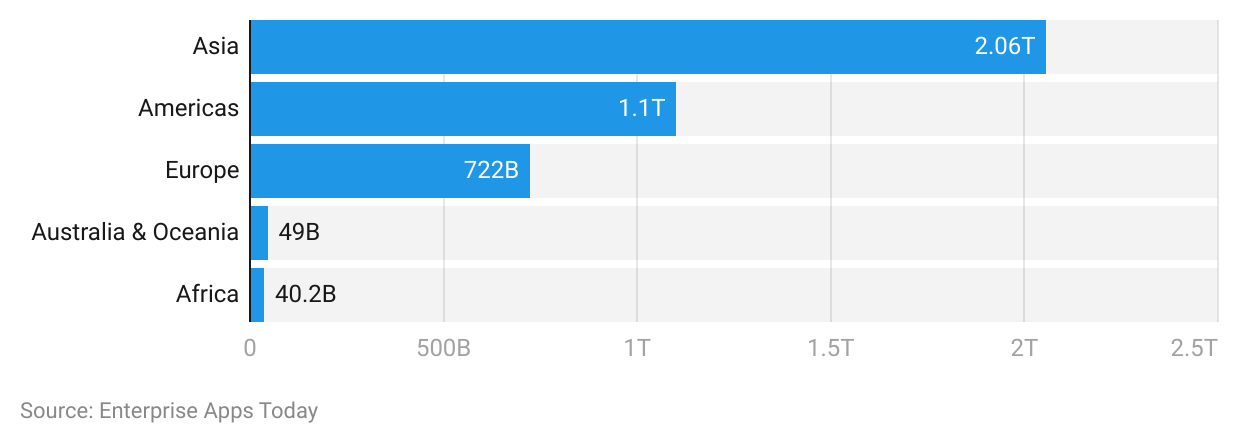
- Online Shoppers Statistics show that, in 2023, expected eCommerce revenue will be generated in the Asian region resulting in $2.055 trillion.
- Whereas, the American region will be contributing around $1.1 trillion of global retail eCommerce revenue.
- Contribution from the European region will amount to $722 billion in 2023.
- And Australia and Oceania as well as Africa will be generating around $49 billion and $40.2 billion respectively.
Online Shoppers Statistics by Online Behaviour
- 18% of Americans prefer online shopping because it is available 24/7.
- Whereas 14% of people like it because they receive discount coupons.
- On the other hand, 17% of shoppers like online shopping because it doesn’t require them to leave home.
- And, 10% and 9% of consumers say they like it because it is faster than in-store shopping and they can compare prices at ease.
- 80% of shoppers research online before buying a product.
- Whereas, 93% of shoppers prefer to read reviews before buying the product.
- 67% of consumers are more likely to purchase from an eCommerce platform if it has a mobile-friendly interface.
- 66% of shoppers prefer free shipping on all products.
- 61% of online shoppers prefer to share private details with a third-party seller.
- 56% of consumers are more likely to return to the eCommerce website if they provide recommendations for products.
- 50% of online buyers state images of the products help them to buy products.
- 51% of shoppers use Google to research their products.
- 1% of online buyers prefer an easy return process.
- 70% of online shoppers read at least one to 6 reviews before buying a product.
- 1% of buyers prefer next-day delivery.
- Moreover, 46.2% of shoppers said they would prefer 2 to 3 days shipping options.
By online shopping frequency
(Reference: zippia.com)
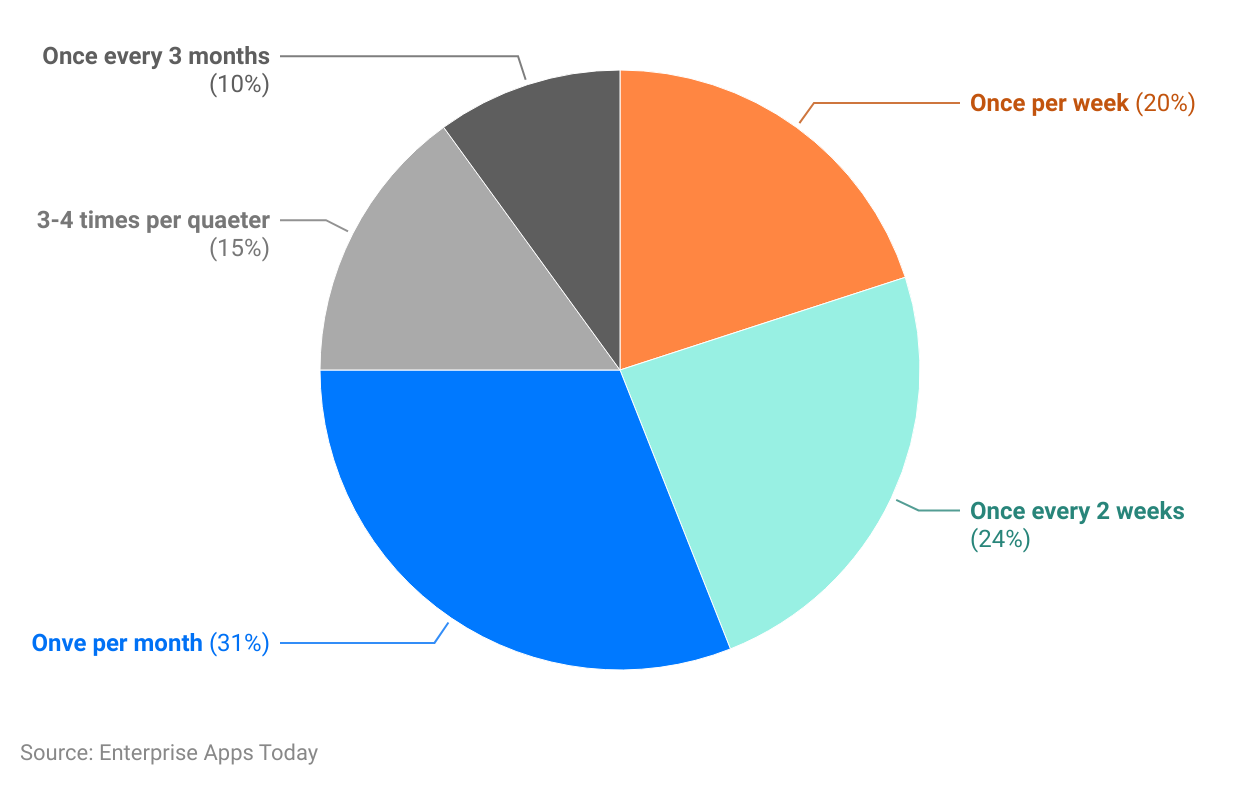
- Around 31% of consumers buy products online once per month whereas, 24% buy once every 2 weeks.
- There are 20% of online shoppers with a habit of buying products once per week and 15% do it 3 to 4 times per quarter.
- Only 10% of people purchase products online once every 3 months.
Reasons to buy online
(Reference: financesonline.com)
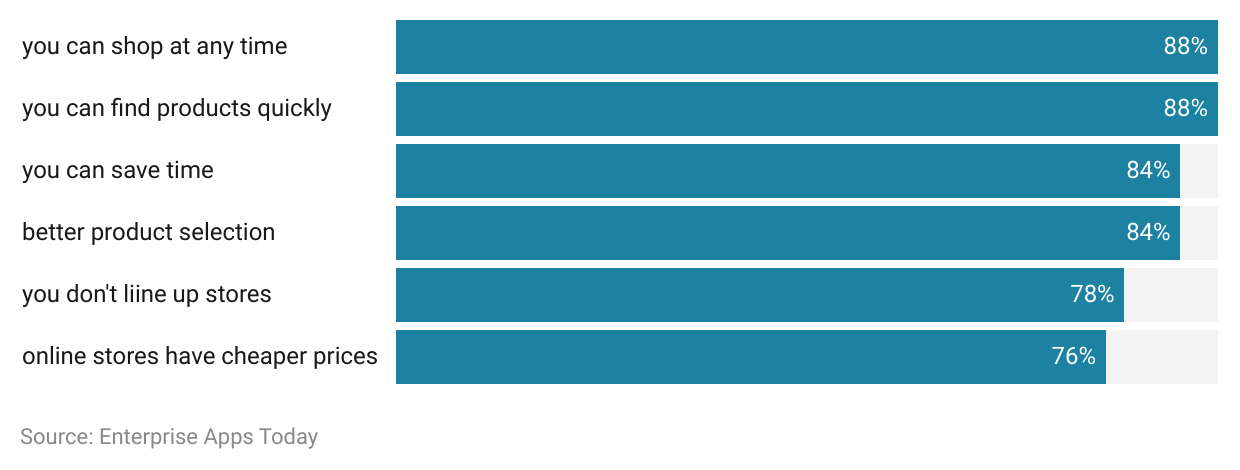
- The top reasons to buy online are shopping is available at any time (88%), and products can be found quickly (88%).
- Whereas other consumers say that you can save time (84%) and there’s better product selection (84%).
- In addition, consumers are not required to stay in lines (78%), and online stores offer products at cheaper prices (76%).
By channels through which consumers see a product before purchasing
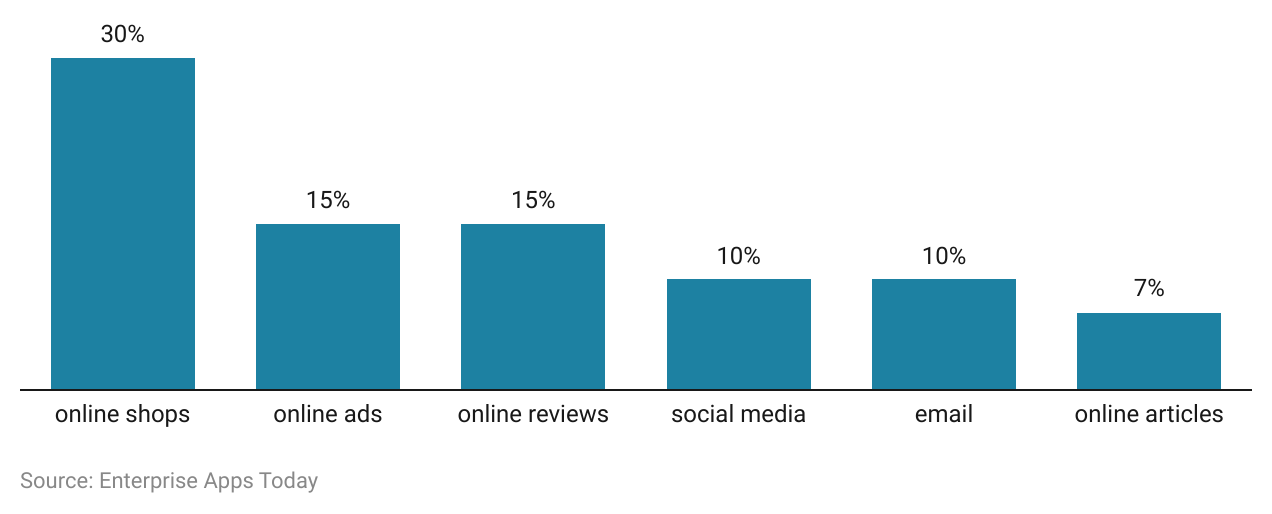
(Reference: financesonline.com)
- Online Shops are the top channel through which consumers see a product before purchasing resulting in 30%.
- Whereas online Advertisements and Online reviews contribute similarly by 15%.
- Furthermore, Social media and email marketing are other factors that influence product visuals at 10%.
- Whereas Online articles help to channel initial product purchasing decisions by 7%.
Online Shoppers Statistics by brand awareness in the United States of America in 2022
Leading second-hand apparel online Shops
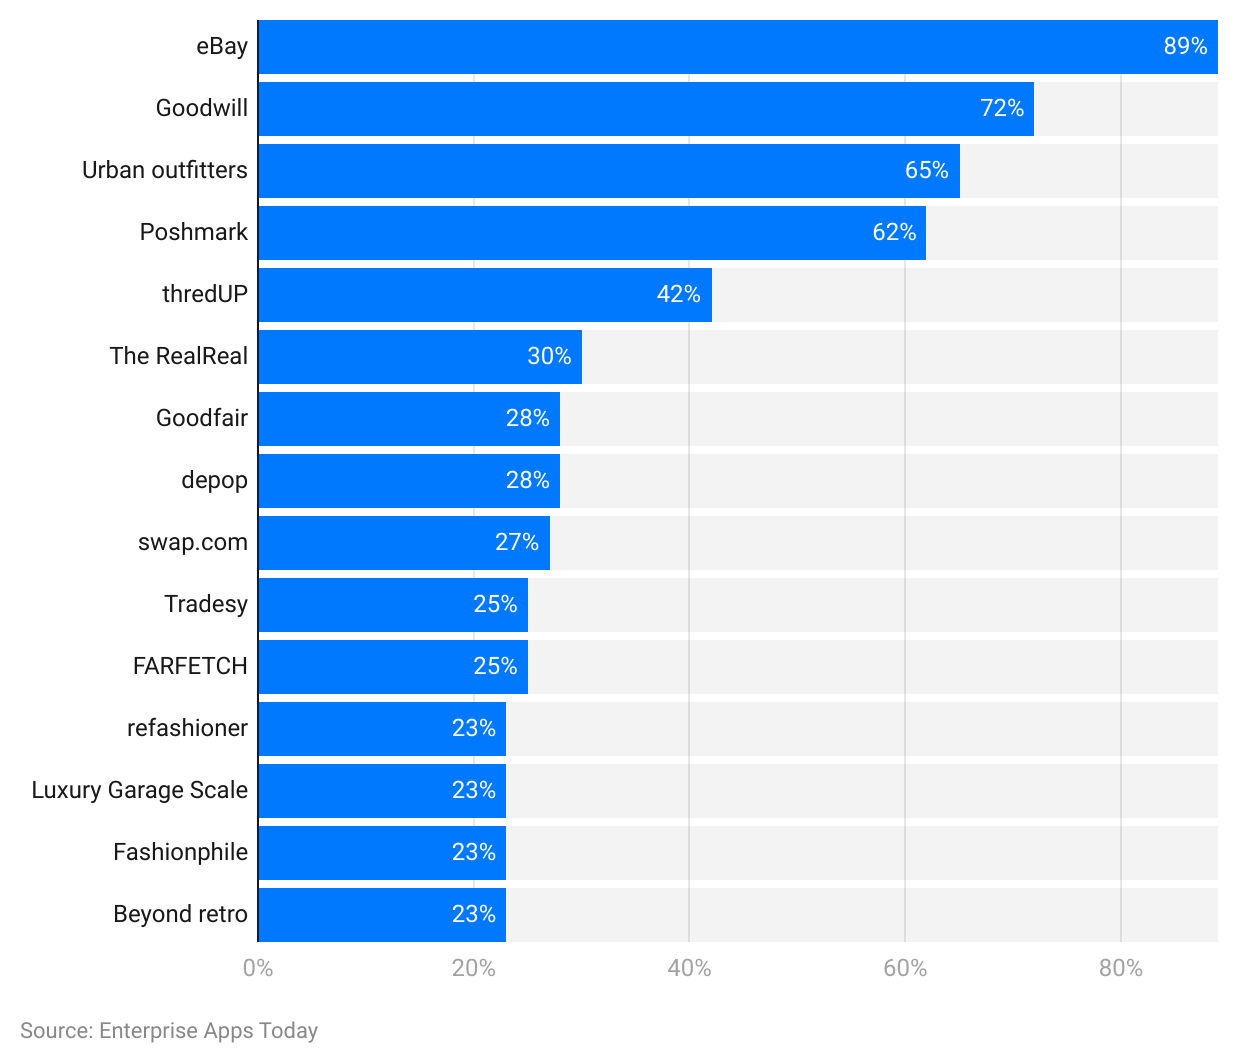
(Reference: statista.com)
Leading furniture online shops
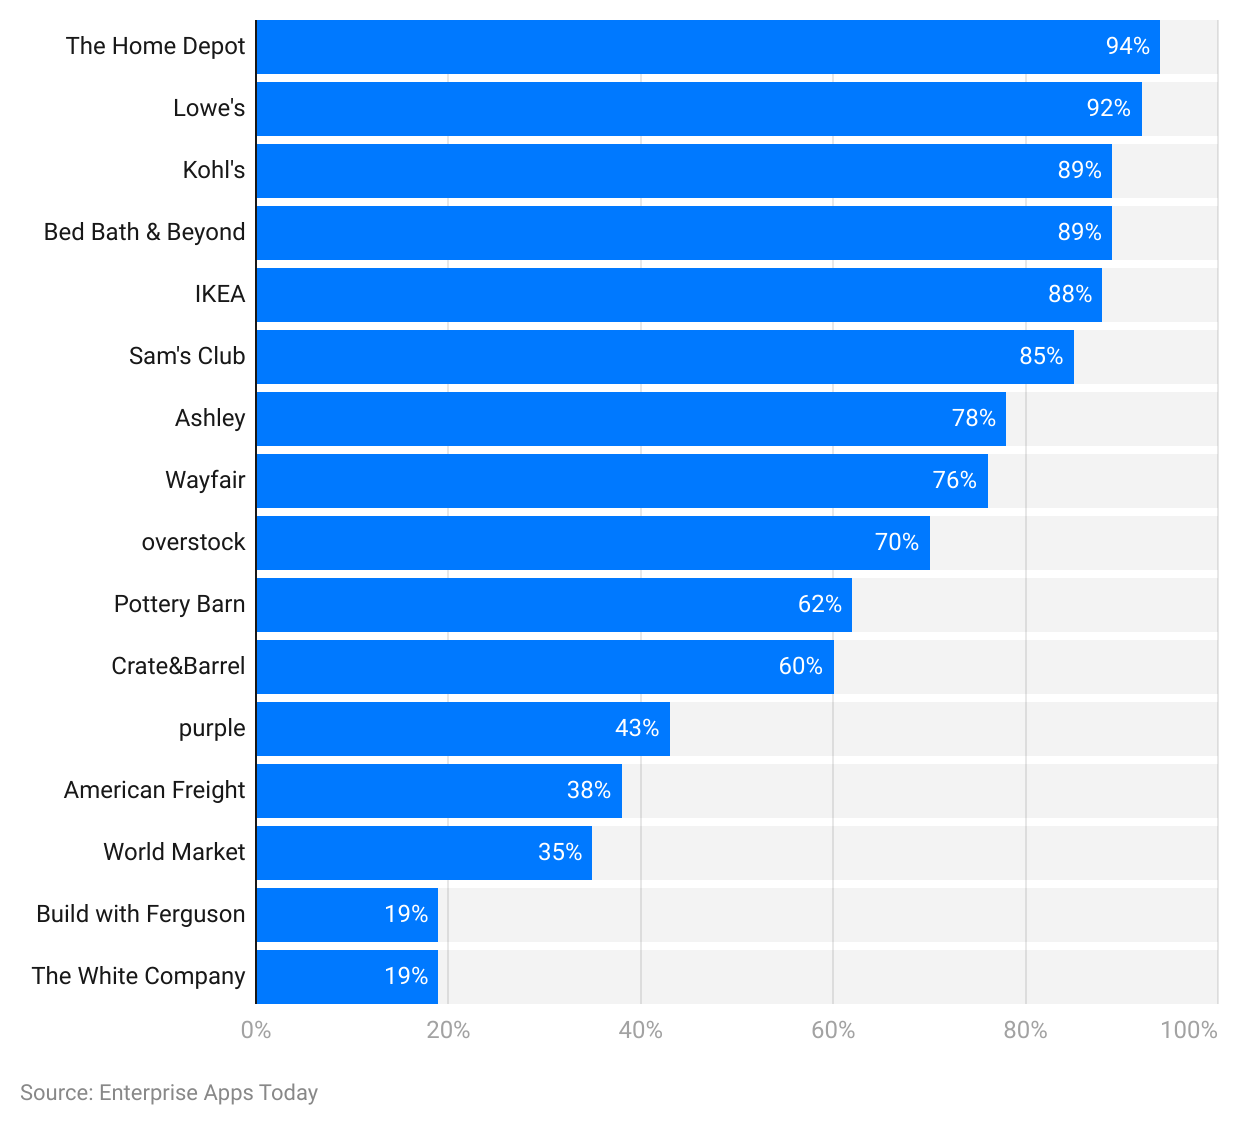
(Reference: statista.com)
Leading fashion online shops
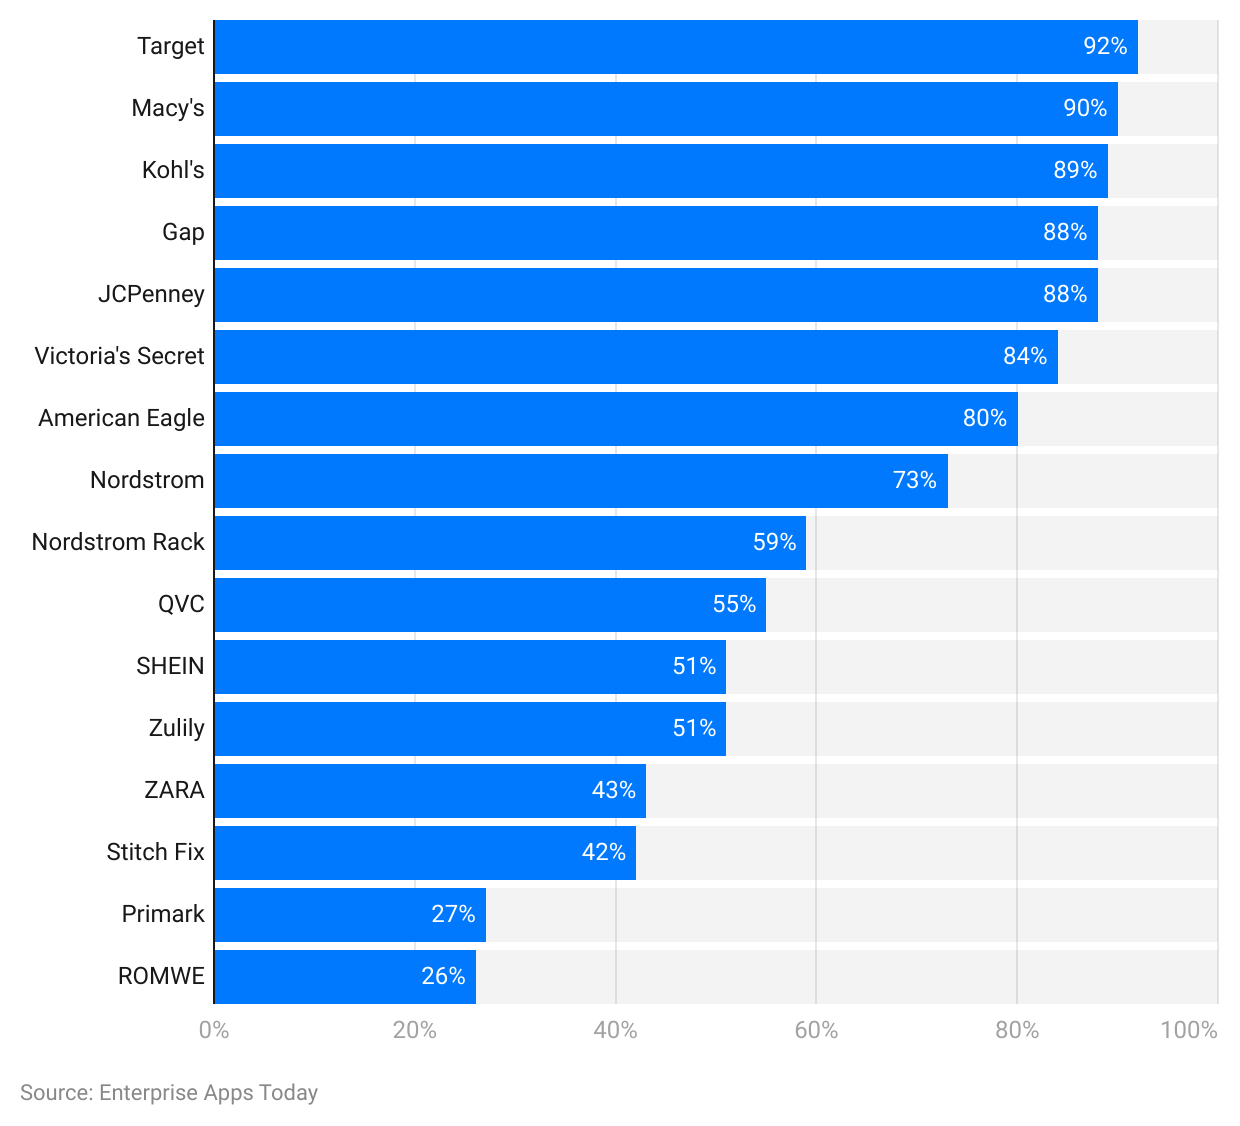
(Reference: statista.com)
By leading comparison portals
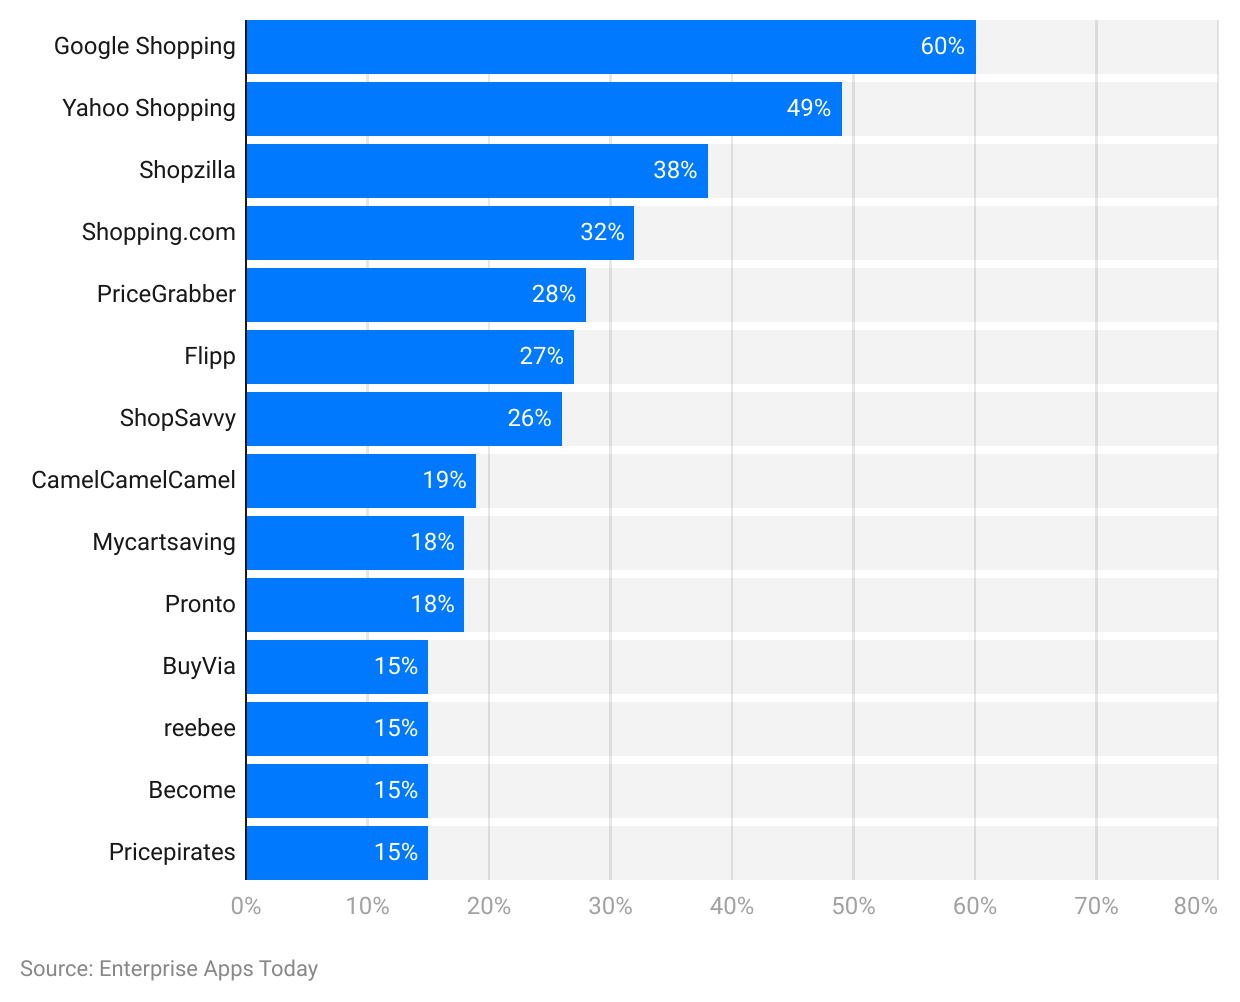
(Reference: statista.com)
By leading beverage online shops in 2022

(Reference: statista.com)
By leading sports and outdoor online shops in 2022
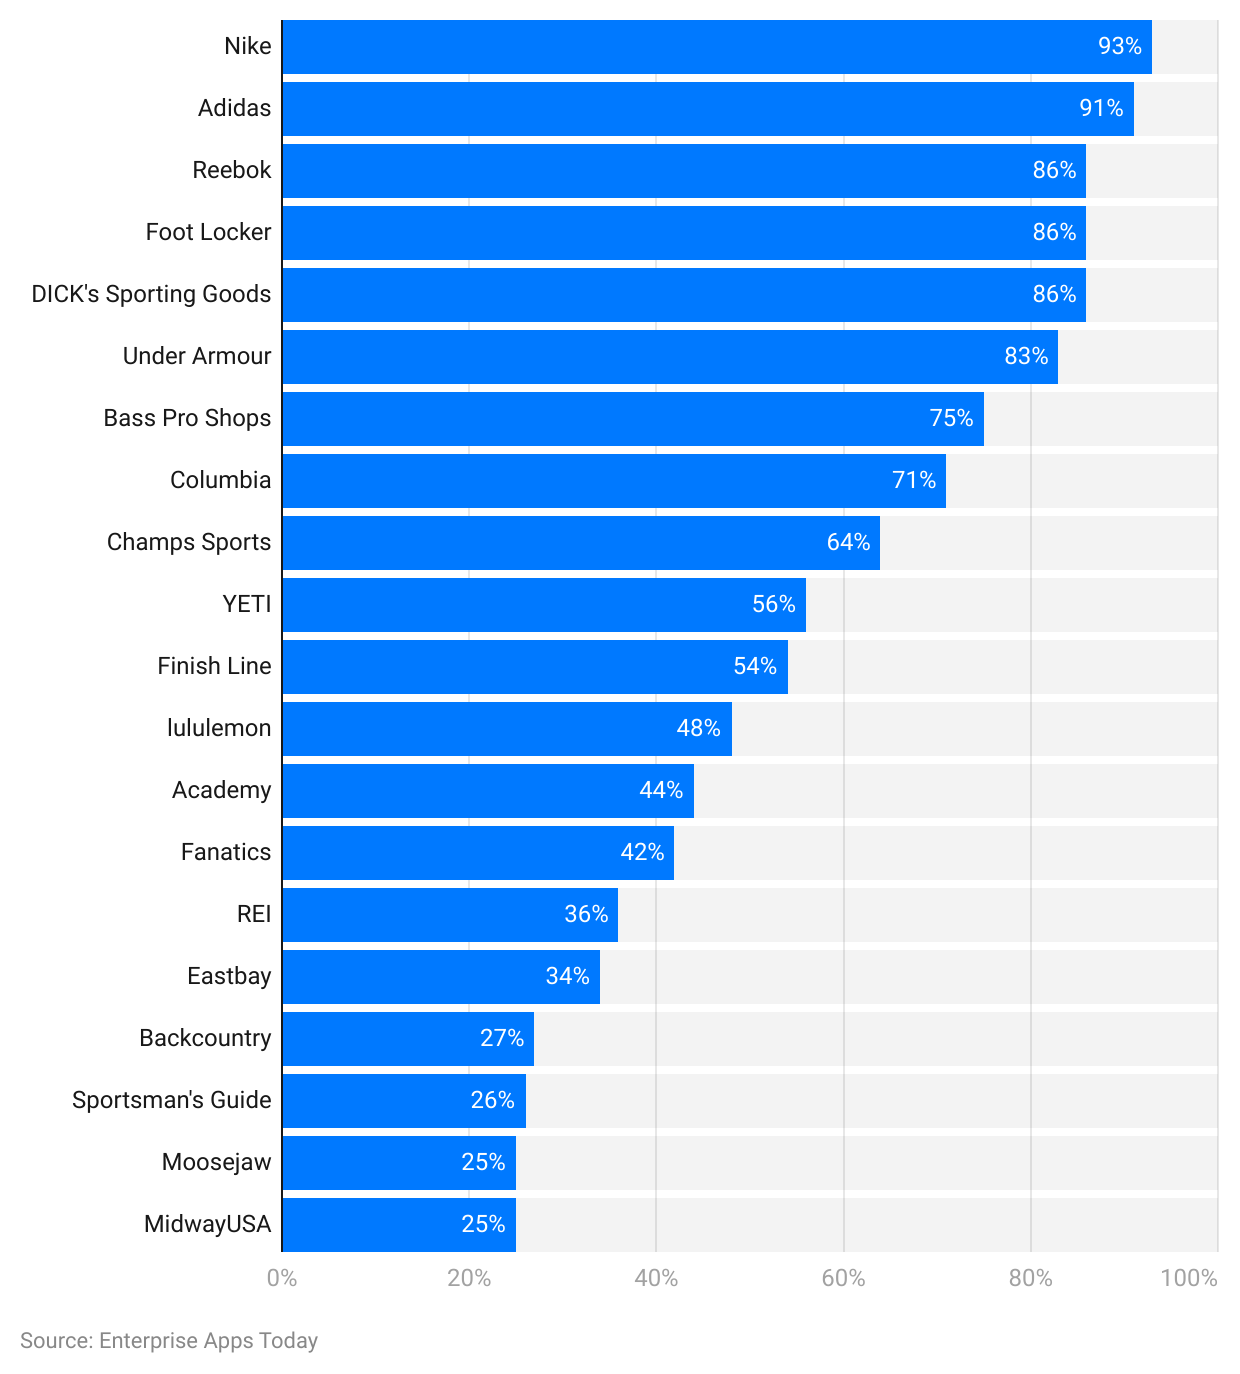
(Reference: statista.com)
By leading beauty and health shops in 2022
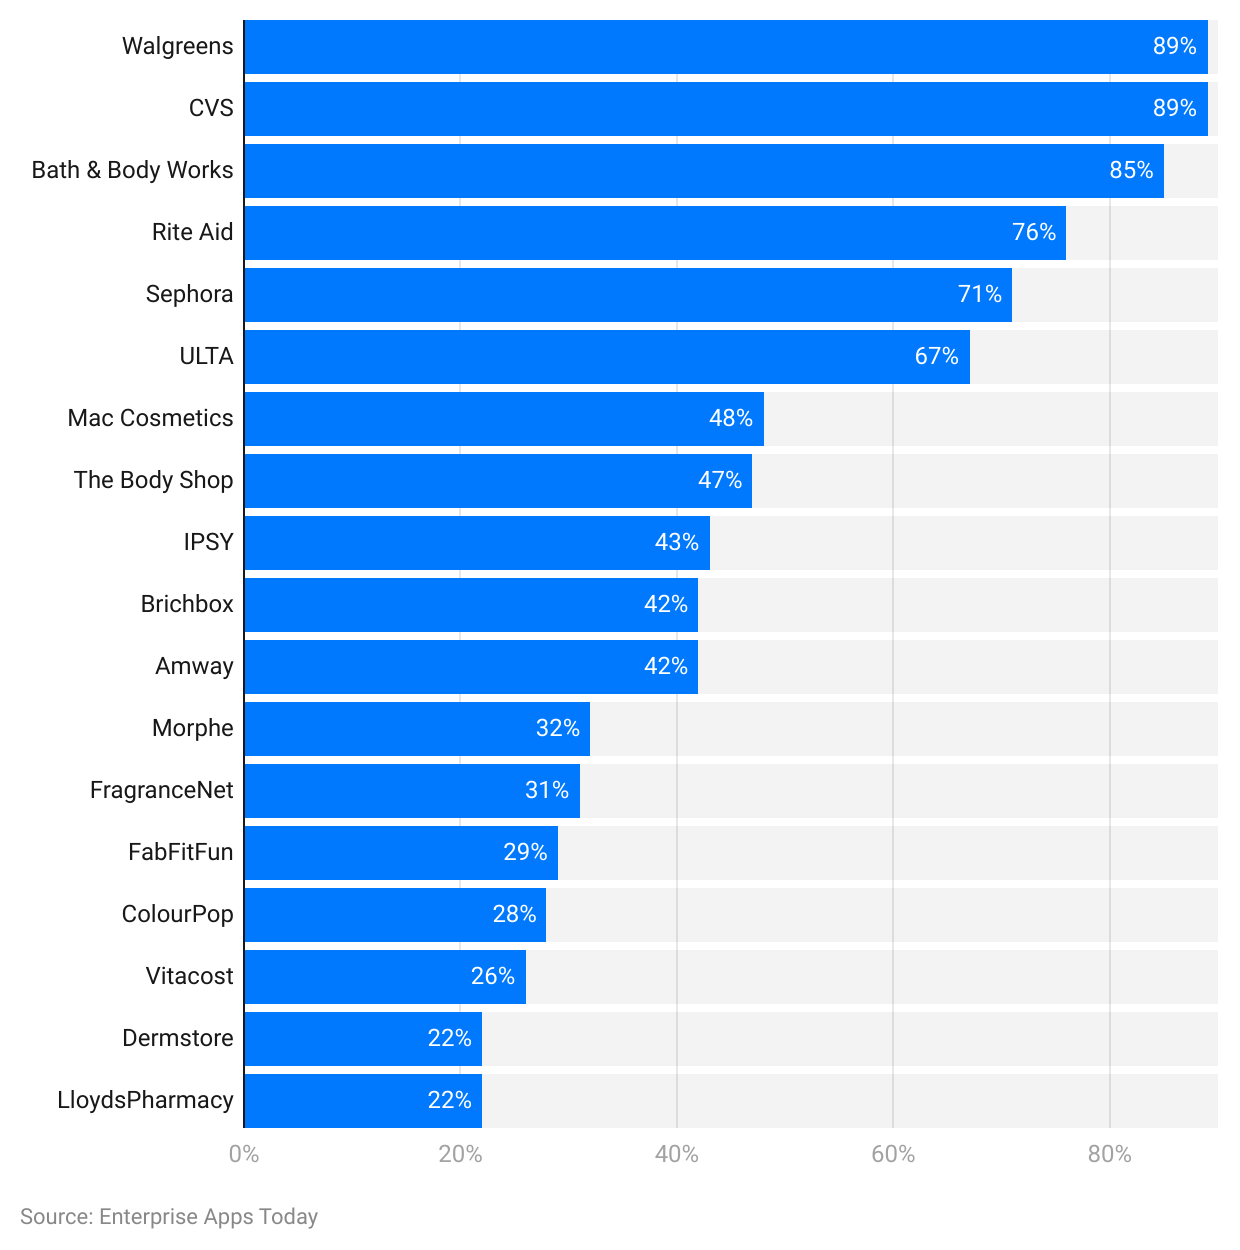
(Reference: statista.com)
By leading Pet Supply online shops in 2022
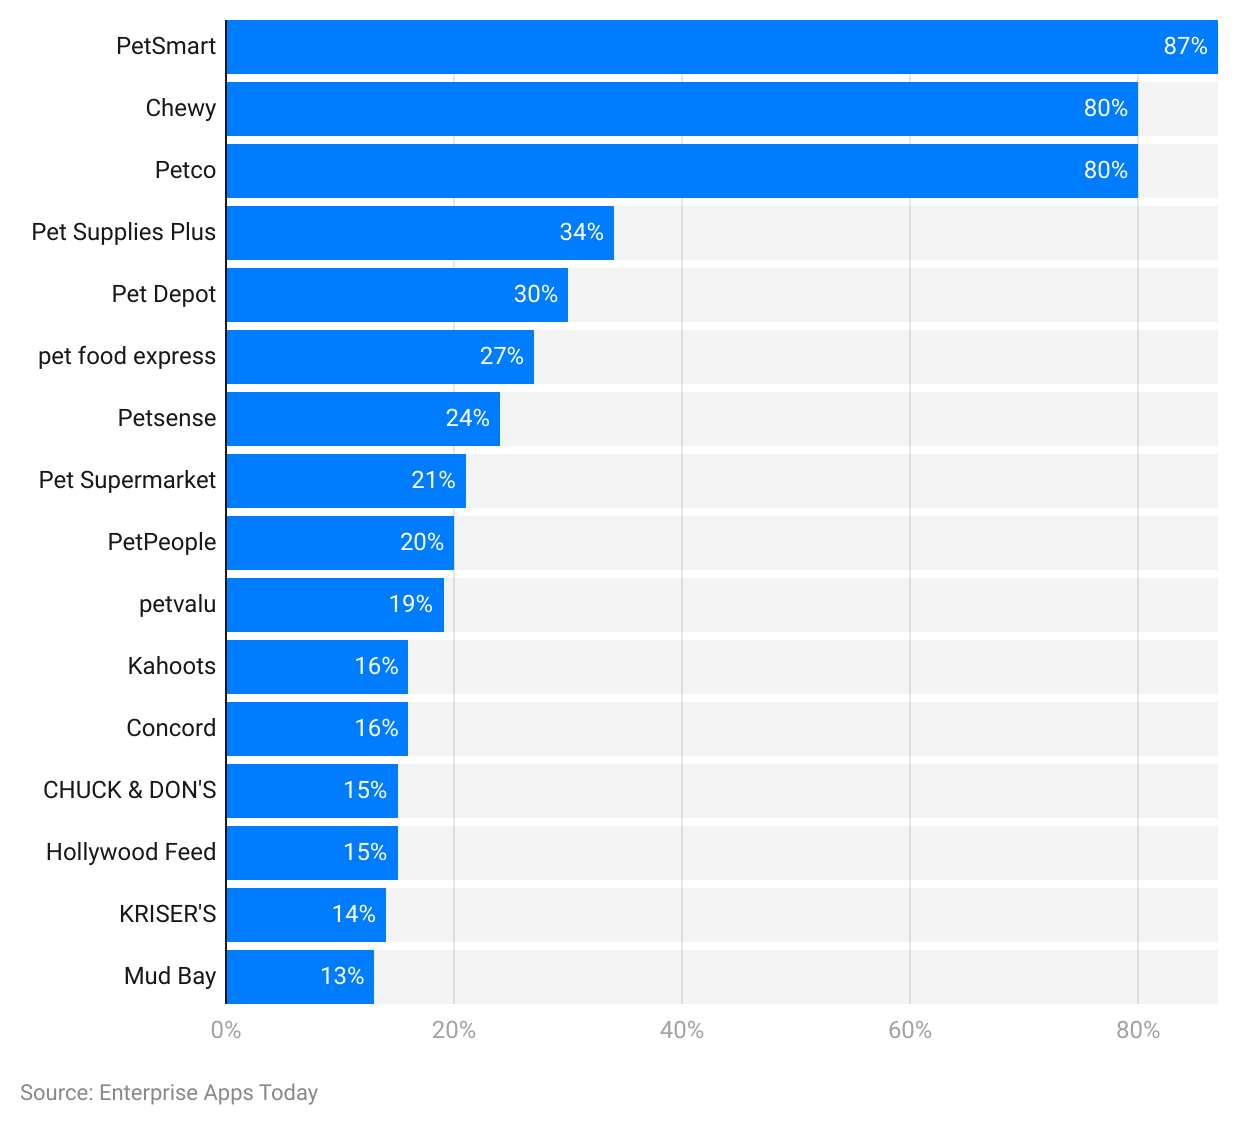
(Reference: statista.com)
By leading toys and baby online shops in 2022
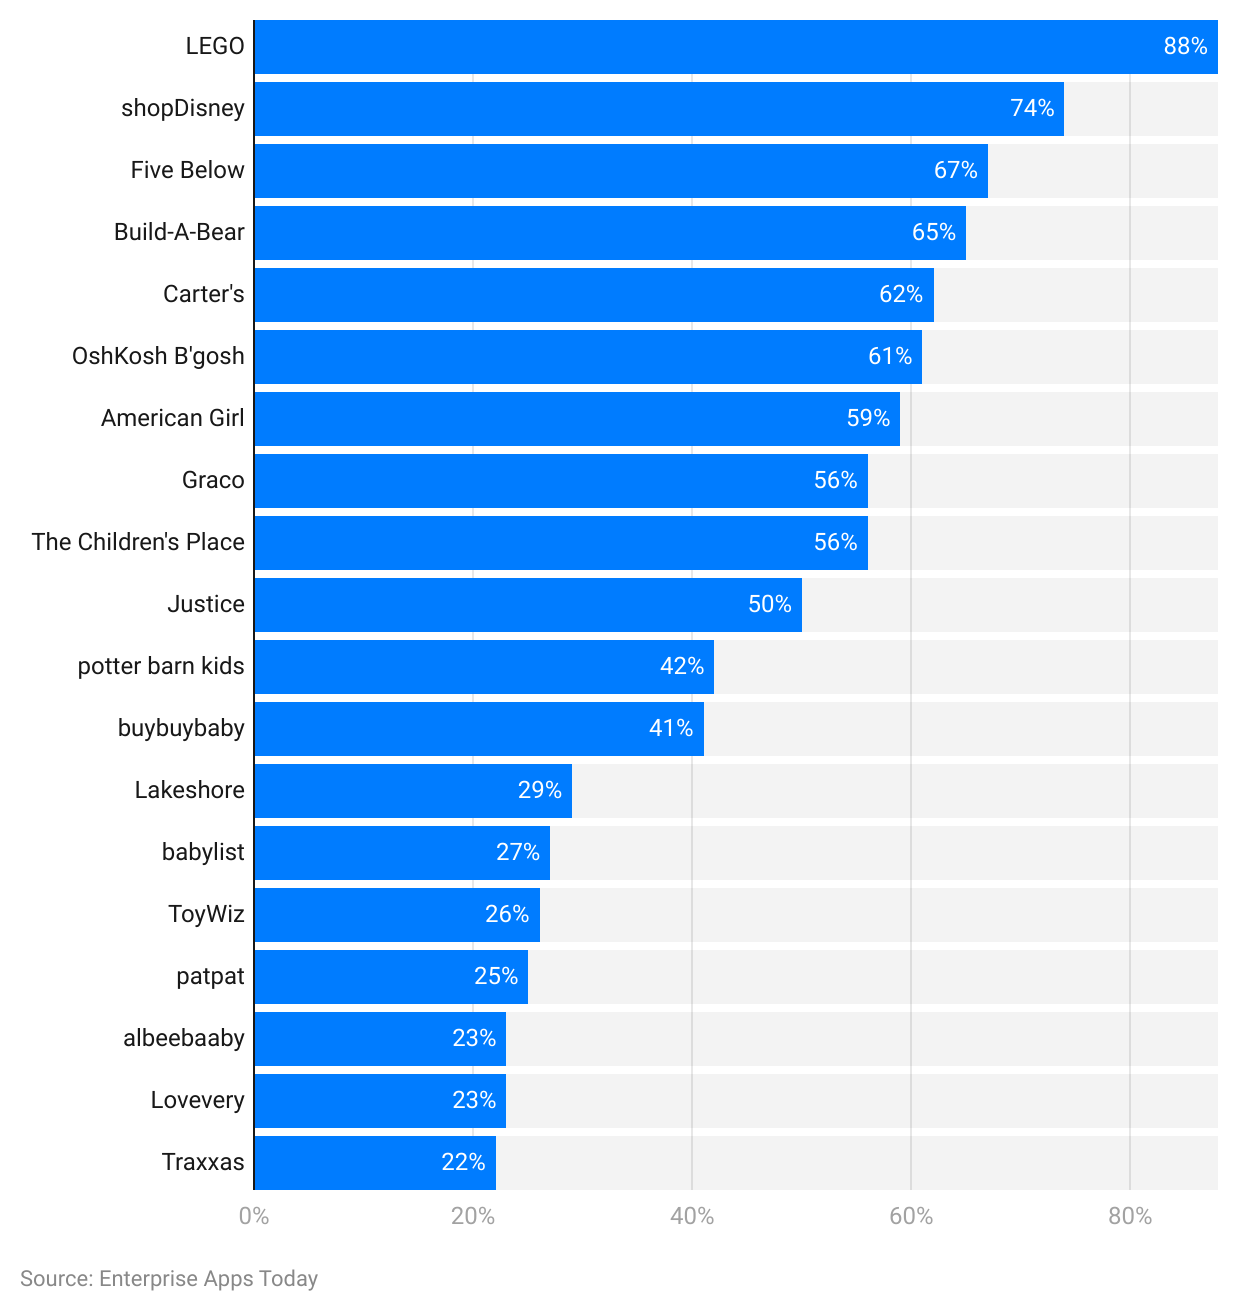
(Reference: statista.com)
By Car and Motorcycle Online Shops
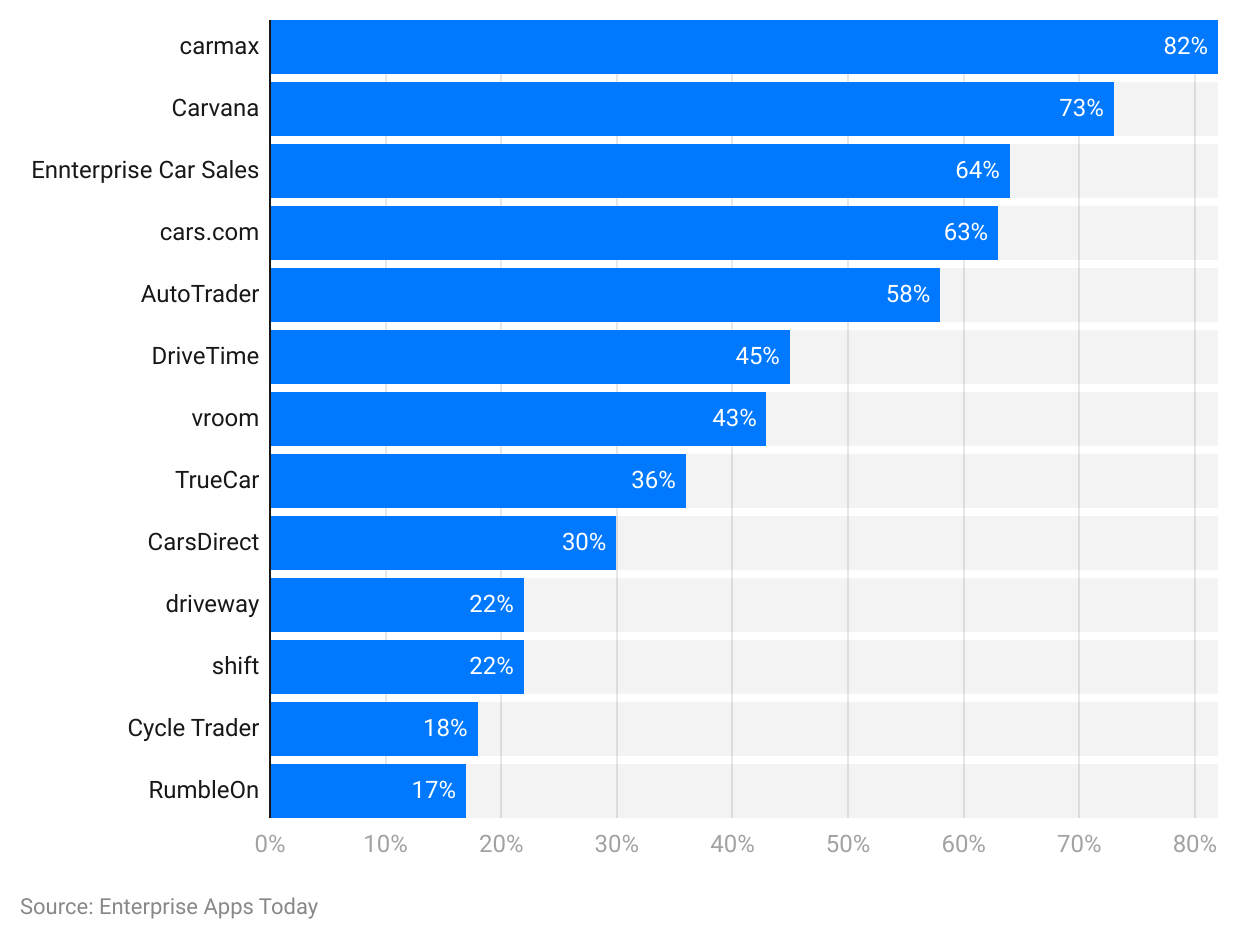
(Reference: statista.com)
By leading consumer electronics online shops in 2022
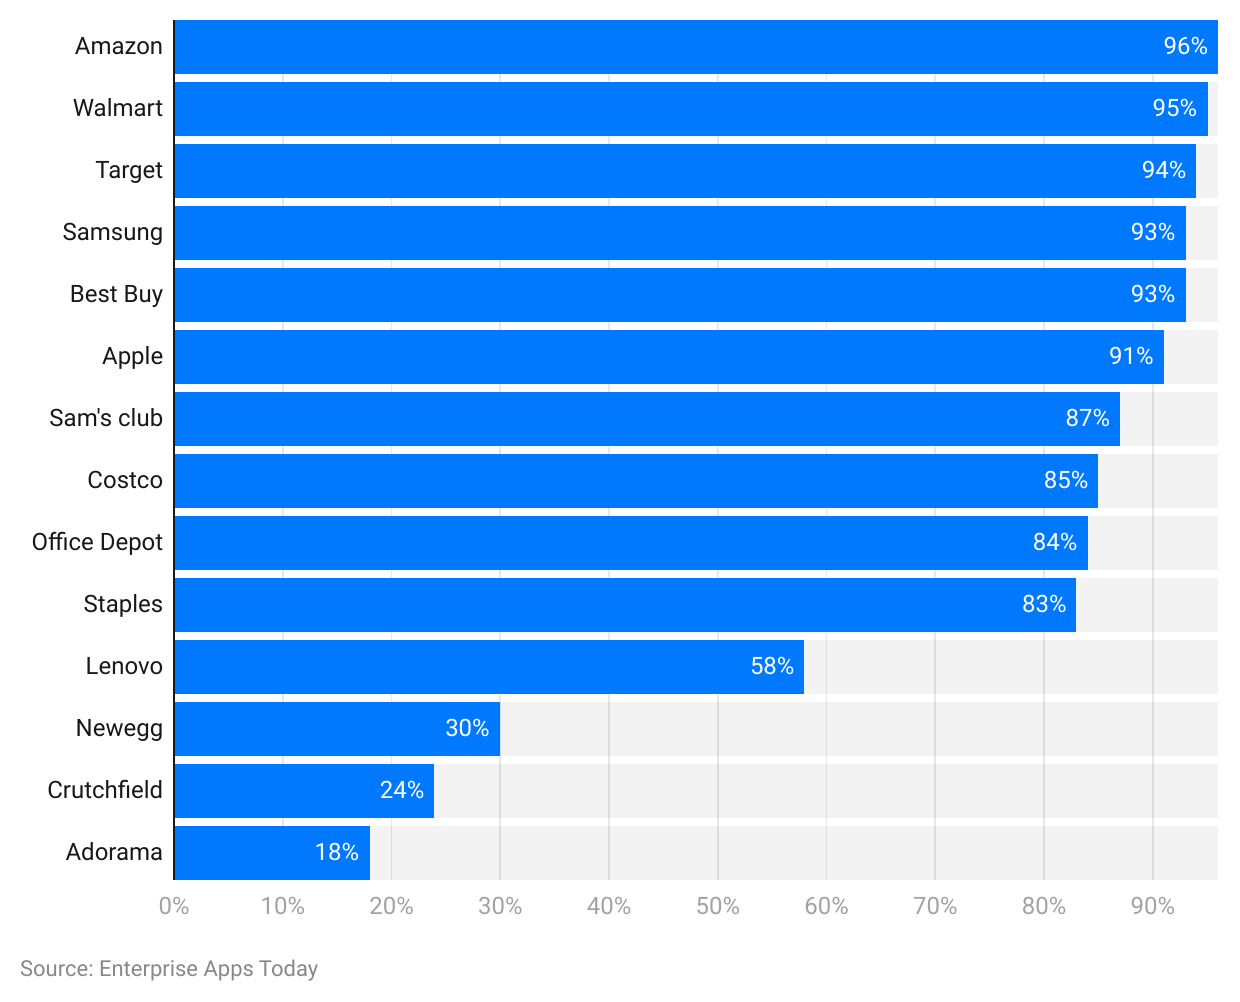
(Reference: statista.com)
Conclusion
The number of people who shop online daily is increasing day by day. Moreover, eCommerce platforms with small businesses are also landing their business on the internet. People get to buy quirky items, that many small-scale businesses are selling. One of the most interesting eCommerce websites Propshop24 is delivering the most unique as well as useful items for all occasions. Moreover, it is not only that you can buy products or goods, but also obtain services such as learning a language online, joining a cooking class, or earning a degree by distance learning. Moreover, you can also consult your doctor online and pay fees with wallets, isn’t everything fascinating these Online Shoppers Statistics are already showing?
Sources
FAQ.
Amazon, eBay, Etsy, Walmart, and Craigslist are some of the top online eCommerce websites in the United States of America in 2023.
Walmart+, Amazon Fresh, ThriveMarket, ButcherBox, and Imperfect Foods are some of the best platforms to buy doorstep delivery grocery services in the USA.
In the United States of America, the online shopping industry is expected to generate a revenue of $1,010,998.7 million by the end of 2023.
As an initial step, you are required to choose a domain name for the website. Having a domain name including a keyword is useful to attract more customers to the website. Once you register your domain name you can design your website and add eye catchy content. Optimizing the website for SEO purposes is important. Wix.com is a great tool to create websites.

Barry is a lover of everything technology. Figuring out how the software works and creating content to shed more light on the value it offers users is his favorite pastime. When not evaluating apps or programs, he's busy trying out new healthy recipes, doing yoga, meditating, or taking nature walks with his little one.