
Performance Management Statistics and Facts
Page Contents
Introduction
Performance management statistics: The article is about performance management statistics in the U.S., but before diving into the statistics, let’s discuss a brief understanding of the performance management system. The most widespread practice is performance management, which involves different performance enhancement strategies along with establishing both personal and organizational objectives. On the other side, PM Statistics is termed a strategic tool, and by 2022, it will have been accepted widely. In the United States performance management is estimated to reach US$1.2 billion in 2022. This article includes different essential factors and statistics for providing better insights about the topic.
Editor’s Choice
- In 2022, around 98% of American organization thinks that performance management is very crucial.
- As of 2023, 96% of employees promote positive responses for the regular feedback system.
- 85% of workers remained more engaged because of receiving feedback every week.
- 80% of workers prefer receiving feedback instantly rather than waiting for yearly evaluations in 2022.
- In 2022, almost 74% of workers didn’t receive effective feedback.
- The quality of the feedback employees receives needs to be changed suggested by 64%, in 2022.
- 63% of American companies were still depending on the annual evaluation process in 2022.
- In 2022, 55% of workers claim that yearly reviews don't help them perform better.
- In 2023, for receiving feedback 32% of employees are waiting for the last three months.
What is Performance Management?
This is a system of processes that allows for managing several different business performances, allows for setting individual goals, encourages teamwork, communication, and collaboration, enables a continuous employee support system, and helps in creating several development plans. To help the organization and also allow attaining all its long-term and short-term objectives, performance management is a continuous method that involves interaction between a manager and a worker within the particular workplace that takes place throughout the year. The main objective of this system is to make sure that employees are effectively operating throughout the year along with resolving several problems within the organization's employee performances.
Things Under Performance Management
- Allow for the development of effective leaders within organizations, promotes more employee engagement along with retaining talents.
- This PM system helps leaders to emerge within the organizations because of the continuous growth and partnership between employees and managers.
- Enabled more engagement of employees along with providing nine effective indicators of performance are analyzing absenteeism, customer experience, defects, employees safety factor, profitability, productivity, shrinkage, safety incidents, and turnover.
- Just because of this system, employees are more likely to stay with a company that allows regular catch up with management to assess their performances, helps in addressing address issues, and enables proper training.
- Reduce duplication of effort by ensuring every worker is contributing individually to achieving team, business, and departmental objectives.
Facts About Performance Management
- In 2022, American businesses had to face huge productivity losses of $ 450 – $ 550 billion annually.
- This loss is because 52% of U.S. employees have not remained engaged in their jobs, and another 18% were actively disengaged.
- In 2023, 94% of workers want their managers to provide them with proper feedback and opportunity for enhancing their performance level.
- Almost 81% of employees do not prefer regular feedback and go for quarterly updates from managers.
- According to the survey of employee engagement, it has been noted that performance reviews remained incomplete for about 62% of employees.
- 61% of employees still believe the procedure is too traditional.
- 74% of employees believe that receiving feedback more frequently would make them perform better.
- 80% of employees are working from home by the end of 2022 that is almost 34 million in number and it has been estimated to reach 63 million within the next 4 years.
- In 2022, employee development was mainly focused on American businesses which resulted in 47%.
- Around 48% of the United States organization remained constant in every performance aspect in 2022.
General Performance Management Statistics
- In 2022, weekly performance reviews helped 85% of employees to remain engaged in their workplace and 2% were disengaged.
- According to Clear Review’s report of 2022, about 65% of U.S. companies didn’t prioritize the system of performance management.
- As of 2023, these traditional performance management evaluations only satisfied 5% of managers.
- In 2022, the index of performance management dropped almost by 31%, which has reduced from last year.
- Only 48% of U.S. companies remained focused on the process of gaining effective productivity and engagement.
- In 2022, 81% of workers faced the fear of depression.
- 52% of employees confirmed in 2022, that managers remained very helpful.
- According to 2022 statistics, it has been noted that around 51% of employees prefer in switching their workplace.
- 2022 also reflected that this PM system enabled 68% of employee retention and 56% enhanced the recruitment process.
- Both in 2022 and 2023, only 2% of the U.S. companies give no value to the performance management system.
- In 2023, 79% of HR managers in the retail sector and 83% of HR managers in the financial sector believe in moving forward by focusing on this process along with continuous feedback exchanges with employees.
- 12% and 22% of American organizations focus more on production and focus more on employee behaviors respectively in 2023.
(Reference: 99firms.com)
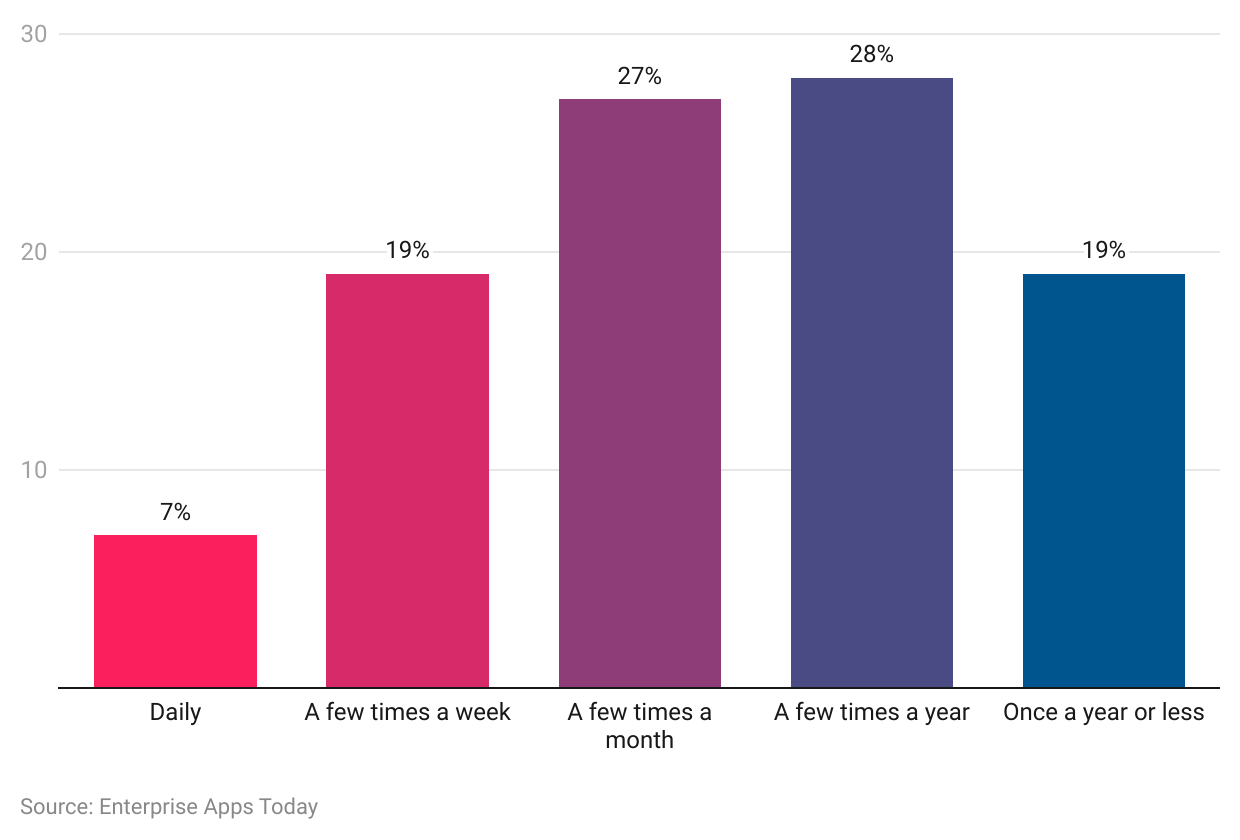
- The chart describes the overall distribution of employees receiving feedback from managers in the United States in 2023.
- 28% review a few times a year.
- 27% evaluation a few times in a single month.
- 19% of employees receive feedback a few times a week as well as the other 19% once a year.
- Only 7% are still receiving daily feedback.
(Reference: valamis.com)
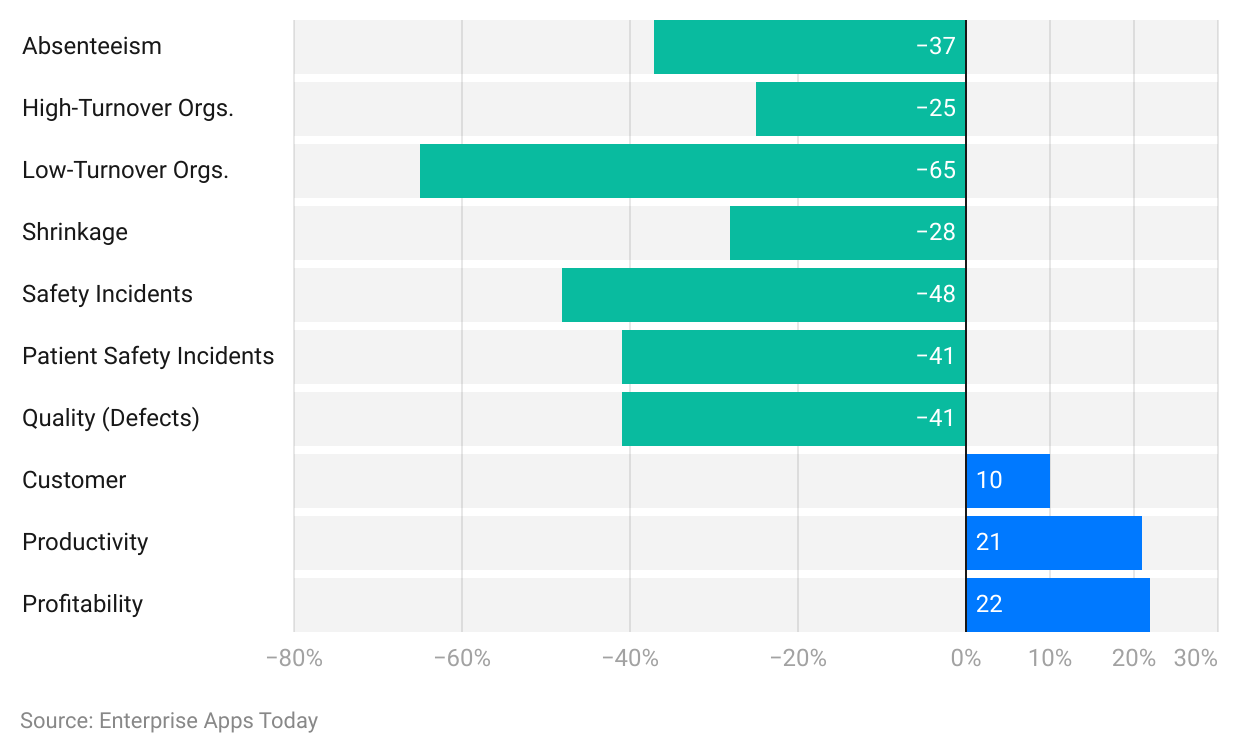
- The above graph explains employee engagement along with different indicators of performances of the U.S. companies in 2022-23.
- Only three indicators have resulted in positive outcomes profitability increased by 22%, productivity by 21%, and customer experience with 10%.
- Other indicators have reduced by 37% in absenteeism, 25% in higher turnover organizations, 65% in low turnover organizations, shrinkage by 28%, employees safety incidents by 48%, and defects by 41%.
(Reference: truelist.co)
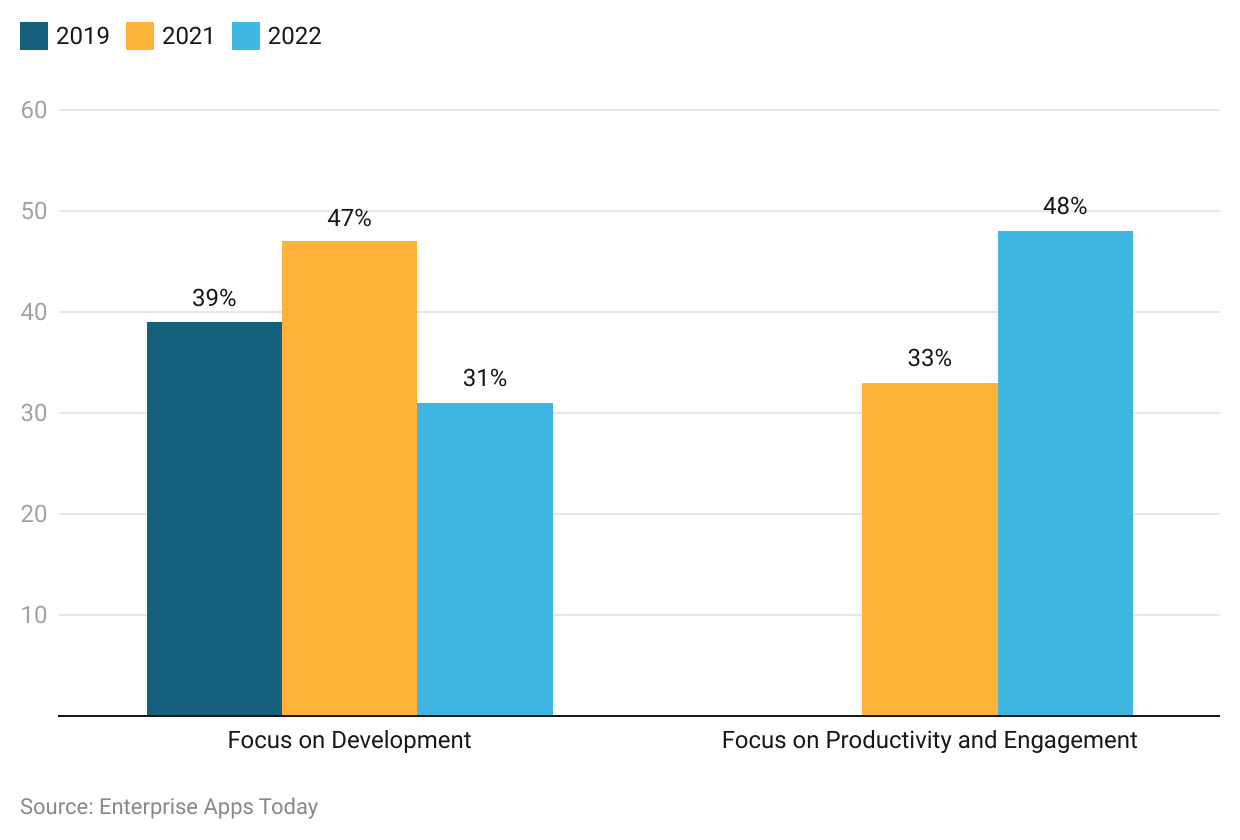
- The above graph describes American companies focusing on two segments left side is about development and the right side is on productivity and engagement in 2022.
- The focus on development was 47% which has decreased from the previous 2 years.
- The focus on productivity and engagement was 48% which has increased from 2021.
(Reference: passivesecrets.com)
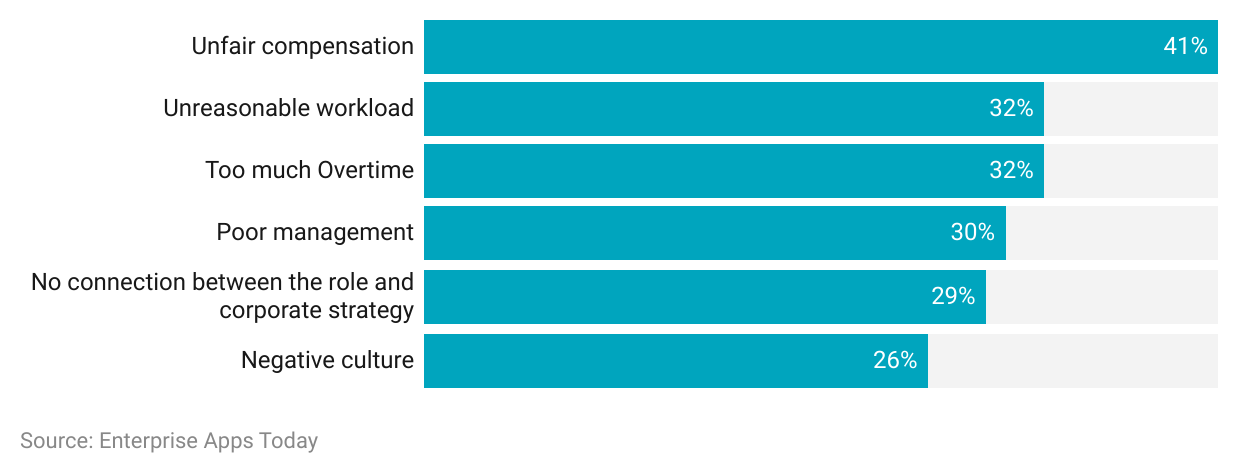
- The above graph explains the reason for the HR manager’s cause of depression in 2022.
- 41% of managers have been paid fewer payments or unfair compensation.
- 32% faced unreasonable workloads.
- 32% worked too much overtime.
- 30% suffered because of poor management systems.
- 26% had to face negative work culture.
(Source: pavestep.com)
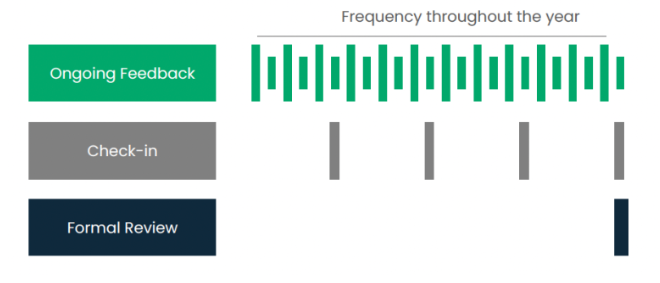
- The above graph represents the feedback frequency of the U.S. performance management in 2022.
- The formal review feedback system on average done once a year.
- The check-in feedback system on an average of 4 times a year.
- The ongoing feedback process has been practiced many times in a year.
(Reference: pavestep.com)
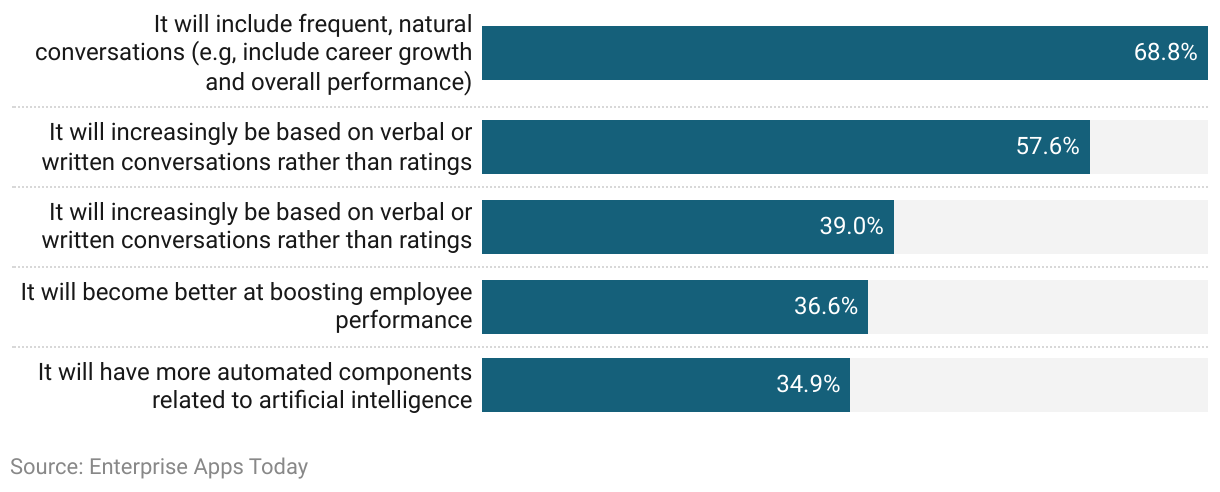
- The above graph represents a survey analysis done on June 2022, by many HR professionals in America that shows the performance management of the coming 3-5 years.
(Reference: passivesecrets.com)
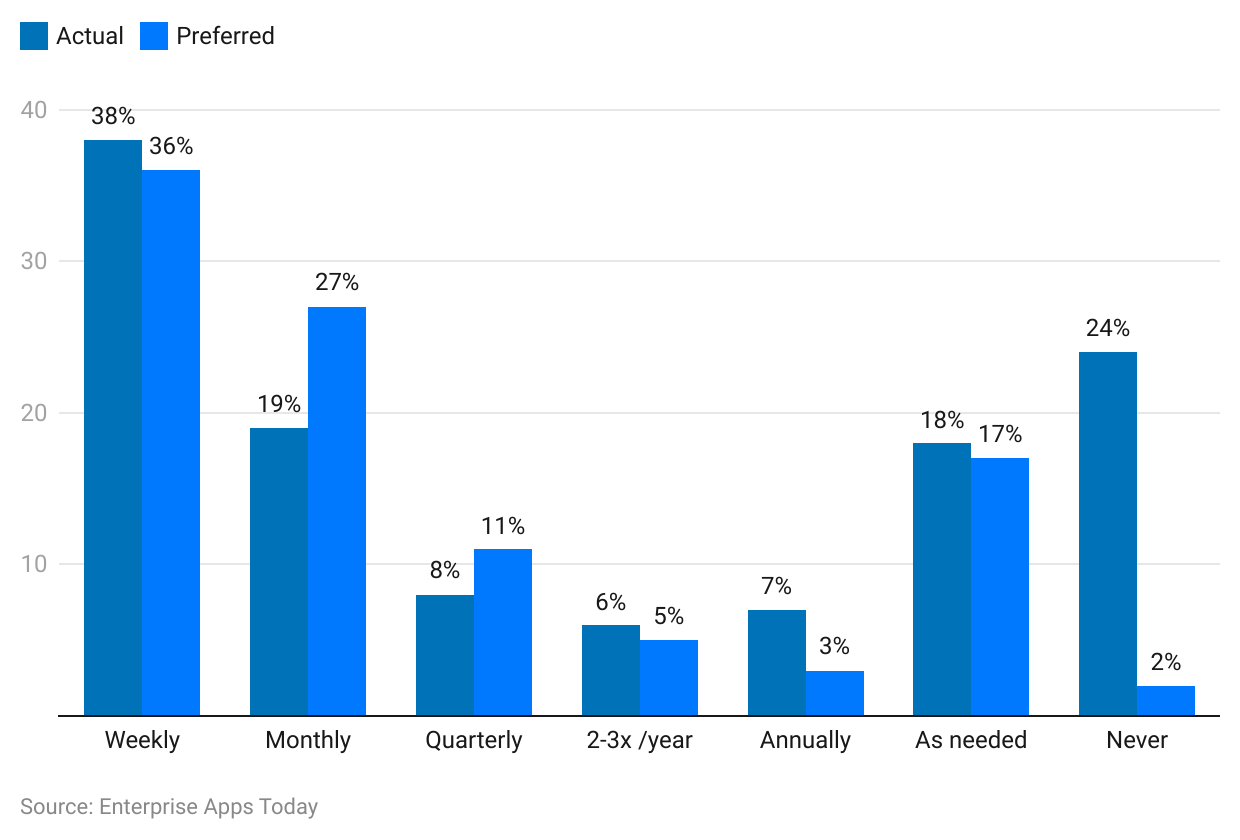
- The above graph represents the continuous performance conversations in which one-third of workers prefer each week one-on-one interactions in 2022.
- The weekly actual employee-manager conversation was 2% more than preferred with 38%.
- Actual monthly conversations were 19%, which is even less than preferred.
- The quarterly conversation was 8%.
- Annual and 2-3 years conversations were 7% and 6% respectively.
- 18% of employees make conversation only if needed.
- 24% with zero conversation.
(Reference: quantumworkplace.com)
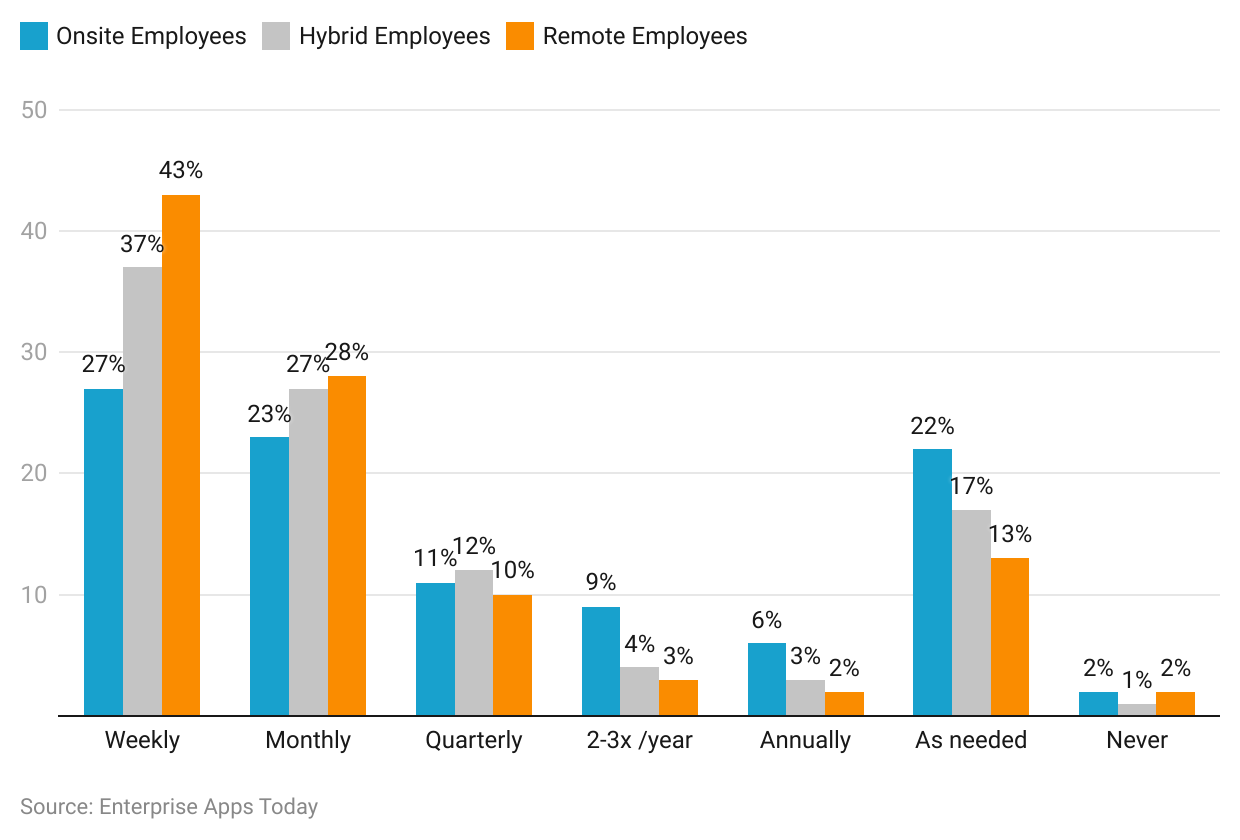
- The above graph describes different types of employees and their one-to-one preferences in 2022 U.S. companies.
- This figure explains about three types of employees onsite, hybrid and remote.
- Weekly: onsite-27%, hybrid-37%, remote-43%
- Monthly: onsite-23%, hybrid-27%, remote-28%
- Quarterly: onsite-11%, hybrid-12%, remote-10%
- Annually: onsite-6%, hybrid-3%, remote-2%
- If needed: onsite-22%, hybrid-17%, remote-13%
- Never: onsite-2%, hybrid-1%, remote-2%
(Reference: 99firms.com)
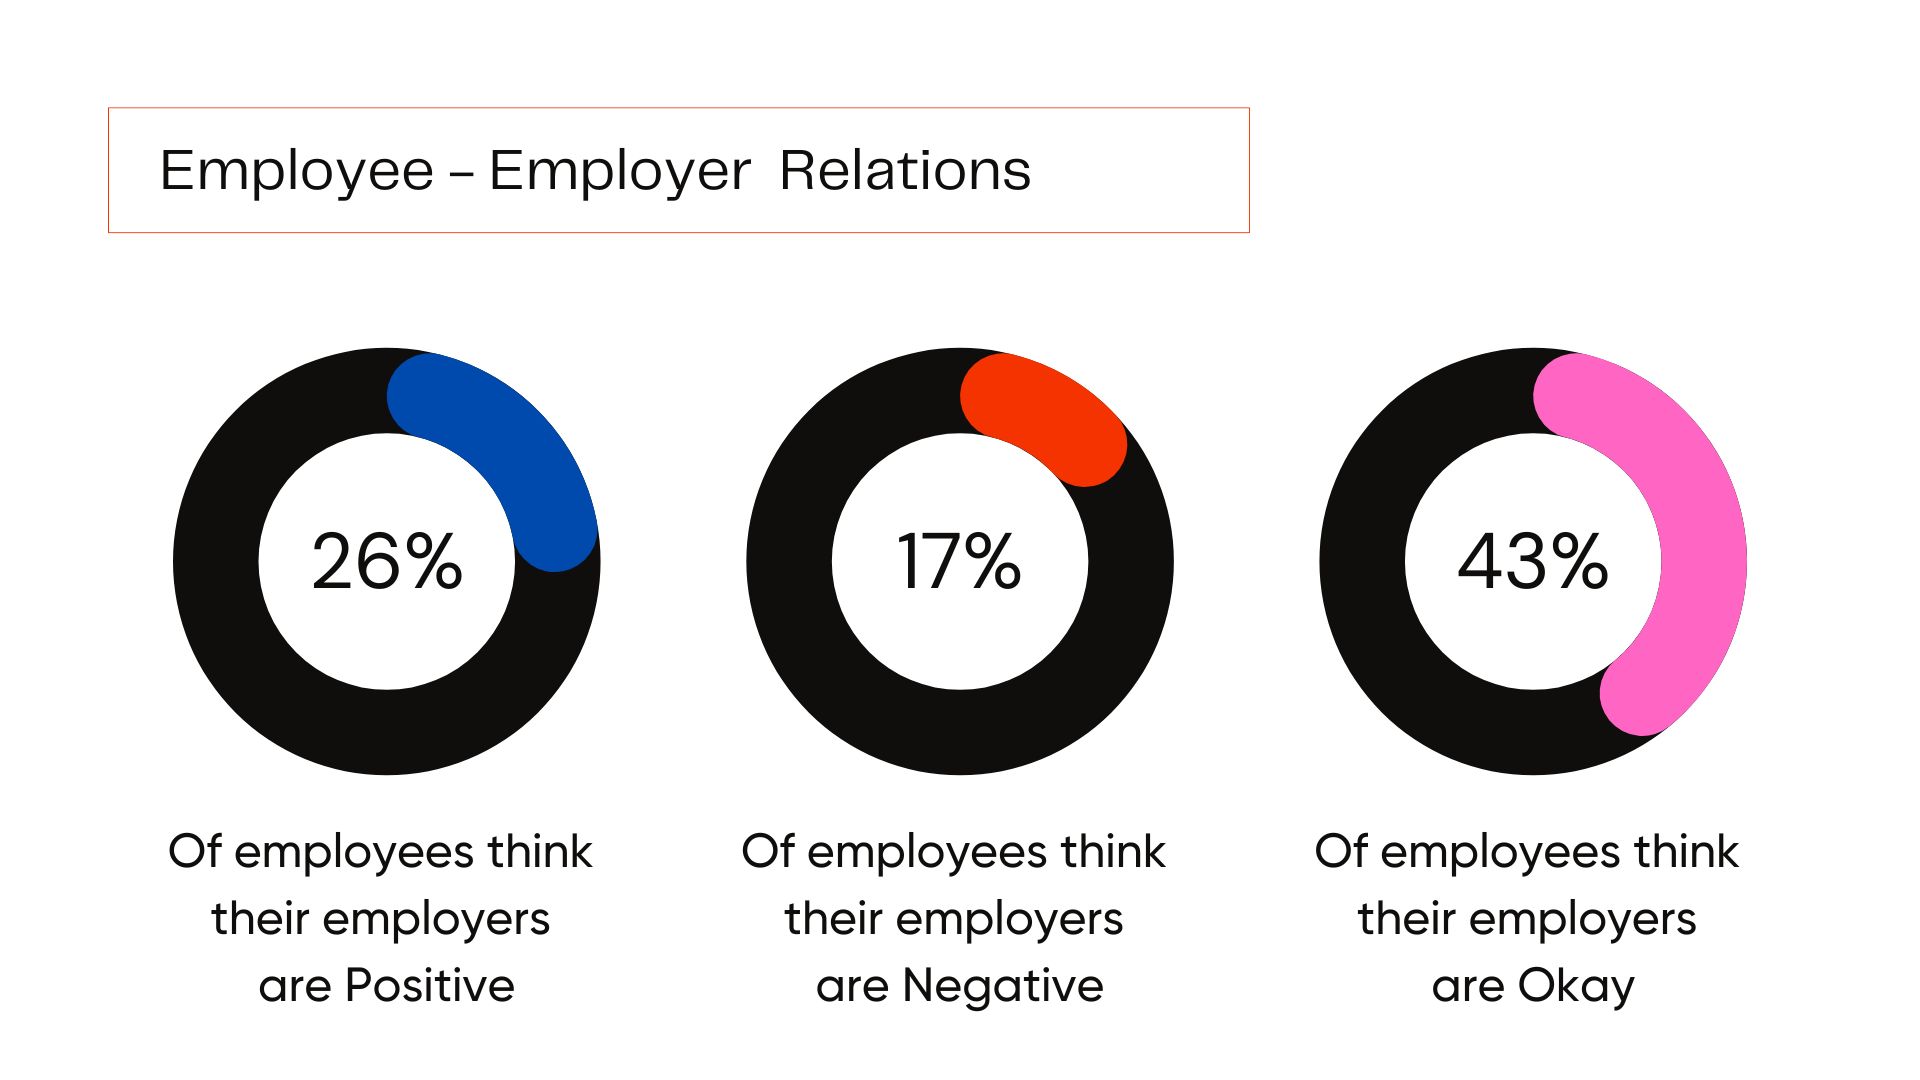
- The above graph represents the relationship between employees and employers in 2023.
- 26% of employees agree that they have positive relations with their employers.
- 43% of employees are having normal relation with employers that is neither positive nor negative.
- 17% of employees are having negative relations with their employers.
(Reference: 99firms.com)
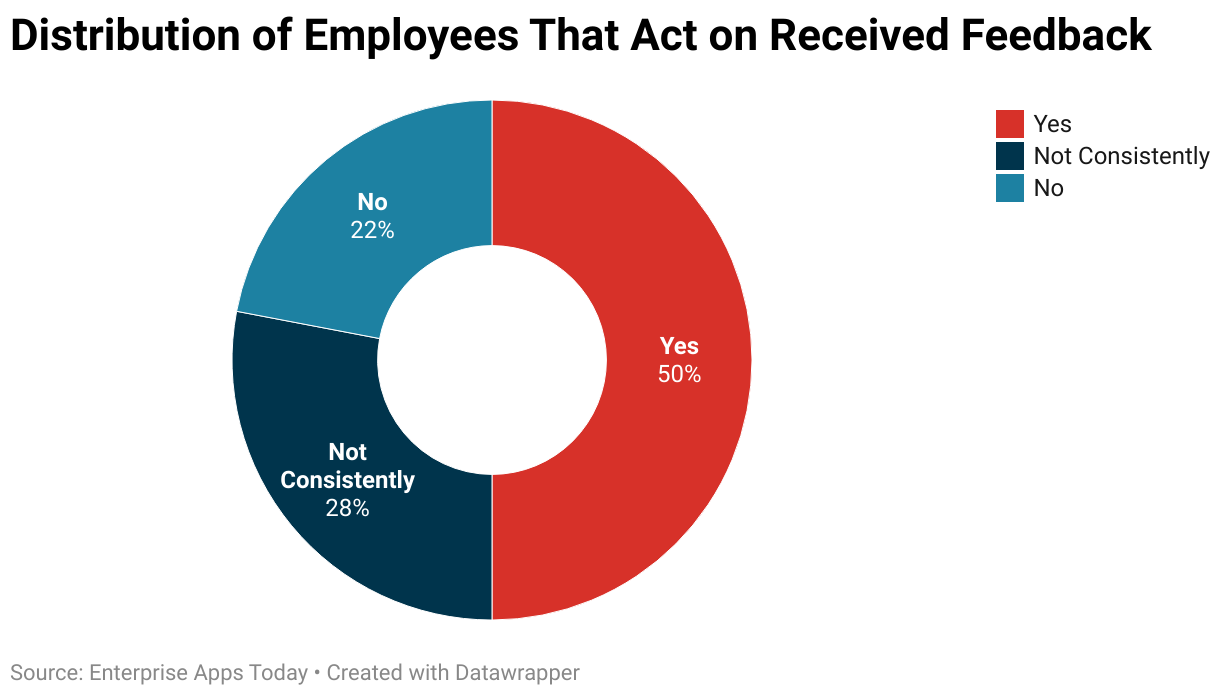
- The above graph is a distribution chart of American employees who acts after receiving feedback.
- 50% of active employees responded yes and only act on received feedback.
- 22% of employees never act on feedback.
- 28% of employees are not consistent, some time results positive and negative both simultaneously.
(Source: passivesecrets.com)
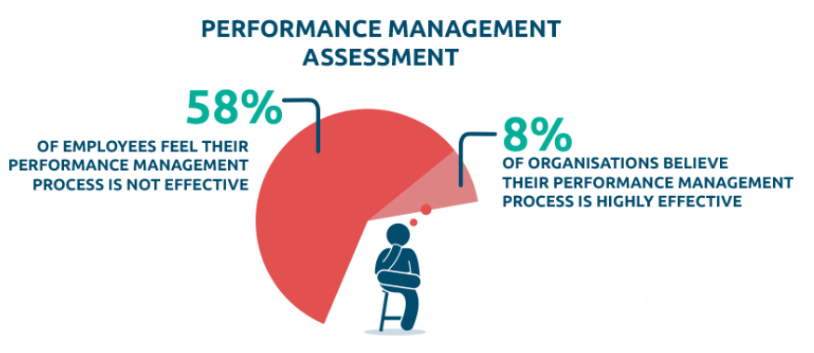
- The above graph represents the assessment of performance management in 2022.
- Only 8% of American organizations voted for the process of performance management as highly effective.
- 58% of organizations think that this process is very ineffective.
(Source: teambuilding.com)
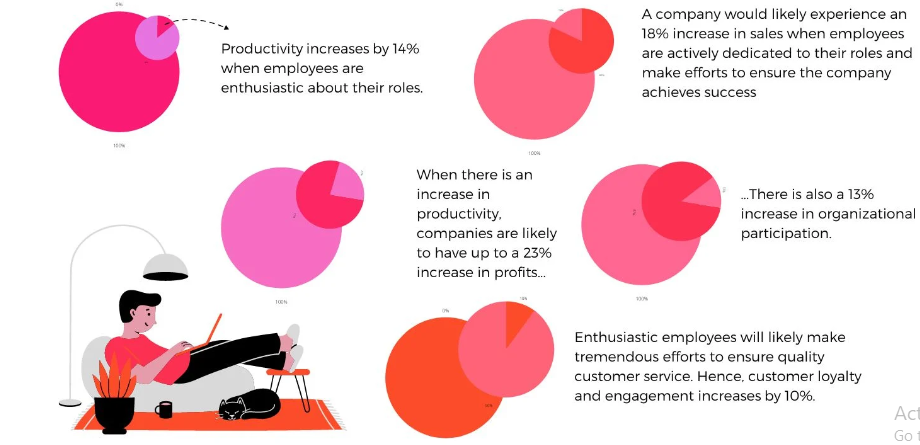
- The above graph represents the management statistics of employee engagement in enhancing overall performance in 2023.
- Productivity increased by 14% because of effective employee engagement.
- As productivity has increased thus, overall profit increased by 23%.
- Active employee performances helped in gaining around 18% of higher sales rate.
- Organizational participation has increased almost by 13%.
- This also says that 10% of engagement has increased positively.
(Reference: gallup.com)
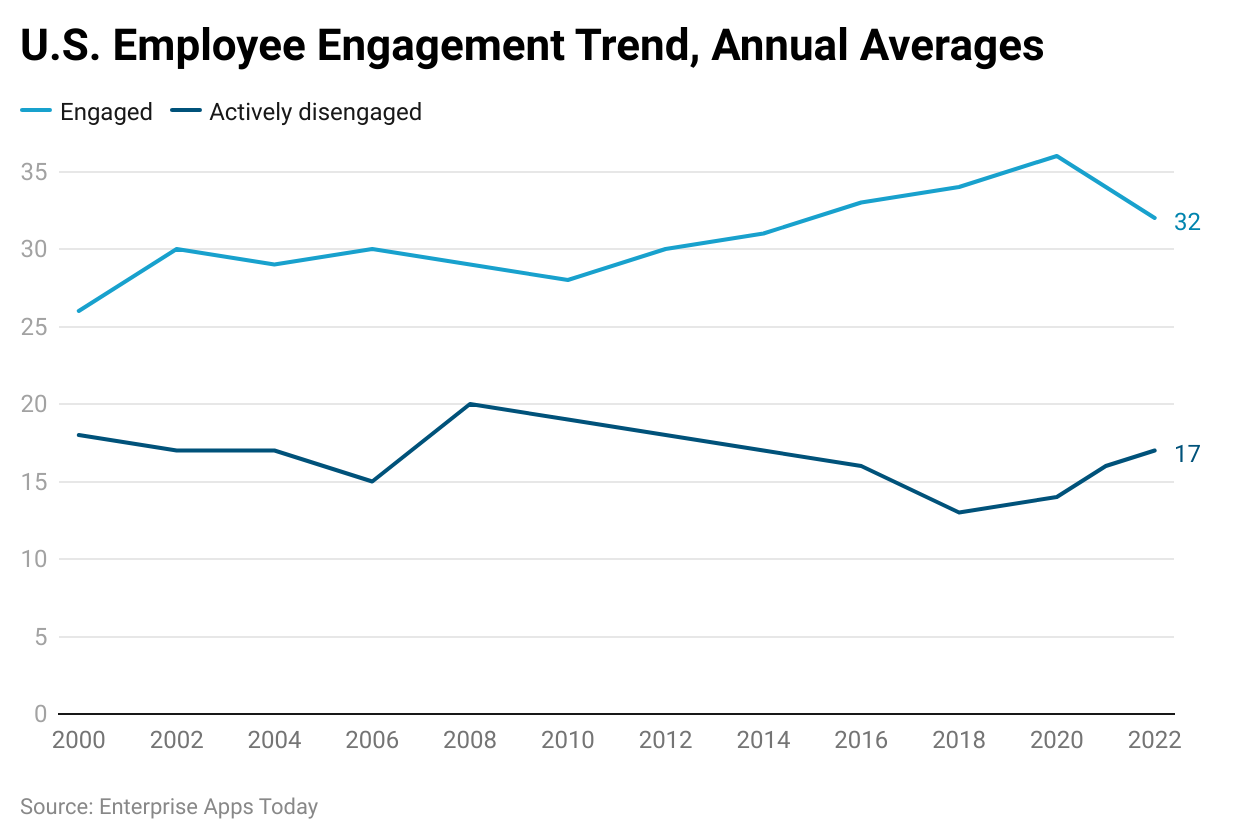
- The above chart represents the U.S. annual employee engagement in 2022.
- Currently, 32% of full- and part-time workers for companies are involved more actively.
- Compared to the previous year, 17% of people were actively disengaged with an increase of 1%.
(Source: teambuilding.com)
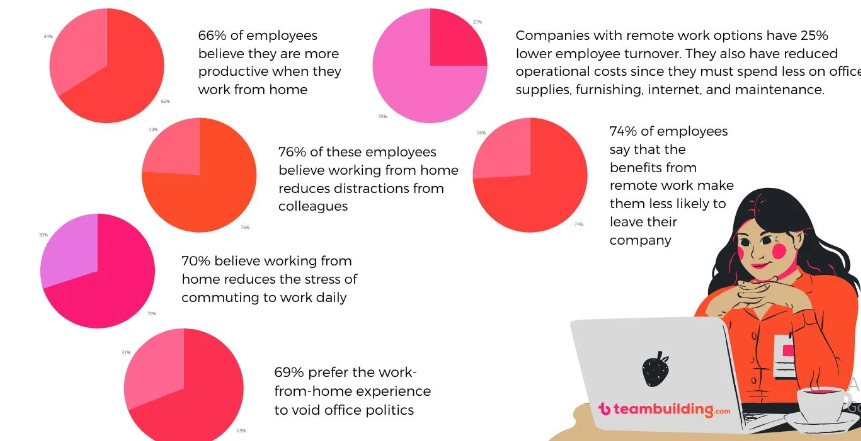
- The above figure describes the performance statistics of American companies’ remote work experience in 2022.
- 66% of employees who work from home results more productive.
- 76% think working from home minimizes workplace distractions.
- 70% prefer remote work for reducing stress.
- 69% avoid office work to stay away from workplace politics.
- 74% of workers believe that remote work made them more comfortable to work with the company for a long time.
(Source: empxtrack.com)
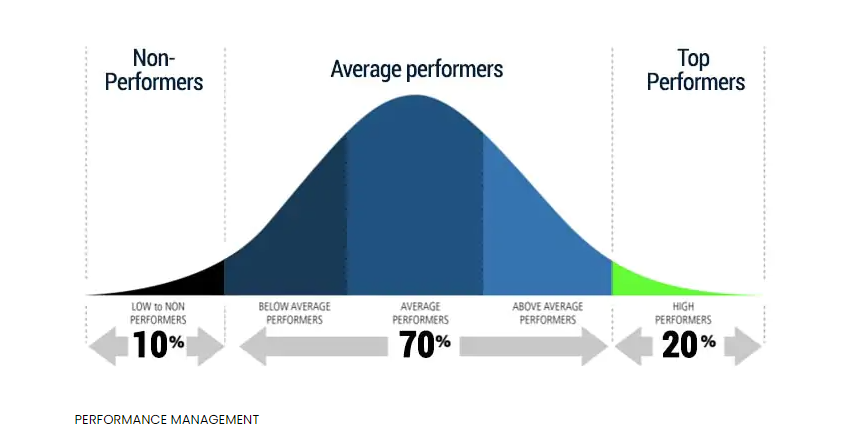
- The above figure is termed a bell graph of American employees’ performance management in 2022-23.
- 10% of employees are termed as low or nonperformers.
- 20% of employees are known as top or high performers.
- 70% of employees are a combination of average, above-average, and below-average performers.
Conclusion:
After completing the report on performance management statistics, it has been clear that this process not only allows for the setting of individual goals, and encourages teamwork, communication, and collaboration, but also helps in enhancing organizational performances along with carrying out the different objectives and missions of the organizations.
In 2022, 98% of American organizations will think that performance management is very crucial. Thus, according to performance management statistics, frequent, high-quality feedback is an essential component of improved employee performance, which will ultimately lead to better business results. The article also includes different important graphs and charts attached above that will provide a clear understanding of the topic.
FAQ.
This is a continuous process that takes place between the manager and employees of every organization. Effective communication and feedback are the two important section of this process that allow in achieving goals of organizations
This facilitates internal equity by establishing transparency, allow in encouraging participation by integrating every employee's contributions, and also influence upcoming performances for enhancing the overall American businesses to grow with new opportunities and supports.
The performance review procedure is used for all full-time and part-time eligible and ineligible employees.
This process takes place all through the year and is also termed as an ongoing process.

Barry is a lover of everything technology. Figuring out how the software works and creating content to shed more light on the value it offers users is his favorite pastime. When not evaluating apps or programs, he's busy trying out new healthy recipes, doing yoga, meditating, or taking nature walks with his little one.