
Sales Funnel Statistics By Category, Software, Conversion Rates, Experience, Industries, Consumers, Landing Pages and Lead Nurturing
Page Contents
- Introduction
- Editor’s Choice
- Facts About Sales Funnel Statistics
- General Statistics
- Basic Information on The Sales Funnel
- Sales Funnel Statistics by Category
- Sales Funnel Statistics by Software
- United States Sales Funnel Statistics
- Sales Funnel Statistics by Conversion Rates
- Sales Funnel Conversion Statistics by Experience
- Sales Funnel Statistics by Industries
- Sales Funnel Statistics by Consumers
- Sales Funnel Statistics by Landing Pages
- Sales Funnel Statistics by Lead Nurturing
- Sales Funnel Statistics by Region-Wise Conversion
- Online Shopper’s Conversion Statistics by Region
- Conclusion
Introduction
Sales Funnel Statistics: As of the report, a sales funnel is an effective part of the business and is termed as a part of marketing strategy along with enabling leads into effective paying customers and enhancing the buying process of businesses. These statistics also allow managers to take smart decisions and for improving the rate of customer acquisition although the business. As marketing sales and strategy is changing enormously across the world thus sales funnel statistics help business marketers for staying up-to-date with relevant figures for visualizing customer’s journey along with analyzing business and identifying improvement areas.
Editor’s Choice
- In 2022, the sale funnel was measured by 68% of companies and 32% doesn’t measured. Thus 79% of marketing leads were not able to convert into sales.
- In 2022 a good sales funnel conversion rate range was 3.1% to 5%.
- A single sales funnel-building technology is used by 570,000 sites.
- Improving the sales funnel rate was being prioritized by 48% of worldwide marketers.
- Only 5% of salespersons have believed that marketing allows for gaining effective and quality leads.
- The most popular sales funnel-building tool is ‘ClickFunnel’ and the market share is covered by 55% in 2022.
- Both teams of marketing and sales need to coordinate in a balanced way and just because of this indifference worldwide businesses have lost around 65% of customers.
- Sales funnels in 2022 have improved the landing page conversion rates by 1.1%.
- 2.35% was the average rate of landing page conversion and the average conversion rate of pages with one call-to-action was 13.50%.
Facts About Sales Funnel Statistics
- As per social proof testimonials, celebrity endorsements, and recommendations of expert product analysis it has been observed that 60% of customers purchased products only with 4-star ratings.
- Increments in email engagement rate have been planned by 54% of marketers.
- The site conversion rate has increased user-generated user-generated content by above than 200%.
- The average conversion rates of the e-commerce industry have increased by 1.84% in 2023.
- The sales funnel allowed them to convert their leads and contacts into customers was agreed by 69% of business marketers.
- Maintaining existing customers or customer retention is more effective than obtaining new customers.
- Selling products to existing customers’ probability is higher than new customers almost by 3 to 35 times.
- Whereas the chance of making a sale with a return rate is more on old customers by 60%-70% and the rate for new customers was 5%-20%
- Driving up the brand awareness sales funnel allows for generating leads which have enabled 37% of missed conversion expectations.
General Statistics
- As of 2022, it has been observed that 68% of companies didn’t identify or attempted to measure the sales funnel rate.
- On average 70% to 95% of revenue comes from renewals and upsells in which (10-30) % revenue of the e-commerce site was generated by upsells.
- Around 40% of revenue was earned by store owners from the sales funnel
- Articles and blog posts are the most effective way that allow in enhancing the prospects by sales funnel which has been agreed by 55% of companies across the world.
- As of 2023, only 1% of people in the worldwide business industry have generated revenue through a sales funnel above $1 million.
- Sales funnels in 2022 have improved the landing page conversion rates by 1.1%.
- A single sales funnel-building technology is used by 570,000 sites.
- In the Tripwire sales funnel, the average conversion rate of order bumps was 40%.
- Sales funnel marketing strategy was believed by 71% of marketers across the world.
Basic Information on The Sales Funnel
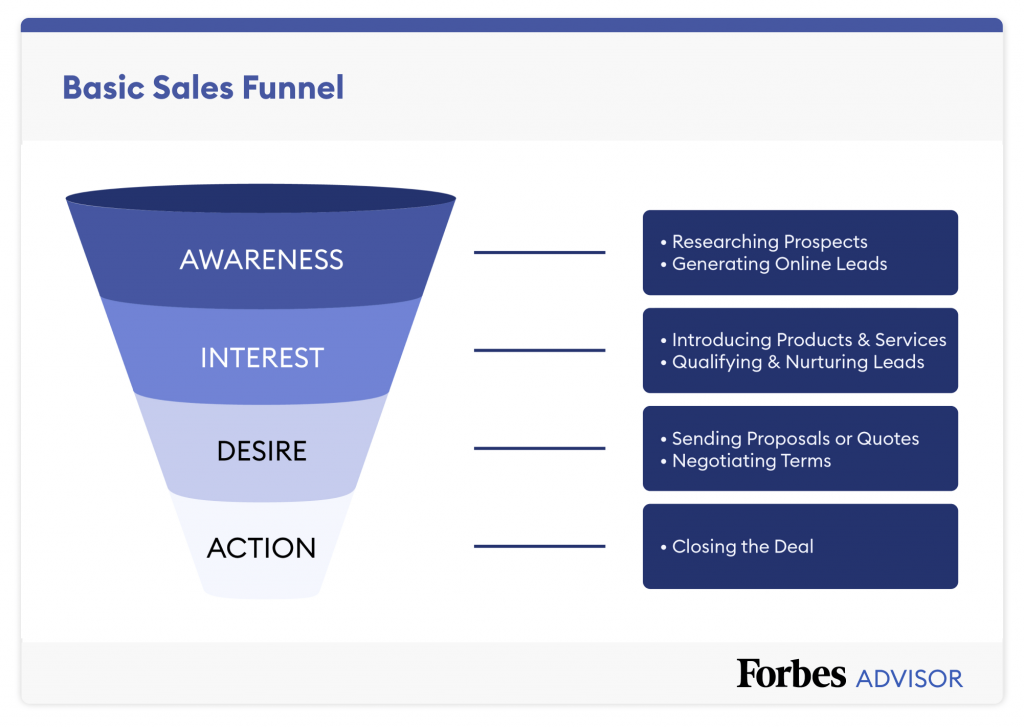 (Source: forbes.com)
Sales Funnel Statistics by Category
- This is termed as one of the crucial aspects of every business’s marketing strategy which allows in breaking down the journey of customers in different layers.
- There are five important types of sales funnel used by modern businesses the lead magnet funnel, the tripwire funnel, the webinar funnel, the product launch funnel, and the high-ticket funnel.
- The most preferred type of sales funnel for businesses is the lead magnet funnel as it allows for capturing leads along with building up strong relationships with potential customers.
- The tripwire funnel allows for converting leads by offering high-value products at lower costs.
- The webinar funnel covers its leads by providing customers with live or recorded webinar sessions by enabling proper explanations before selling products.
- The product launch funnel is designed basically for creating excitement and buzz among paying customers which includes pre-launch emails, content on social media, and video for upcoming product launching.
- The high ticket funnel is designed especially for selling high-priced products which involve phone calls and personal meetings.
Sales Funnel Statistics by Software
- As of 2022 the top popular sales funnel tool or technology was Click Funnels which was having almost 319,900 websites.
- The other technology and number of websites used are followed by Optimize Press (56,900+), Builderall (54,000+), Keap (37,800+), Kajabi (34,000+), Groove Funnels (14,500+), Kartra (14,100+), Ontraport (9,800+), Cart Flows (8,300+), Deadline Funnel (7,300+).
- The biggest sales funnel builder was Click Funnels with 55.81% market share which is followed by Optimize Press (9.92%), Builderall (9.42%), Keap (6.59%), and others (18.3%).
- The monthly pricing of sales funnel software in 2023 is Click Funnels: Basic ($97)and Platinum ($297); HubSpot Lead Management: Starter ($50), and Professional ($890); Kartra: Starter ($99), Silver ($199), Gold ($299), and Platinum ($499); Kajabi: Growth ($199), Basic ($149), and Pro ($399); Thrive Suite: Pro ($99), and Standard ($49); GetResponse Conversion Funnel: Free ($0), Email marketing ($19), Marketing automation ($59), and E-commerce marketing ($119).
United States Sales Funnel Statistics
- The faster loading time of pages (0-2) seconds allows for ensuring the best performance of the sales funnel and enables better conversion rates.
- The highest engagement has been achieved by short and entertaining videos in which embedding video on a landing page allows an increase of 80% conversion rates.
- On a daily basis, 91% of consumers in the United States have used emails rather than social media. It has also been observed that email is 40% more effective than Twitter and Facebook.
- American e-commerce businesses have preferred email marketing as a vital source and 42.3% have subscribed to email lists for getting discounts on several purchases.
- The purchasing decision was influenced by promotional emails, agreed by 68% of the U.S. millennial.
Sales Funnel Statistics by Conversion Rates
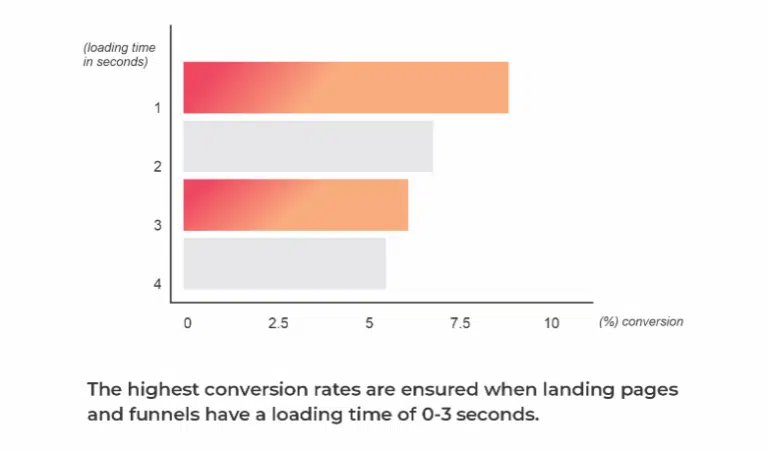 (Source: passivesecrets.com)
- The landing time between 0-3 seconds of landing pages and funnels allows for ensuring the highest conversion rates.
- In 2022, the conversion rate ranges from 3% to 7% of the average sales funnel.
- The loading time of the e-commerce site was 2.5 times more conversion rates than others having 5 seconds of time.
- The conversion rate is calculated by total conversions/total funnel leads * 100.
- On the first visit, almost 96% of website visitors were not ready to buy any products by the end of 2022.
- Across worldwide 75% of industries the average landing page conversion rate was 2.35% and for the other 25% of industries with 5.31% on the other hand conversion rates of 11.45% are termed as best landing pages.
- In 2022, the conversion rate of mobile e-commerce was 2% which was driving the overall e-commerce traffic by 68%.
- The traffic source was paid searched by 2.9% is the maximum average sales funnel conversion rate.
- In July 2022 the average conversion rate of the e-commerce market segment increased by 19.63% from last year and the average e-commerce conversion rate was 3.65%.
Sales Funnel Conversion Statistics by Experience
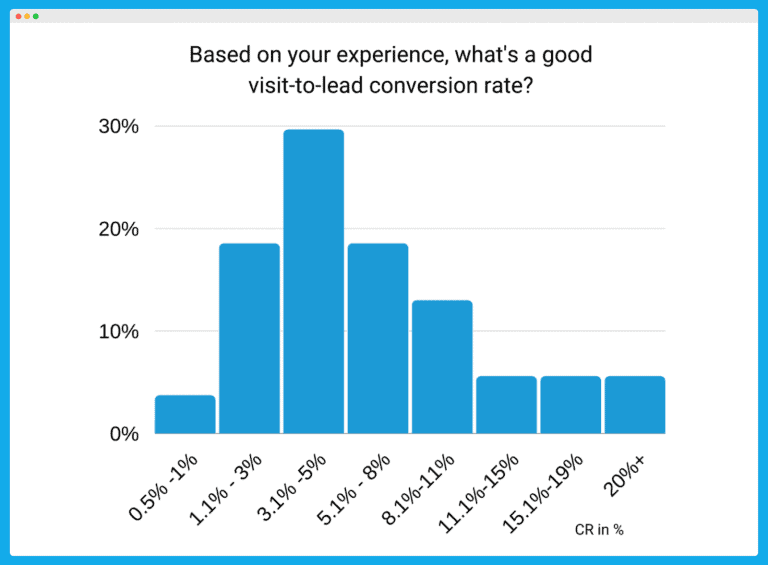
(Source: khrisdigital.com)
- In 2022 a good sales funnel conversion rate range was 3.1% to 5% which was experienced by 30% of worldwide businesses.
- Around 18% of businesses have experienced conversion rates of (5.1% – 8%) and (1.1% – 3%) both.
- The other conversion rates of the sales funnel are followed by (0.5% – 1%) = experienced by 4% of businesses, (11.1% – 15%), (15.1% – 19%), and (above 20%) = experienced by 5% of businesses.
Sales Funnel Statistics by Industries
- By the end of 2022, the highest conversion rate by sales funnel was generated by ‘Catering and Restaurants industry with 9.8%
- Furthermore, other types of industries with average sales funnels conversion rates followed by Media and Entertainment (7.9%), Finance and Insurance (6.2%), Education (5.8%), Fitness and nutrition (5.6%), legal (5.4%), E-commerce (5.2%), Events and Leisure (5.2%), Travel (4.8%), Home Improvement (3.8%), Medical services (3.6%), Business Services (3.5%), Family Support (3.4%), Software as a service (3%), Real Estate (2.8%), and Agencies (2.4%).
- Worldwide business by 22% remained satisfied with effective conversion rates.
- The industry of professional/financial services at 10% was termed as the highest B2B average sales funnel conversion rate and the lowest conversion rate by the non-profit industry at 2%.
Sales Funnel Statistics by Consumers
- In 2022 the two main queries raised by 200% through mobile devices were ‘where to buy’ and ‘near me’.
- In the case of buying online products and services across the world almost 51% of buyers have searched on Google, followed by Google Image (25%), YouTube (18%), and Yahoo (16%).
- Shopping through mobile helped in deciding which retailers and brands are preferable as a variety of options is available said 59% of shoppers.
- Before purchasing products 95% of online shoppers went through online product reviews.
- In the case of deciding brand or retailer 85% of consumers preferred product image and information.
- Before believing 63% of consumers wanted to hear about the company’s claim by 3 to 5 times.
Sales Funnel Statistics by Landing Pages
(Source: passivesecrets.com)
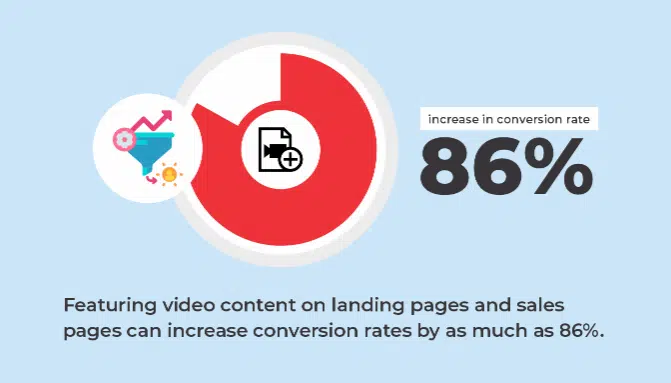
- Landing pages and sales pages featuring video content allowed in increasing the rate of conversion by 86%.
- Every e-commerce product page must include 4-5 videos and more than 8 images which were preferred by buyers of age groups between 18-24 years and 35-44 years.
- Funnels and landing pages allow for featuring better social proof convert by 1.10%.
- 78% of top landing pages include locations in title pages, 36% of landing pages feature testimonials, and 30% of landing pages include featured testimonials.
- Out of overall visitors on particular websites, only 20% of visitors focus on the content, and the rest 80% just go through the headline.
- Testing and targeting helped in increasing the conversion rate of the sales funnel by 300%.
- The conversion power was 1.6% more on those landing pages only with 1 Call-To-Action (CTA) which resulted in 13.5% of visitors and 2 or 4 CTA allow in converting 11.9% of visitors.
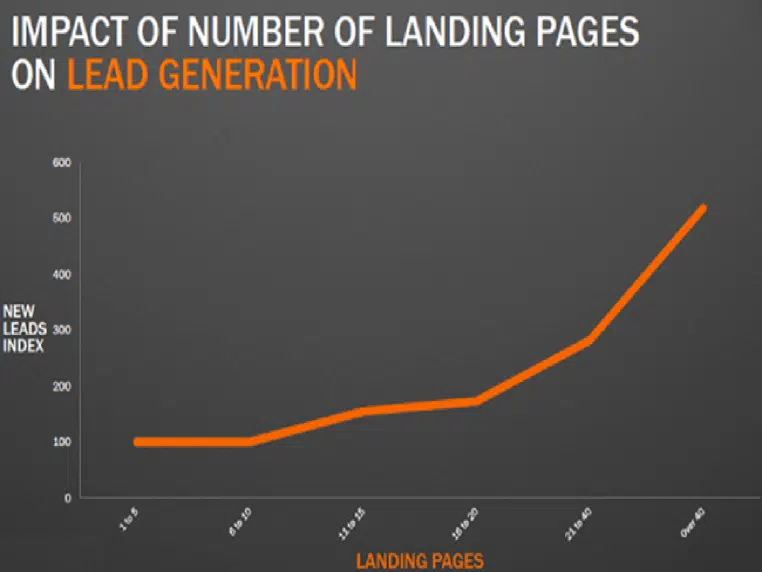
- In 2022, companies with more than 30 landing pages helped in generating 7 times more leads than usual, and 40 landing pages generated 12 times more leads.
- A/B split testing is known as one of the highly valuable ways of testing landing pages which have been used by 60% of overall businesses.
- To date, reliable testing methods were never used in more than 20% of businesses.
- Landing pages and sales pages featuring video content allowed in increasing the rate of conversion by 86%.
- Every e-commerce product page must include 4-5 videos and more than 8 images which were preferred by buyers of age groups between 18-24 years and 35-44 years.
- Funnels and landing pages allow for featuring better social proof convert by 1.10%.
- 78% of top landing pages include locations in title pages, 36% of landing pages feature testimonials, and 30% of landing pages include featured testimonials.
- Out of overall visitors on particular websites, only 20% of visitors focus on the content, and the rest 80% just go through the headline.
- Testing and targeting helped in increasing the conversion rate of the sales funnel by 300%.
- The conversion power was 1.6% more on those landing pages only with 1 Call-To-Action (CTA) which resulted in 13.5% of visitors and 2 or 4 CTA allow in converting 11.9% of visitors.
- In 2022, companies with more than 30 landing pages helped in generating 7 times more leads than usual, and 40 landing pages generated 12 times more leads.
- A/B split testing is known as one of the highly valuable ways of testing landing pages which have been used by 60% of overall businesses.
- To date, reliable testing methods were never used in more than 20% of businesses.
Sales Funnel Statistics by Lead Nurturing
 (Source: passivesecrets.com)
- According to sales funnel statistics, around 79% of leads never converted into sales and 73% of overall leads were not ready for leads in 2022.
- 63% of generated leads take at least 3 months and 20% of leads take more than 1 year for enquiring about the business before starting investment in products.
- 33% lower costs businesses allowed in nurturing leads by enhancing 50% more sales leads.
- Higher Click-Through-Rates with 8% have generated by emails for lead nurturing whereas, the average CTR was only 3%.
- 55% more leads were generated by 10-15 landing pages.
- Across the world, half of the budget was spent on lead generation by 53% of marketers, and less amount of the budget was spent by only 34% of marketers by the end of 2022.
- Automation marketing helped in generating more leads by 80% of marketers and 20% never used automation in 2023.
- As of 202, the main challenges faced for generating leads were 55% budget constraints, 22% of timing, 13% of decision making, and 10%.
Sales Funnel Statistics by Region-Wise Conversion
 (Source: zohowebstatic.com)
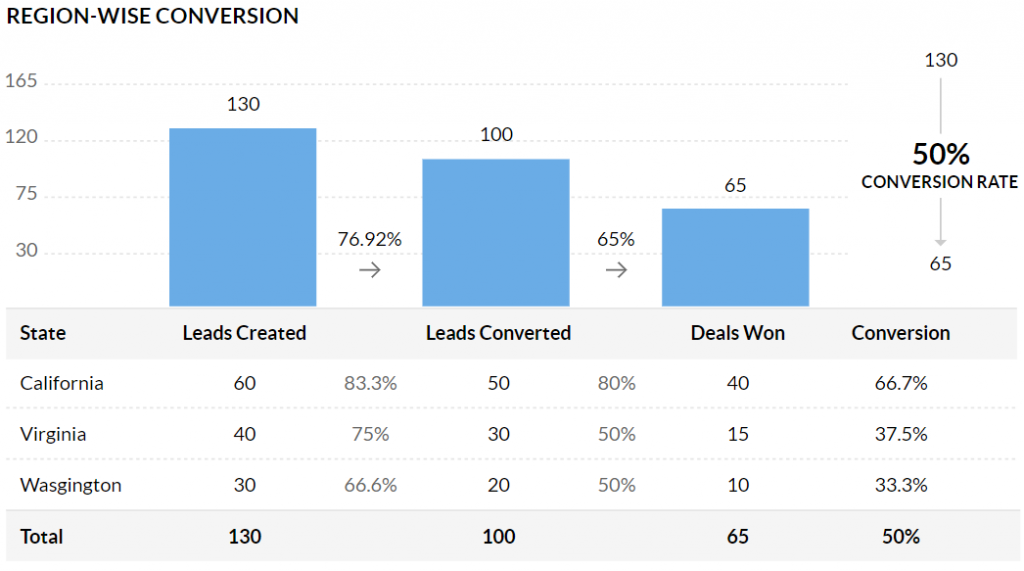
- In 2022, the United States' total created leads was 130 by states followed by California (60), Virginia (40), and Washington (30).
- Out of which converted leads were reduced by a 76.92% conversion rate resulting total of 100 leads followed by states California 83.3% (50), Virginia 75% (30), and Washington 66.6% (20).
- The final total deal won leads was 65 which are distributed in California (40), Virginia (15), and Washington (10). Thus the total conversion rate of the sales funnel turned out to be 50%.
Online Shopper’s Conversion Statistics by Region
 (Source: statista.com)
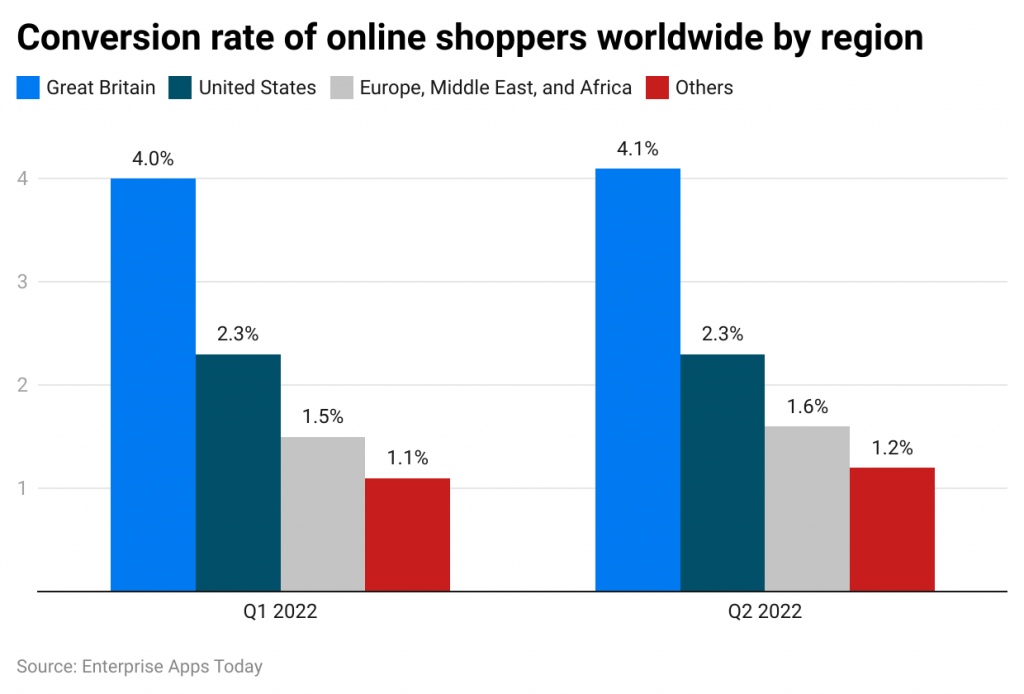
- In the 1st quarter of 2022, the highest conversion rate of online shoppers was observed in Great Britain with 4% which is followed by the United States (2.3%), Europe, the Middle East, and Africa (1.5%), and others (1.1%).
- Whereas, in the 2nd quarter of 2022 the conversion rates have increased in Great Britain (4.1%), the United States (2.3%), Europe, the Middle East, and Africa (1.6%), and others (1.2%).
Conclusion
As of now after completing the article on Sales Funnel it is clear that the industry has enhanced a lot since the previous year. Funnel statistics help in creating appropriate and exact content for customers and allow in driving up the conversion rates of businesses. A sales funnel is segmented into four important stages such as awareness, interest, consideration, and action. These articles include some important statistics that will provide basic knowledge about the sales funnel basically for those who have recently been involved within a business.
Sources
FAQ.
There are 5 important challenges faced by sales funnel were generating more leads, rising above the market noise, creating persuasive content, reducing the sales cycle, and tracking performance metrics accurately.
The basic and important activity of sales funnel is to manage correctly the connection between the sales and marketing section which allow in offering effective leads.
Funnel optimization allow in improving the funnel based data in cases if there is any kind of leakage and issues are available. This helps in finding best path for figuring out effective ways to take proper action.

Barry is a lover of everything technology. Figuring out how the software works and creating content to shed more light on the value it offers users is his favorite pastime. When not evaluating apps or programs, he's busy trying out new healthy recipes, doing yoga, meditating, or taking nature walks with his little one.