
Smart City Statistics 2023 By Companies, Market Share, Prioritized Areas and Country Rank
Page Contents
- Introduction
- Editor’s Choice
- Pros and Cons of Smart Cities Statistics
- Facts of Smart City Statistics
- Smart City Statistics of India
- The Top Smart Cities Statistics by Companies
- Smart Cities Statistics by Prioritized Areas
- Smart City Statistics by Country Rank
- Components of Smart City
- Future Statistics of Smart City
- Global Smart Home Statistics
- Global Smart Manufacturing Statistics
- Global Smart Government Statistics
- Global Smart Transportation Statistics
- Global Smart Agriculture Statistics
- Conclusion
Introduction
Smart City Statistics: The world is developing enormously with advanced technology, not only the smart device industries are increasing but also many cities around the world are evolving with smart technologies. What exactly does a smart city consist of? Which cities are termed as smart? This article on Smart City Statistics includes several insights from different studies and reports that will guide you effectively so, that you can get a clear vision.
According to a report published by Google states that the market size of the Smart City industry is expected to reach $10.27 trillion by the end of 2032.
Editor’s Choice
- In the United States revenue generated by Smart Cities is expected to be $0.27 billion by 2023.
- The global revenue share of the market is expected to reach $1.48 trillion by the end of 2023, and$10.27 trillion by 2032.
- The compound annual growth rate (CAGR) is 25.9% between the years 2023 to 2028.
- In the year 2023, the expected spending on the global Internet of Things is around $1.1 trillion.
- Consumer spending on smart home systems is predicted to be $123 billion and expected technology spending on Smart city initiatives is around $124 billion.
- 54.4% of houses are going to be included under smart home technology in the United States by 2023.
- The global largest market of the Smart Home industry is carried out by the USA with a 35% share.
- In 2023, the smart home industry is going to ship more than 68 million smart speakers.
- Around the world, almost 70% of consumers are expecting to implement smart home appliances by the end of 2023.
- The main reason for implementing smart home as it provides effective energy management claimed by 45% of smart home users.
- By the end of 2026, within the global Smart City, there will be more than 300 million smart homes.
Pros and Cons of Smart Cities Statistics
- Every feature includes some positive and negative impacts within its implementation thus, in the case of smart cities.
- The pros are reduced pollution, less traffic congestion, greater public safety, improved energy efficiency, better service delivery, and efficient resource usage.
- The cons are greater dependency on technology, higher values of properties, greater impersonality, increased citizen privacy concerns, and huge investments.
Facts of Smart City Statistics
- A Smart City consists of smart home systems, smart energy systems, smart waste management solutions, smart monitor and managed traffic systems, smart healthcare facilities, smart teaching for the fast learning process, digital libraries, tech-oriented community services, etc with IoT technologies connected through smart devices.
- By 2050, around 60% of the global population is supposed to be under the initiative of Smart Cities. Cities are going to be reshaped by advanced technology, modern connectivity with urban essence, and enhanced infrastructure.
- According to Smart City Statistics, investing in smart city technology is an effective use of taxpayer money said 55% of American investors.
- The fastest-growing application of smart cities is “Lighting” with a CAGR of 24.4% by the end of 2026. Automated and responsive lighting systems are an effective part of intelligent solutions in transforming cities smarter.
- As of 2023, Europe is the leading country with 170 smart city initiative projects.
- In the United States, 66% of cities are currently investing in different technologies for smart city projects.
- In the era of high-technology urban living, China is also planning to build more than 500 smart cities by the end of 2023.
- Automotive vehicles are a part of smart cities and by the end of 2030, almost 2/3rd of the traffic is going to be formed by these vehicles.
- The main objective of a 50% smart city is supposed to be strategies for climate change mitigation by 2025.
- Around the world, 93% of smart cities are in the early stage of development.
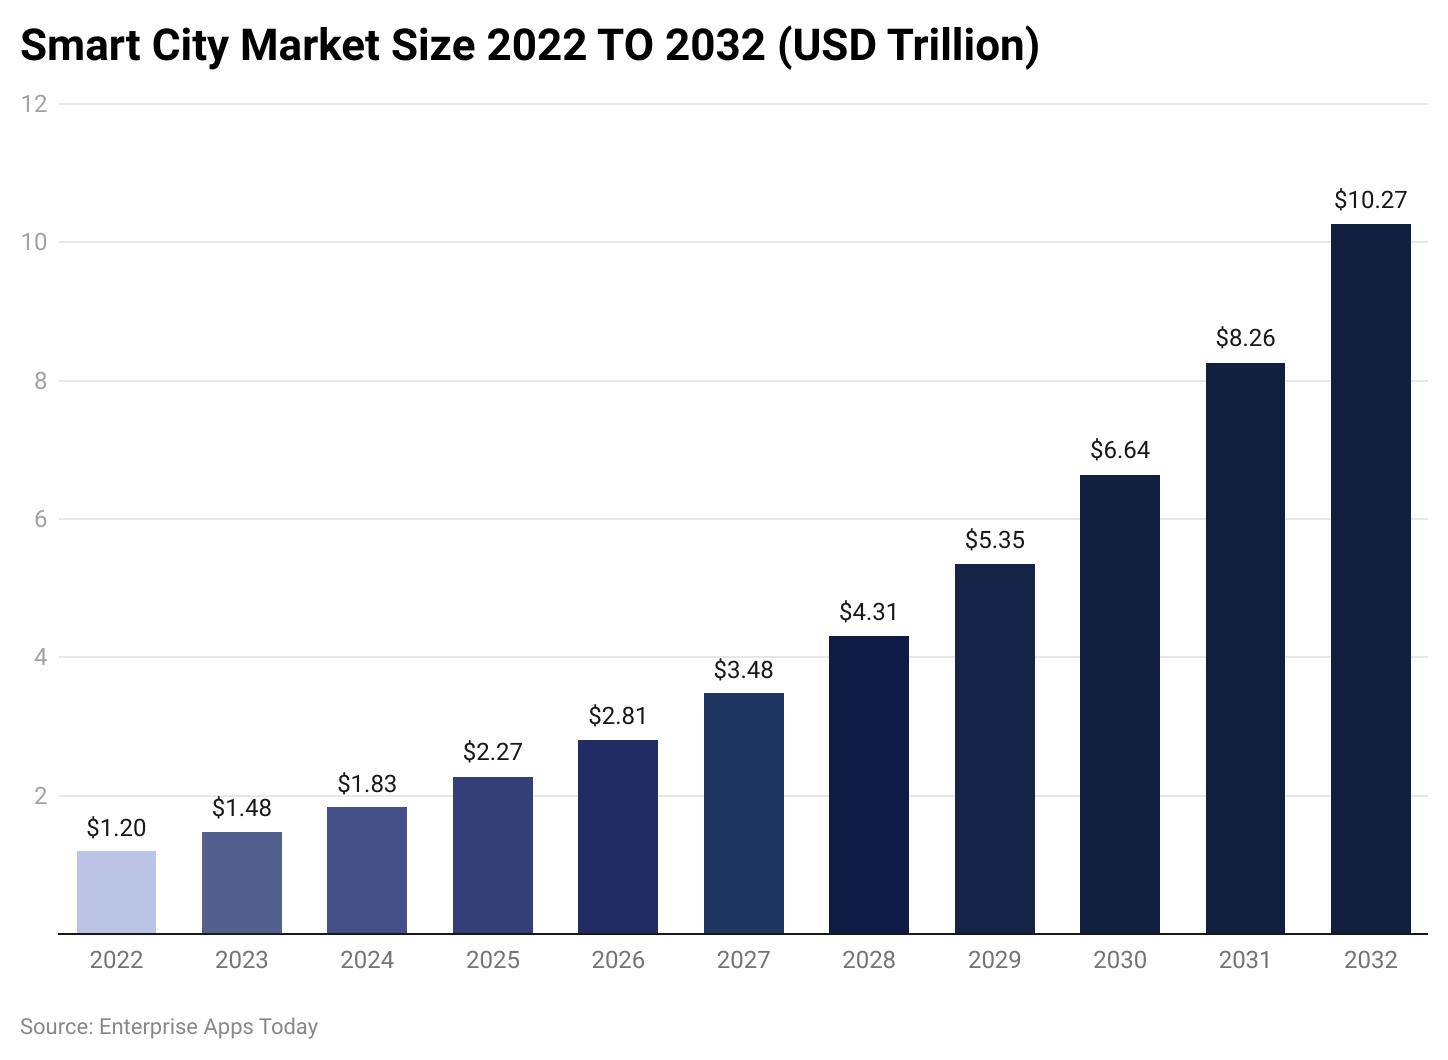
11 years Analysis of Smart City Statistics by Market Share From 2022 to 2032
 (Reference: precedenceresearch.com)
- As of 2024, revenue generated by Smart Cities is going to be $1.83 trillion around the world which has increased by 21% from last year. (Precedence Research)
- In coming years expected market size of the marketplace is followed by 2024 ($1.83 trillion), 2025 ($2.27 trillion), 2026 ($2.81 trillion), 2027 ($3.48 trillion), 2028 ($4.31 trillion), 2029 ($5.35 trillion), 2030 ($6.64 trillion), 2031 ($8.26 trillion), and 2032 ($10.27 trillion).
- The major operating players of smart cities are IBM, Cisco, Siemens, Microsoft, Hitachi, Huawei, Schneider Electric, Intel, ABB, NEC, and AGT International.
- The market size in the United States is expected to be $0.27 trillion by the end of 2023 and $1.85 trillion by 2032 with a CAGR of 24% starting (2023-2032).
- The highest CAGR is expected in the Asia Pacific region is above 27.9% starting during the forecasted year.
- The total smart cities market size remains highest in the North American segment is around 32.1%.
Smart City Statistics of India
- Indian Prime Minister Narendra Modi inaugurated the ‘Smart City Mission’ in the year 2015.
- In Indore, the National Smart Cities Mission Convention was organized on the 26th and 27th of September 2023.
- The total funding of the government in the mission is around Rs. 7, 20,000 crore.
- From a report published by Wikipedia, it has been observed that by September 2023, a total of 7960 smart city projects have been tendered worth around $171,432 crore i.e., $21 billion.
- Cities that are going to develop as smart cities are Port Blair, Vishakapatnam, Tirupati, Kakinada, Amravati, Pasighat, Guwahati, Muzaffarpur, Bhagalpur, Biharsharif, Patna, Chandigarh, Raipur, Bilaspur, Naya Raipur, Diu Dadra & Nagar Haveli, Silvassa, New Delhi Municipal Council, Panaji, Gandhinagar, Ahmedabad, Surat, Vadodara, Rajkot, Dahod, Karnal, Faridabad, Dharamshala, Shimla, Srinagar, Jammu, Ranchi, Mangaluru, Belagavi, Shivamogga, Hubballi Dharwad, Tumakuru, Davangere, Bengaluru, Kochi, Trivandrum, Kavaratti, Bhopal, Indore, Jabalpur, Gwalior, Sagar, Satna Ujjain, Nashik, Thane, Greater Mumbai, Amravati, Solapur, Nagpur, Kalyan-Dombivali, Aurangabad, Pune, Pimpri Chinchwad, Imphal, Shillong, and many others.
The Top Smart Cities Statistics by Companies
- As of 2025, the smart cities market size is expected to be $2.57 trillion with a CAGR of 22.9% around the world.
- In recent years, the global spending on IoT on Smart City is going to reach $1.1 trillion.
- The CAGR in the implementation of AI in smart city applications is expected to be 30.6% by 2025.
- The top 10 leading smart city solution companies are Clarity, Enevo, Inscape Data, Intron, OpiAid, ParkWhiz, Premise Data, Quantela, Sensus, and Smart Rain.
Smart Cities Statistics by Prioritized Areas
(Reference: imd.org)
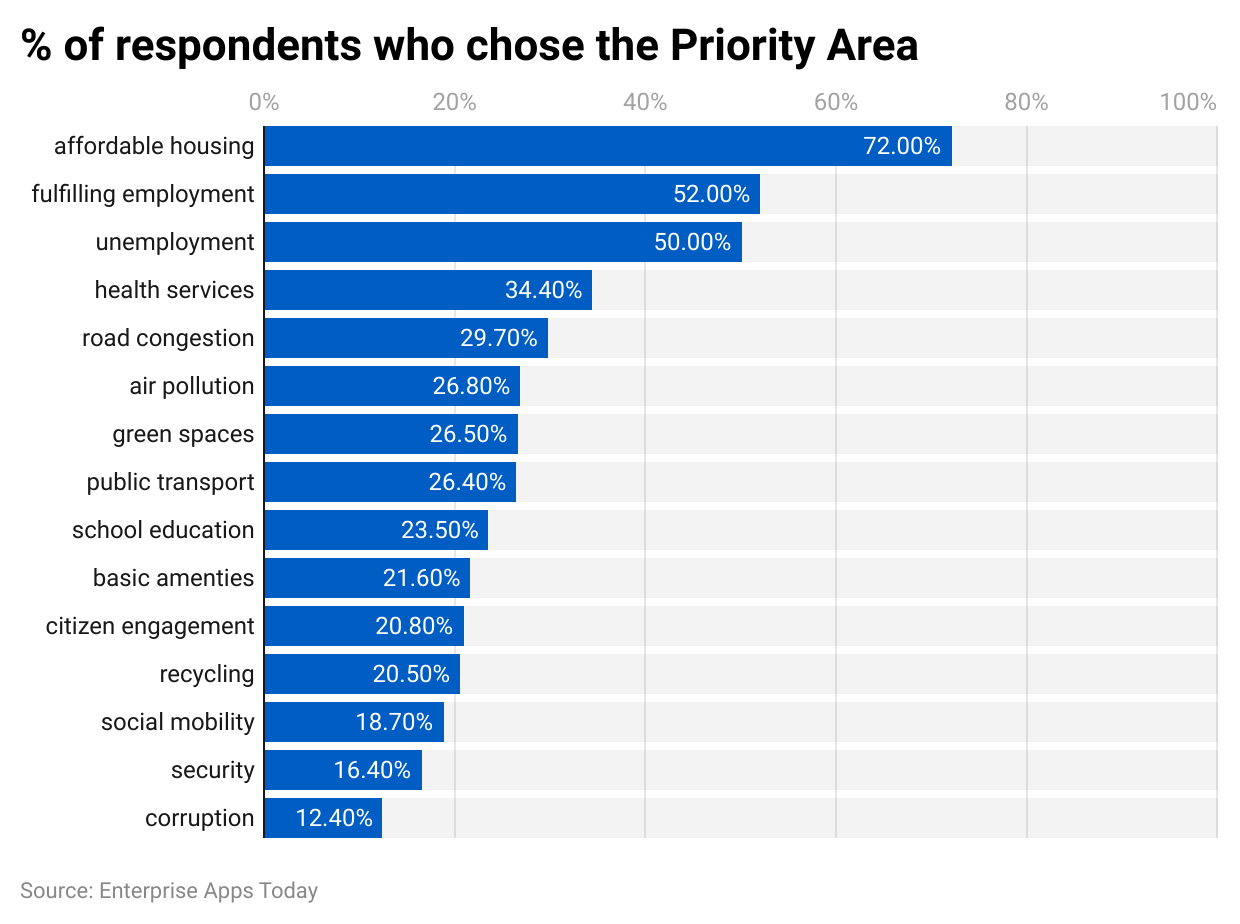
- The above graph describes the 15 indicators by different survey respondents around the world that are required for developing a smart city.
- 72% of respondents preferred affordable housing, others priority areas by respondents share are followed by fulfilling employment (52%), unemployment (50%), health services (34.4%), road congestion (29.7%), air population (26.8%), green spaces (26.5%), public transport (26.4%), school education (23.5%), Basic amenities (21.6%), citizen engagement (20.8%), recycling (20.5%), social mobility (18.7%), security (16.4%), and corruption (12.4%).
Smart City Statistics by Country Rank
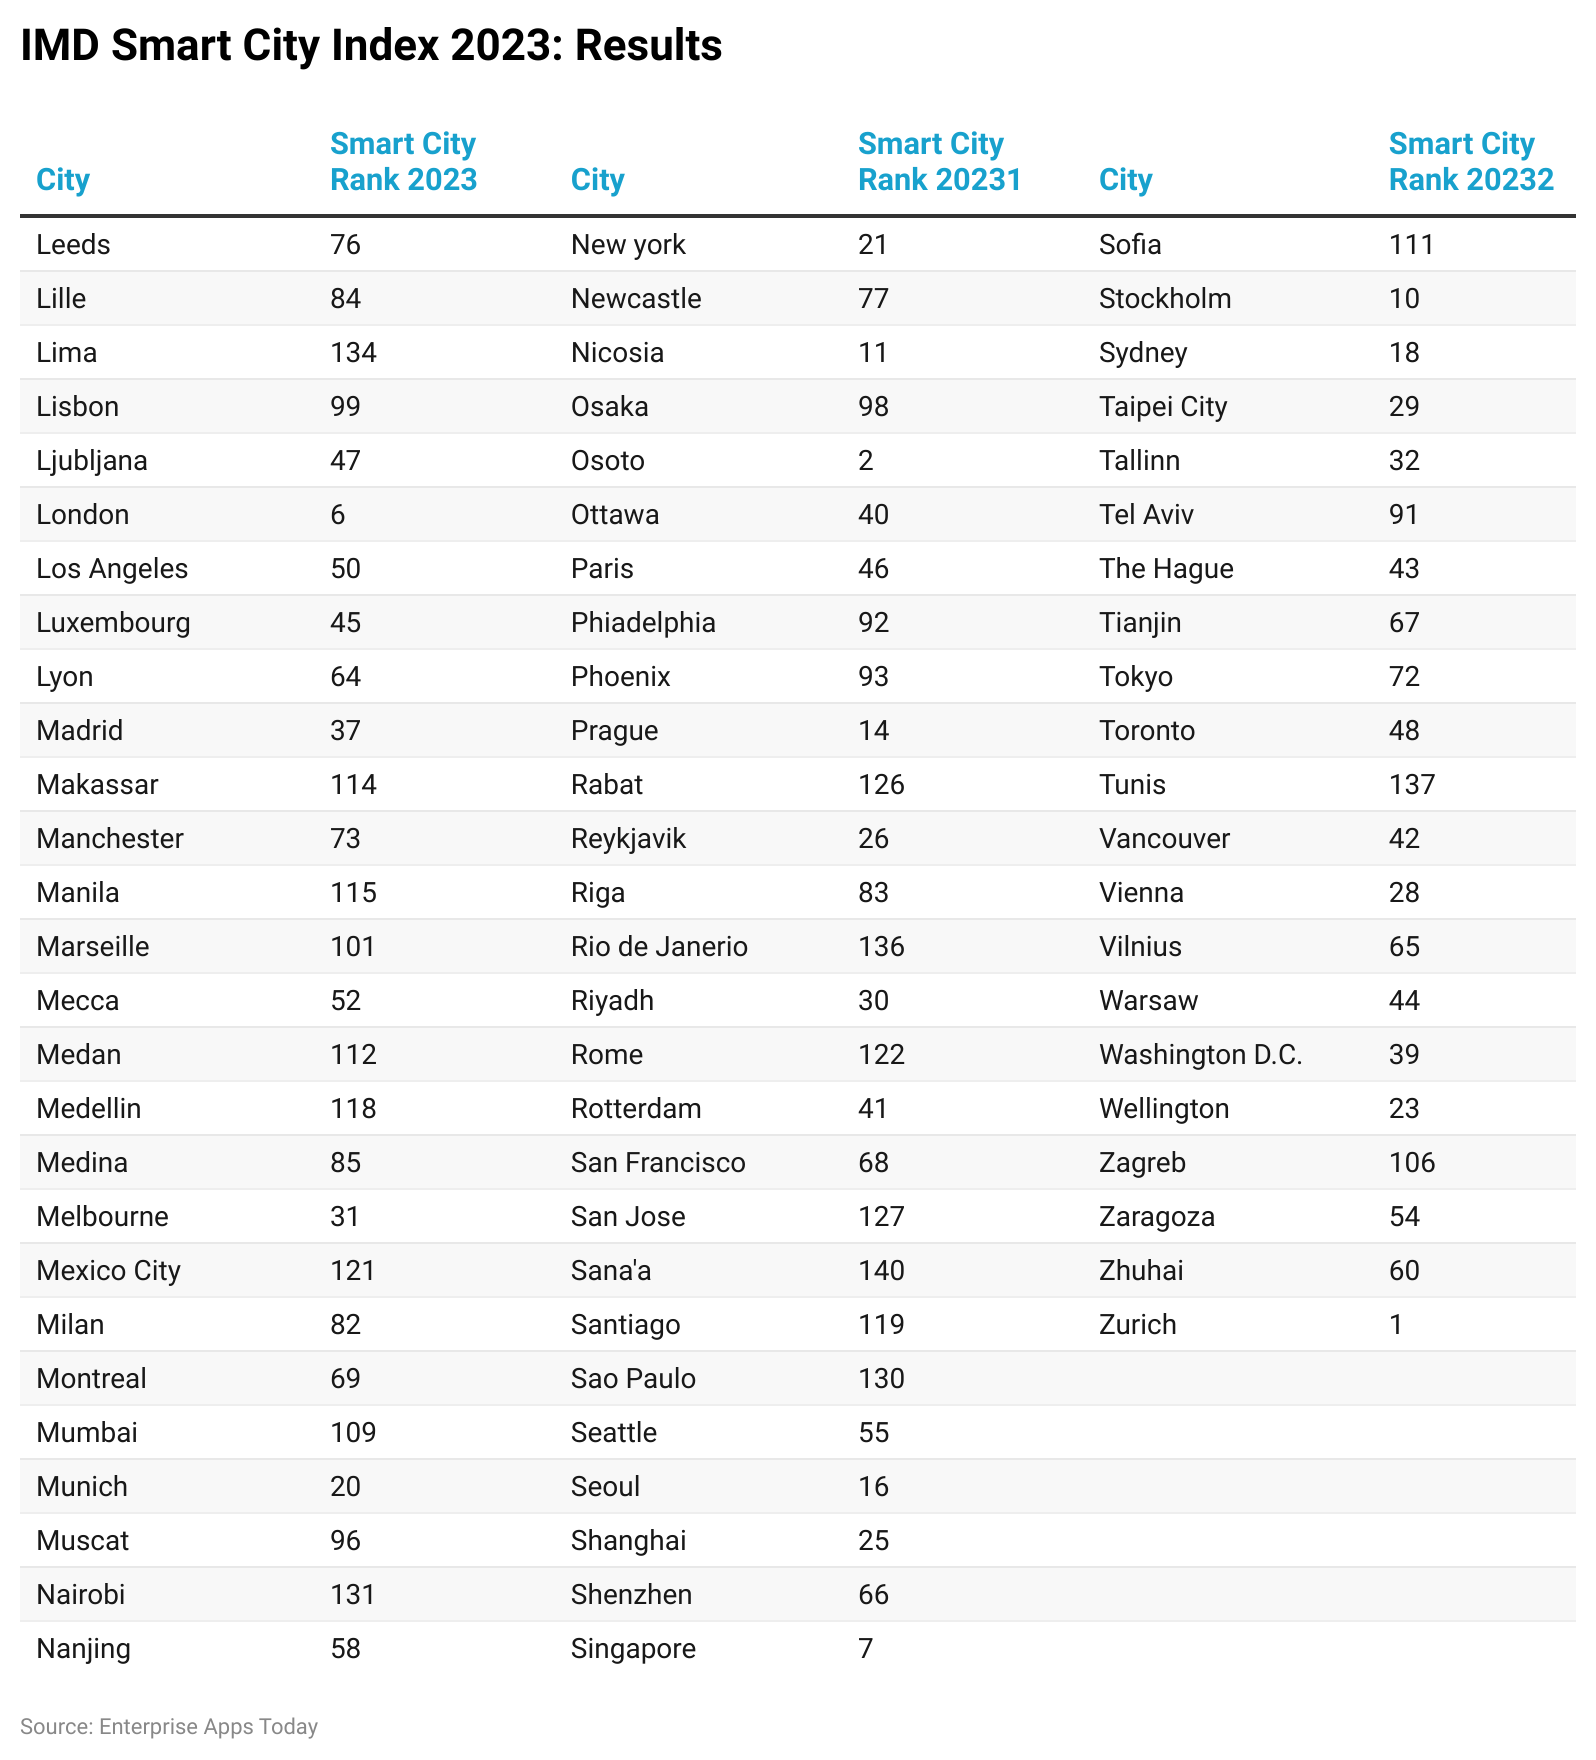
(Reference: imd.cld.bz)
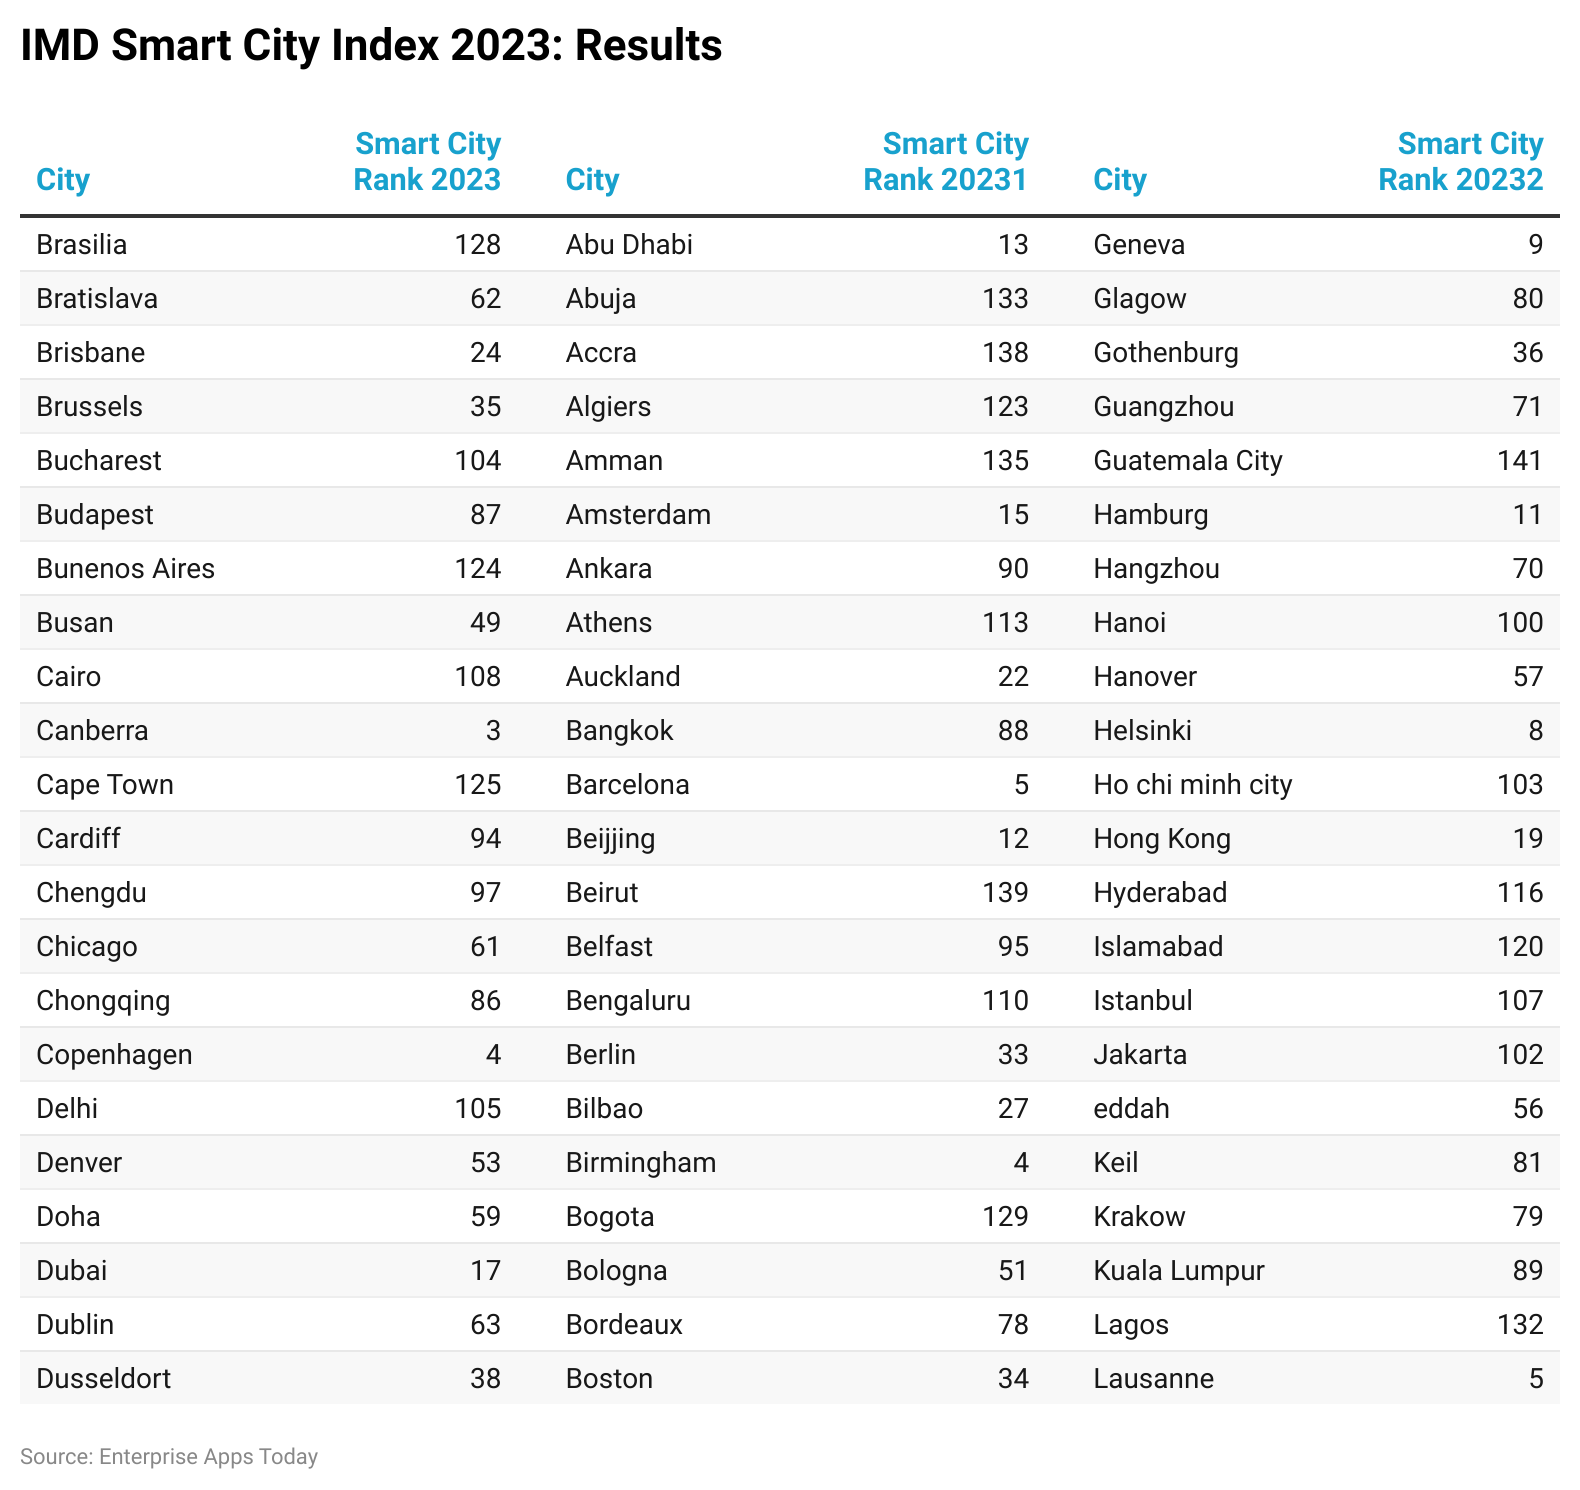
- As per a report analysis of IMD Smart City Index 2023, the above chart describes the smart city ranks of different cities across the world.
- The top 10 ranked cities in the smart city initiative are followed by Zurich (1st), Oslo (2nd), Canberra (3rd), Copenhagen (4th), Lausanne (5th), London (6th), Singapore (7th), Helsinki (8th), Geneva (9th), and Stockholm (10th).
- Around the world, the top spot that hosts many 5G towers, green infrastructure, and EV charging stations along with heavy investments into 6G, IoT, and AI in London, UK for establishing a more advanced smart city.
- New York is another advanced city with tech-implemented well-established infrastructure including water quality meters and sensors, and deployment of LPWAN (Low-Power Wide Area Network) technologies.
- France has four important smart cities Paris, Lille, Lyon, and Marseille.
- Tokyo, Japan includes a wide range of smart cities including many advanced tech. systems such as energy-efficient buildings and advanced traffic management with cameras and sensors. By the end of 2050, Tokyo is planning to reduce the emission of greenhouse gases by 80%.
- Berlin, Germany is termed as the home of energy-saving smart streetlights which allow for the promotion of sustainability and real-time traffic along with an effective transportation system. By 2050 this smart city is going to achieve carbon neutrality.
- Washington’s smart city strategy is to establish a viable and equitable urban environment along with driving economic development in 2023.
- By the end of 2050, approximately 47% of the population is expected to be 65 years and above people. Thus, the smart city has digitalized the healthcare system effectively so that people can purchase everything from a one-stop shop.
Components of Smart City
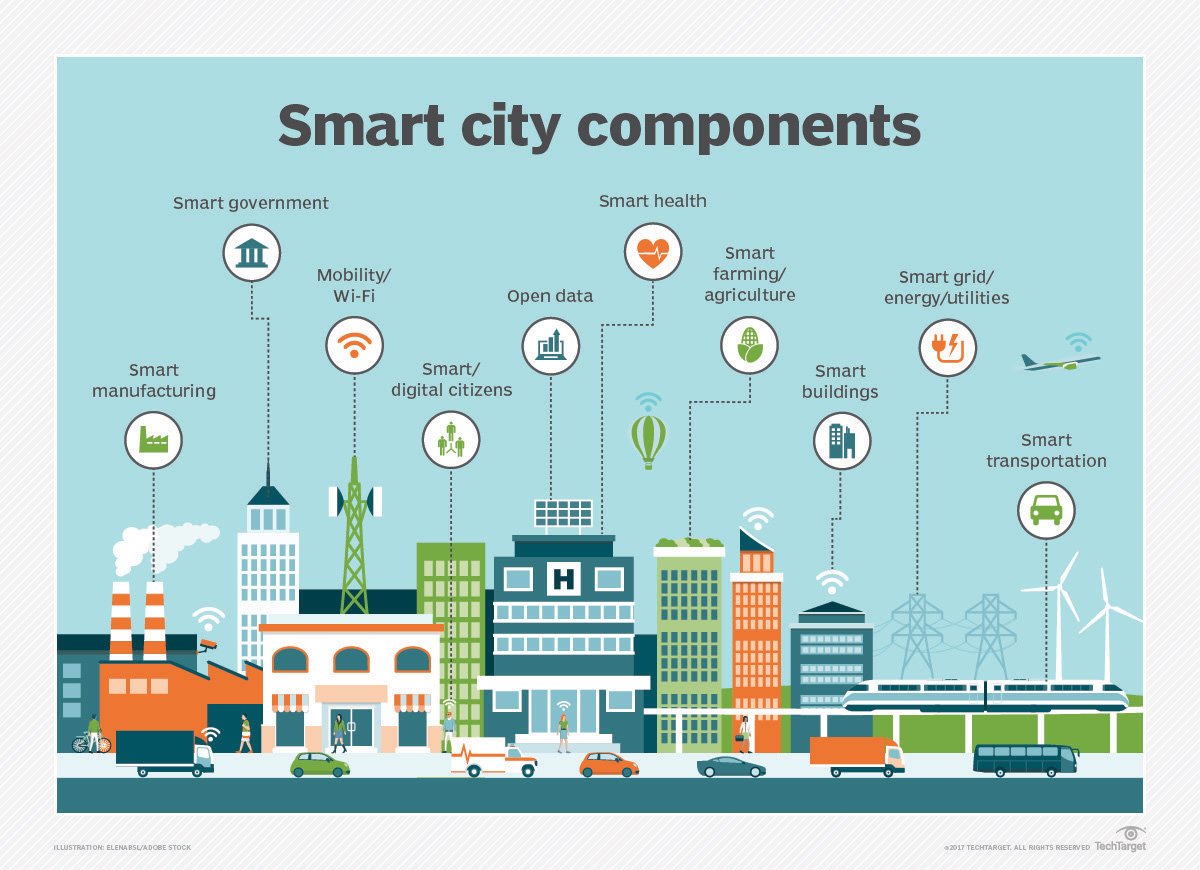
(Source: ttgtmedia.com)
- The smart city market segments are followed by governance and education (24.6%), smart security (13.5%), smart energy (15.8%), smart infrastructure (13.1%), smart mobility (8.7%), smart healthcare (14.6%), and smart building (9.7%).
- Smart buildings include advanced sensors and high-quality systems that allow for optimization, intelligent controlling, and monitoring of various functions. It also includes Indoor Environmental Quality monitoring mainly for detecting weather, temperature, noise level, airflow, and energy efficiency.
- Public safety and security include predictive surveillance systems, advanced cameras, IoT sensors, and other devices.
- Waste management is the effective trend for implementing smart cities that utilize MetTel’s IoT connectivity and single SIM for multi-area coverage from different locations.
- Low-power sensors and networks are mostly installed in traffic streetlights and CCTVs. Buildings, etc.
- Smart Home Networks for securely sharing home sensor data with neighbors, along with promoting and improving security services.
- Smart supply chain and logistics management are mostly used by several companies and warehouses for tracking the shipment of products in real-time to reduce thefts.
- Intelligent farming helps farmers understand environmental factors by using sensors such as nutrient levels, temperature, soil moisture, light intensity, and humidity.
Future Statistics of Smart City
- The overall AI market share in smart cities is going to reach $326 billion by 2028.
- By 2025, the cost of implementing smart city technologies in the top 50 cities is expected to be more than $330 billion.
- The smart city market size of the Asian Pacific region is going to dominate by the end of 2025 with expected revenue worth $320 billion.
- According to the reports of Zipdo, the sub-market of smart cities that is the infrastructure and construction sector is supposed to reach $57.05 billion by 2027.
- On the other hand, the communication segment of smart cities is predicted to gain a market size of $377 billion by 2025.
- By 2024, the expected Canadian smart city growth rate at a CAGR of 19.2%.
- It is predicted that by the end of the year 2023, the Chinese smart city tech market is going to cross $38 billion.
- The market size of the developing nation by 2025 is supposed to account for 20% of the global market share of smart cities.
Global Smart Home Statistics
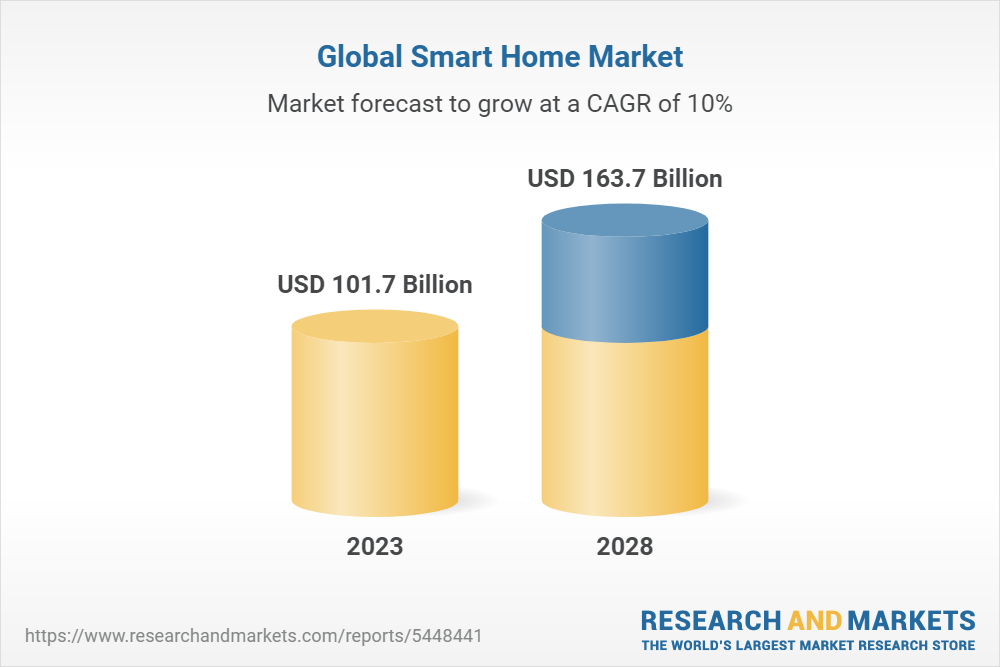
(Source: Market.us)
- The global smart home market has reached $101.7 billion in 2023 and $163.7 billion by 2028 with a CAGR of 10% in the forecast year.
- As of 2025, around 57% of U.S. people are going to implement smart home technology.
Global Smart Manufacturing Statistics
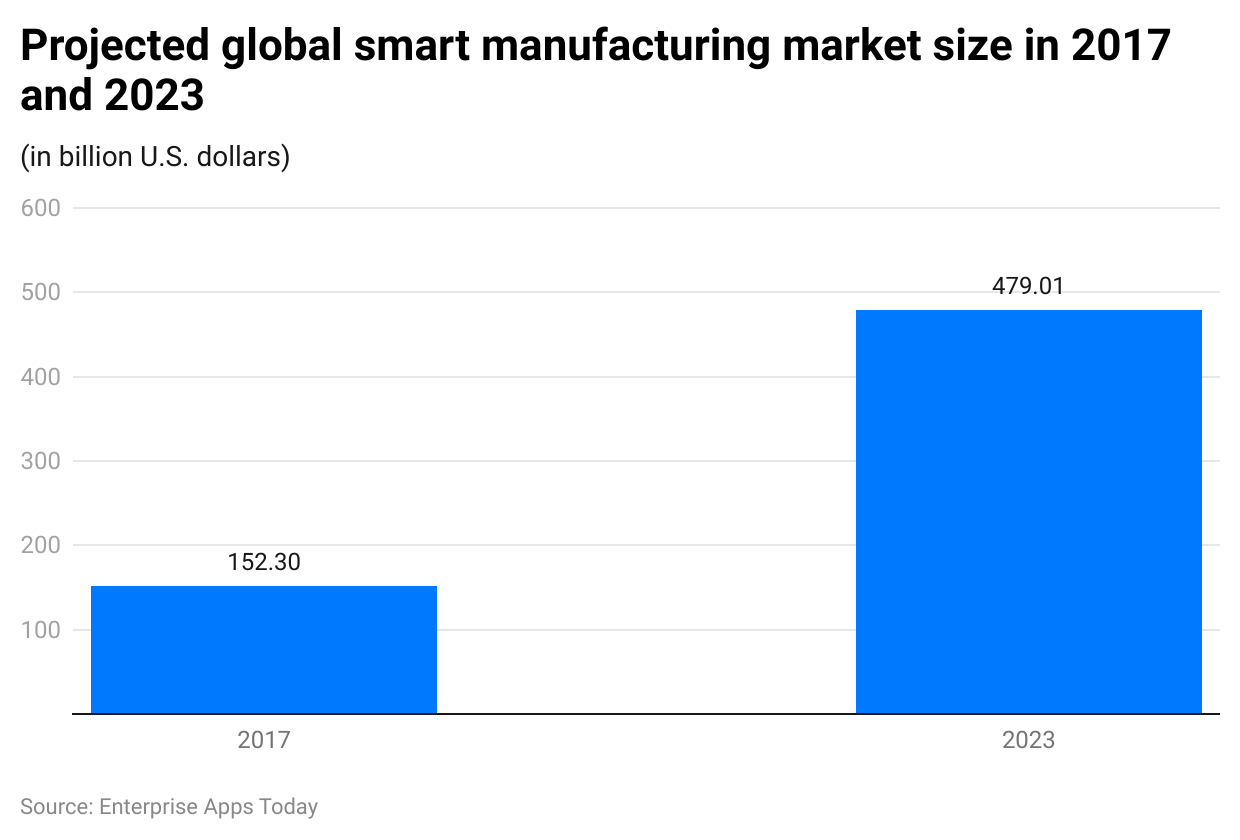
(Reference: statista.com)
According to Statista, in 2023 the market size of the smart manufacturing market is expected to reach $480 billion with a CAGR of 12.3% from 2023 to 2027.
Global Smart Government Statistics
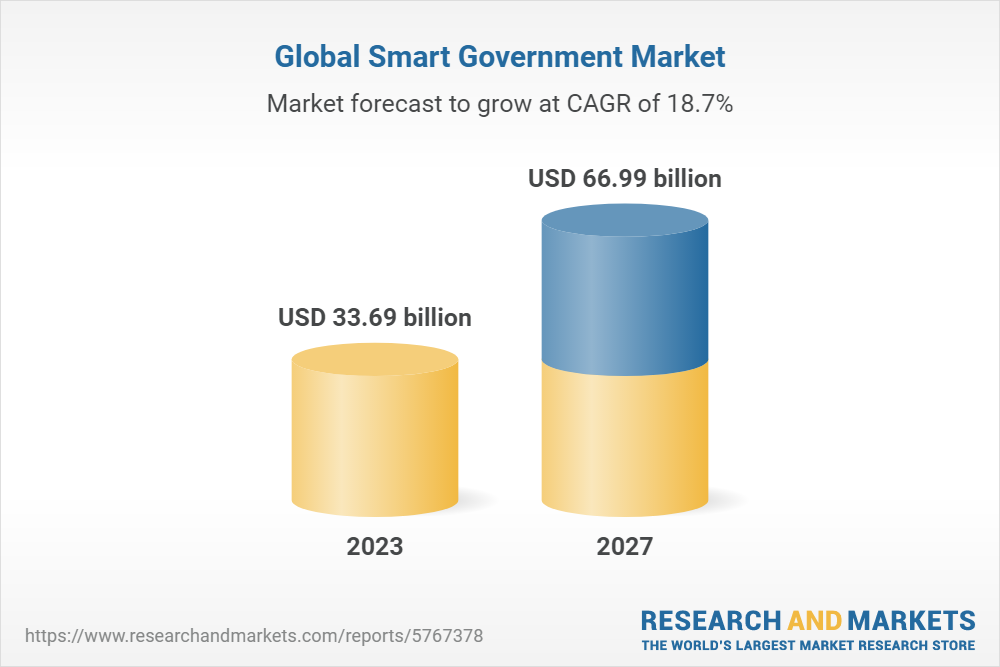
(Source: researchandmarkets.com)
According to the reports of Research and Markets, the global smart government market in 2023 is expected to be $33.69 billion and by the end of 2027, the market size is going to reach $66.99 billion with a CAGR of 18.7%.
Global Smart Transportation Statistics
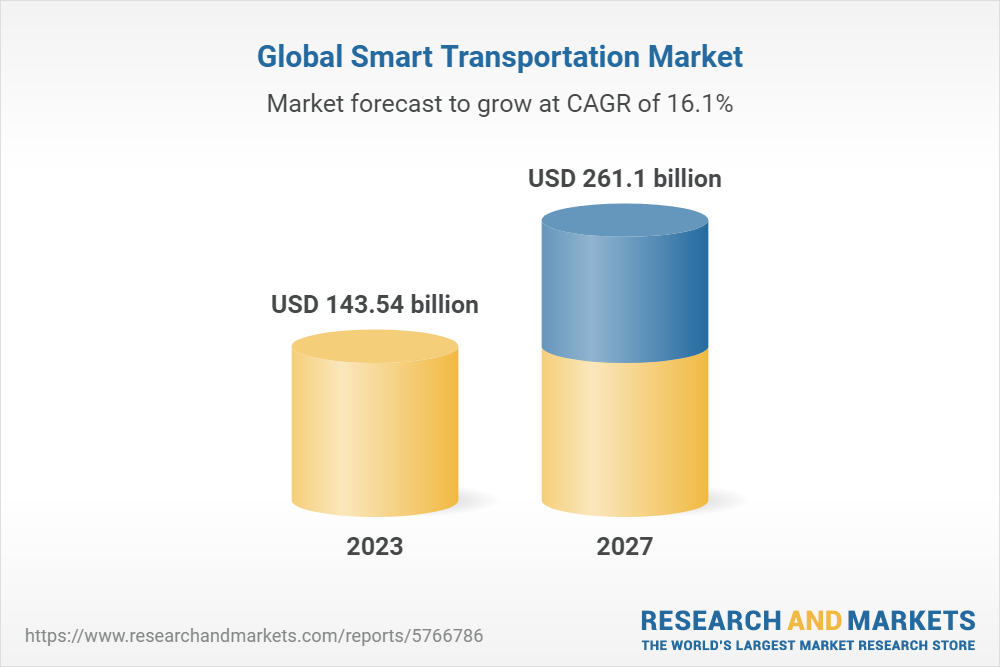
(Source: researchandmarkets.com)
As of 2023, the global smart transportation market is expected to be $143.54 billion and by the end of 2027, it is going to be $261.1 billion with a CAGR of 16.1%.
Global Smart Agriculture Statistics
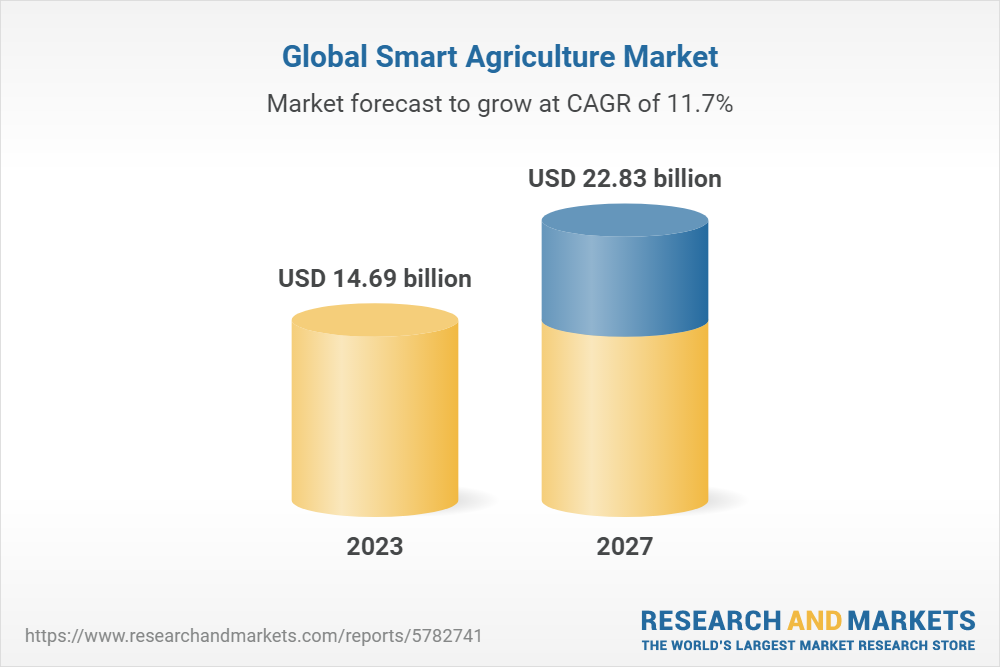
(Source: researchandmarkets.com)
In 2023, the global smart agriculture market is predicted to be $14.69 billion and by 2027 it is going to be $22.83 billion with a CAGR of 11.7%.
Conclusion
As of today after completing the article on Smart City Statistics it can be stated that this concept has improved the infrastructure along with the integration of advanced technology that allows better connectivity, manufacturing, efficient transportation, waste management system, modern governance, and surveillance system. This article includes many effective statistics that will allow you to understand the topic better.
Sources
FAQ.
In 2007, the smart city was first coined by IBM and Cisco to emphasize the roles of technology in making cost-effective, efficient, and sustainable cities.
In the year 1994, it is said that Amsterdam is termed as the first virtual digital city to be created.
Important pillars of smart cities are telecommunications, technology and innovation, transportation and mobility, finance, investment and economic development, government leadership and public policy, energy, etc.
As of 25th August 2023 reports, Indore has secured the record of top smart city in India and has received the National Smart City Award.
A city that includes advanced implementation of new technologies and urban development’s such as reduced CO2 emission, improved energy efficiency, and increased citizens' well-being.

Barry is a lover of everything technology. Figuring out how the software works and creating content to shed more light on the value it offers users is his favorite pastime. When not evaluating apps or programs, he's busy trying out new healthy recipes, doing yoga, meditating, or taking nature walks with his little one.