Starbucks Statistics 2024 – By Revenue, Locations, Payment Options, Customer Behavior, Customer Profile, Mobile App and Country
Page Contents
- Introduction
- Editor’s Choice
- What is Starbucks?
- What’s on Starbucks’ Menu?
- Starbucks Facts
- General Starbucks Statistics
- Starbucks Statistics by Revenue
- Starbucks Statistics By Type
- Starbucks Statistics by Locations
- Starbucks Statistics by Payment Options
- Americans Favorite Coffee Brands
- Starbucks Statistics by Customer Behavior
- Starbucks Statistics by Traffic Sources on the App
- Starbucks Statistics by Customer Profile
- Starbucks Statistics by Mobile App
- Starbucks Statistics by Country
- Starbucks Statistics by Brand Awareness in the USA
- Conclusion
Introduction
Starbucks Statistics: Coffee lovers are spread everywhere, and you get a drive-through coffee just in a few minutes on the way to the office. Starbucks is the leading coffeehouse in the world has can deliver customers coffee in more than 100,000 ways. Isn’t that interesting? In the previous financial year, Starbucks's revenue reached $26.58 billion with a rate of increase of 24.61%. This shows how many Starbucks lovers are living among us!
These Starbucks Statistics are inclusive of worldwide data on coffee lovers along with additional information on consumer behavior, locations, in addition to menus at Starbucks.
Editor’s Choice
- As of 2022, compared to Starbucks's competitors the brand has more stores resulting in 35,000, Dunkin’ (11,300) and Tim Horton’s (5,291).
- According to Starbucks Statistics by country, stores in the United States of America are more profitable than stores in other countries.
- More than half of the customers use gift cards during payment of their orders resulting in 52%.
- Almost half of Starbucks customers are married resulting in 47% in the United States of America.
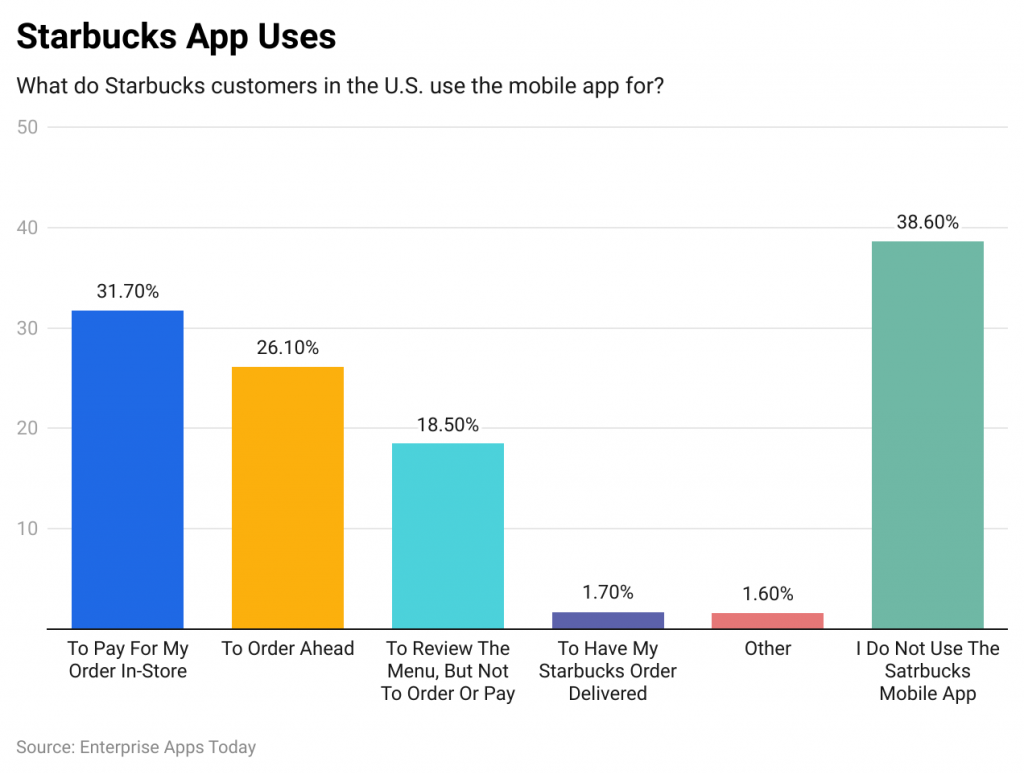
- Customer who uses Starbucks’ mobile app to make payments for their orders in-store result in 31.7%, whereas 26.1% use it to order, and 18.5% use it just to look at the menu.
- In 2022, the highest number of revenue was generated from company-operated stores contributing $26.58 billion, while licensed stores contributed $3.66 billion.
- As of 2022, the total number of stores closed was 629, out of which 212 were company-operated and 417 were licensed.
- 15% of Starbucks customers purchase the brand’s ready-to-drink products in grocery stores.
- According to Starbucks Statistics, 20% of the customers pay a visit to the store 16 times or more in a month.
- Starbucks experiences more footfall in the afternoon as compared to the morning resulting in 65% and 51% respectively
What is Starbucks?
Starbucks Corporation is an American multinational coffeehouse and roastery reserve. It is headquartered in Seattle, Washington. This coffeehouse chain was founded by Jerry Baldwin, Zev Siegl, and Gordon Bowker. The second wave of coffee culture was technically introduced by Starbucks due to its wide range of coffee flavors.
The stores not only provide a variety of coffee and food products but also give free WiFi Internet access to their customers. Today, due to its popularity, Starbucks sells its ready-to-drink products at grocery stores with an increasing demand every year. In 2022, the company ranked 120th on the Fortune 500 list and 303rd on the Forbes Global 2000.
What’s on Starbucks’ Menu?
Drinks
- Cold Drinks (Starbucks Refreshers, Juices, Milk, Sparkling water, and Water)
- Iced Teas (Iced Black Teas, Ied Green Teas, Iced Herbal Teas, and bottle teas)
- Cold Coffee (Cold Brews, Nitro Cold Brews, Iced Americano, Iced Coffees, Iced shaken espresso, Iced Flat whites, Iced Lattes, Iced Macchiatos, Iced Mochas)
- Hot Drinks (Juices, Steamers, Hot Chocolates)
- Hot Coffees (Americanos, Cappuccinos, Espresso Shots, Lattes, Macchiatos, Mochas, Cofee Travellers, Brewed Coffee)
- Oleato
- Hot Teas (Chai Teas, Black Teas, Herbal Teas, Green Teas,)
- Food (Lunch, Snacks and Sweets, Oatmeal and Yogurt, Hot Breakfast, Bakery)
- Frappuccino Blended Beverages (Coffee Frappuccino, Creme Frappuccino)
- At Home Coffee (VIA instant, Whole Bean, and Ground)
Starbucks Facts
- Starbucks owns a 240-hectare coffee farm in Costa Rica.
- Each apron of Starbucks comes with different meanings such as (Red- to spread holiday cheer), (Black – made especially for certified coffee masters), (American Flag Embroidered Apron – to celebrate veterans and military spouses), (Green apron + ASL Fingerspelling – for deaf individuals) and (Starbucks reserve and roastery aprons – made for Reserve and Roastery partners).
- The first-ever Starbucks latte was introduced after 13 years of opening in 1791.
- Starbucks stores are built differently depending on the locations, such as Prague (Castle), Amsterdam (Bank), Seattle (An old car dealership), and India (All female stores)
- Starbucks cups used to have recipes on how to make the beverage to help baristas.
General Starbucks Statistics
- Asia Pacific Region contributes 22% of customers from stores located in the region.
- 80% of Starbucks orders are take-aways.
- 40% of the transactions are completed through the Starbucks Reward Program.
- In 2022, the Starbucks Reward Program had more than 26.4 million active members.
- According to Starbucks Statistics by country, stores in the United States of America are more profitable than stores in other countries.
- Starbucks has 170,000 different ways for customers to customize their drink orders.
- As of 2023, the annual revenue of Starbucks is $35,976 million.
- As of 2022, compared to Starbucks's competitors the brand has more stores resulting in 35,000, Dunkin’ (11,300) and Tim Horton’s (5,291).
- As of 2023, the most ordered Starbucks drinks are Caramel Macchiato, Pumpkin Spice latte, Frappuccino, Vanilla Latte, Green Tea Latte, and White Chocolate Mocha.
- Considering the average industry customer retention rate of 25%, Starbucks excels by 44%.
- According to Starbucks Statistics, on average 8 million coffee drinks are served every day, making it 500 cups for every store, going ahead to yearly calculations making it an average of 2,916 to 2,946 billion cups.
- In November 2023, worldwide traffic generated on starbucks.com resulted in 35.6 million which was just 26.32 million in October 2023. This has shown a whopping 35.27% increase in the total visitors.
- Starbucks is women-centric, as more female employees are working with them as compared to male employees resulting in 63% to 37% respectively.
- 1 out of 10 Americans has a Starbucks Rewards membership.
Starbucks Statistics by Revenue
- As of November 2022, the majority of Starbucks revenue was generated through Beverages ($19.56 billion), followed by other items on the menu ($6.89 billion) and food ($5.80 billion).
- Furthermore, the highest number of revenue was generated from company-operated stores contributing $26.58 billion, while licensed stores contributed $3.66 billion.
- 80% of revenues are on average generated from specialty drinks, espresso, and brewed coffee.
- As of June 2023, Starbucks earned $9,168 billion in revenue with a YoY increase of 12.49%.
Starbucks Statistics By Type
As per the above Starbucks Statistics by revenue, the insights show that the brand is performing exceptionally well in every product type such as beverage, food, packaged and single-serve coffees and teas, and others. In 2022, the highest number of revenue was generated from Beverages resulting in $19.56 billion followed by food ($5.8 billion) and other products ($6.89 billion).
Starbucks Statistics by Locations
- As of 2022, Starbucks has 35,711 stores spread across the world, out of which 17,000 are located in North America.
- Furthermore, 17,458 stores are licensed while 18,253 are company operated.
- In 2022, the brand opened 2,507 new stores in various locations, out of which 1,169 are licensed and 1,338 are company-operated.
- On the other hand, as of 2022, the total number of stores closed was 629, out of which 212 were company-operated and 417 were licensed.
Starbucks Statistics by Payment Options
(Reference: wallstreetzen.com)
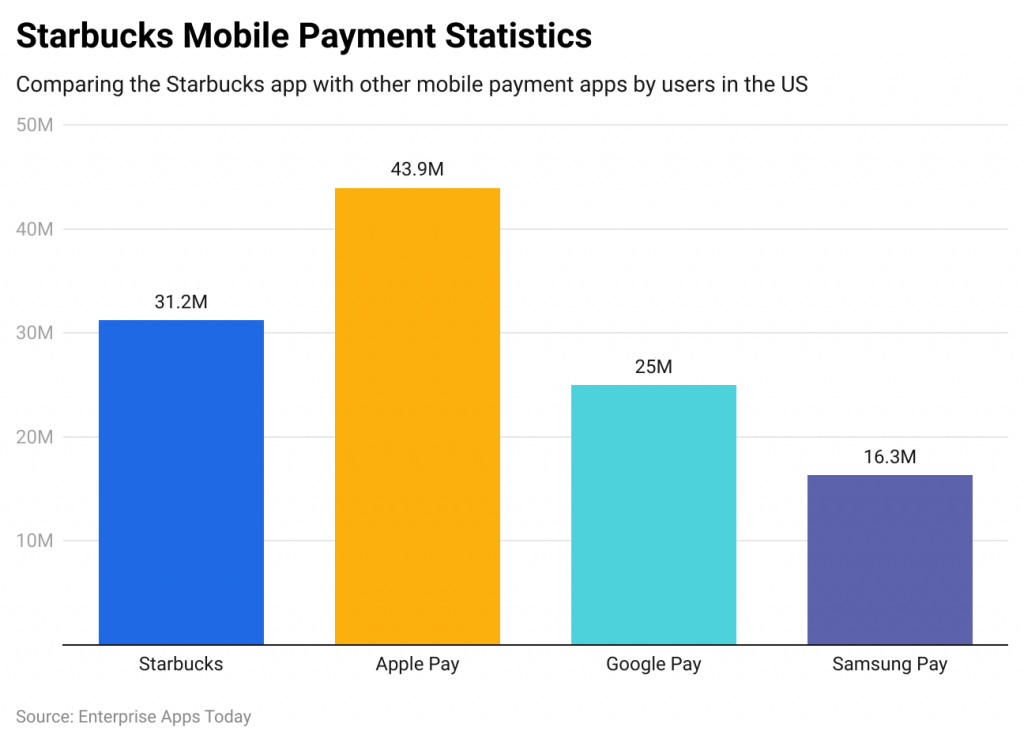
According to Starbucks Statistics, the most preferred payment method at stores is Apple Pay, which has been used by 43.9 million consumers, followed by Starbucks App (31.2 million), Google Pay (25 million) and Samsung Pay (16.3 million).
Americans Favorite Coffee Brands
(Reference: statista.com)
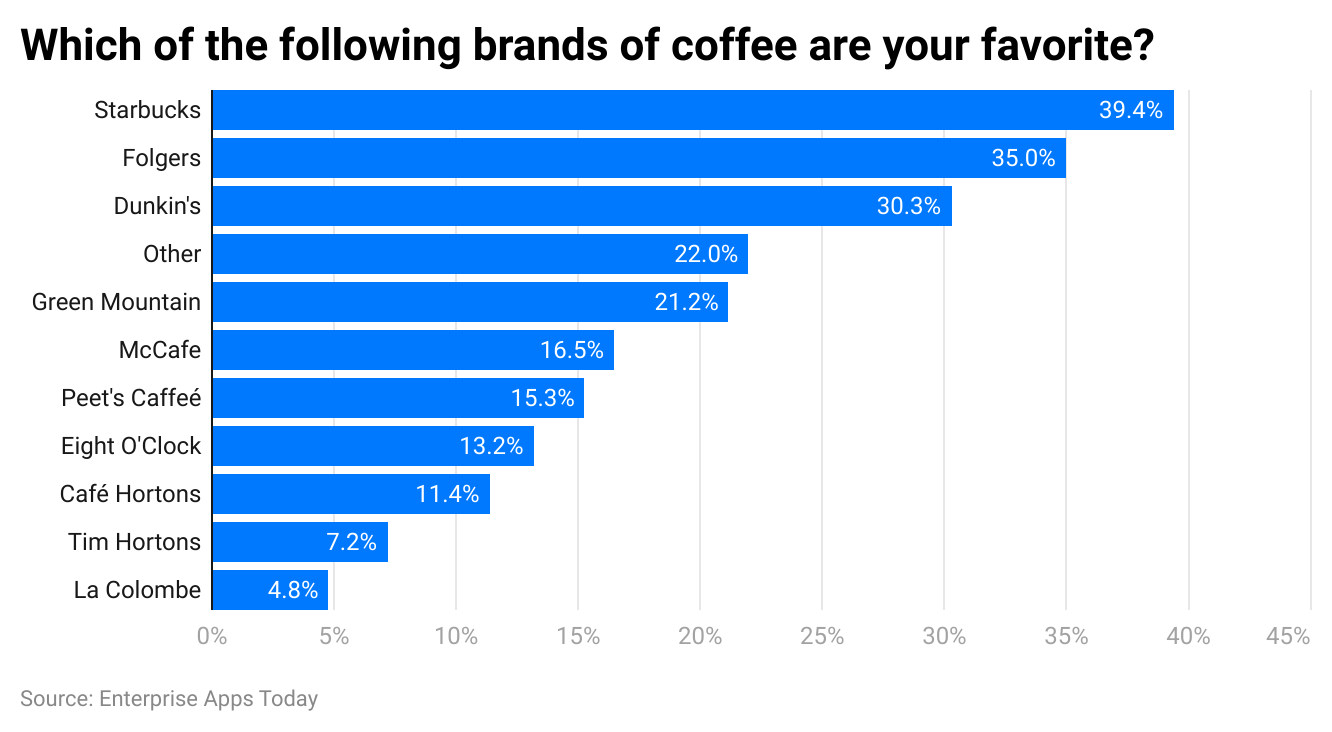
In 2022, the most preferred coffee brand by Americans was Starbucks voted by 39.4% of survey respondents. While other top remaining brands were Folgers (35%) and Dunkin’ (30.3%). Overall, considering the mentioned Coffee brands in the list above, the majority of Americans voted for other brands resulting in 22%.
Starbucks Statistics by Customer Behavior
- Starbucks Statistics state that a customer pays a visit to the store 6 times per month.
- 58% of the customers visit the store either alone or with one person.
- Every week, 34% of Starbucks customers at least buy one food or bakery item.
- Starbucks experiences more footfall in the afternoon as compared to the morning resulting in 65% and 51% respectively.
- More than half of the customers use gift cards during payment of their orders resulting in 52%.
- While orderning, around 35% of customers order it through a mobile app while standing in a line in the store.
- 9% of customers prefer to order Frappuccino-included beverages, whereas, 72% of them buy espresso drinks.
- 43% of Starbucks customers purchase seasonal drinks.
- 15% of Starbucks customers purchase the brand’s ready-to-drink products in grocery stores.
- 60% of customers generally prefer customized drinks.
- Furthermore, 74% of the customers order both, food and drinks.
- According to Starbucks Statistics, 20% of the customers pay a visit to the store 16 times or more in a month.
- Members of Reward Programs are 5 to 6 times more likely to visit the store a day to show their loyalty.
- According to Starbucks Customer Statistics, 10% of customers return to the store every day while 21% come back within 3 days.
- 71% of the customers who use the Starbucks App visit the store at least once every week.
Starbucks Statistics by Traffic Sources on the App
(Reference: wallstreetzen.com)
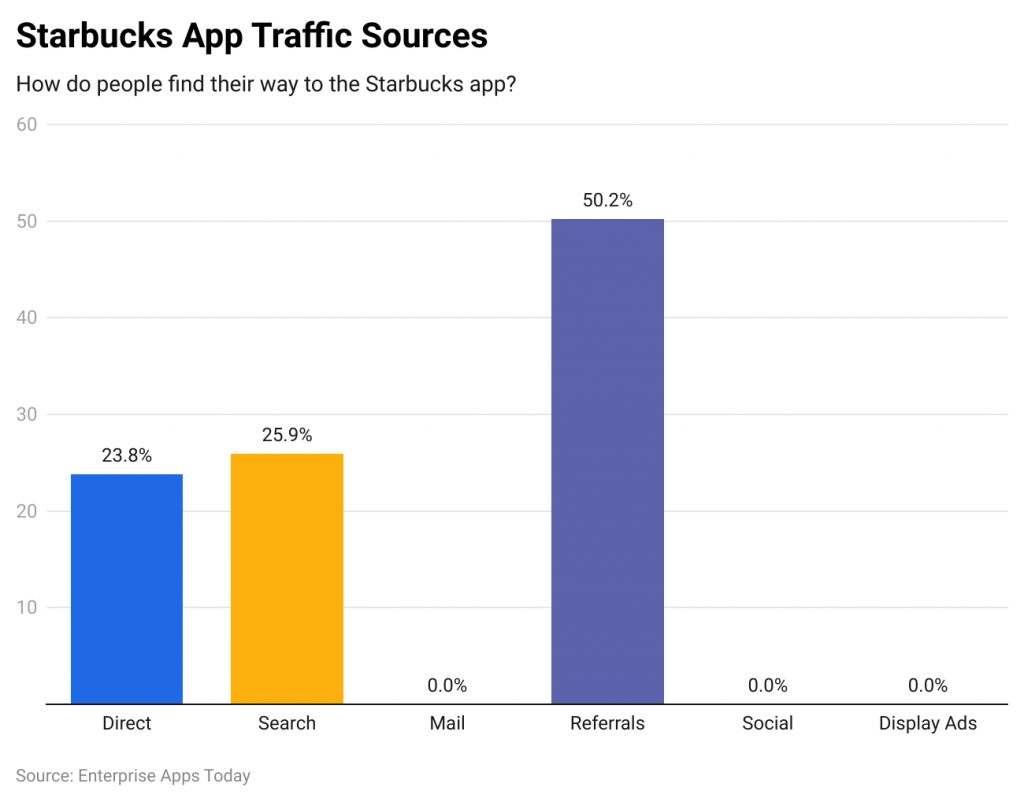
In 2022, Stabucks App generated 23.8% direct traffic, while 25.9% was contributed by search results. The majority of the traffic was observed through referrals.
Starbucks Statistics by Customer Profile
- Almost half of Starbucks customers are married resulting in 47% in the United States of America.
- 67% of the customers have college-level education.
- The majority of the customers are white by ethnic background resulting in 58%, followed by Hispanic (27%), and black (8%).
- More than 73% of the customers have above $60,000 per household income per year.
- The majority of the customers are female resulting in 55%.
- 40% of the customers are aged between 25 to 40 years.
Starbucks Statistics by Mobile App
(Reference: wallstreetzen.com)
Customer who uses Starbucks’ mobile app to make payments for their orders in-store result in 31.7%, whereas 26.1% use it to order, and 18.5% use it just to look at the menu. 1.7% customer want their orders to be delivered. However, majority of the customers in the United States of America do not use this app as researched by Starbucks Statistics.
Starbucks Statistics by Country
By Total Locations
(Reference: statista.com)
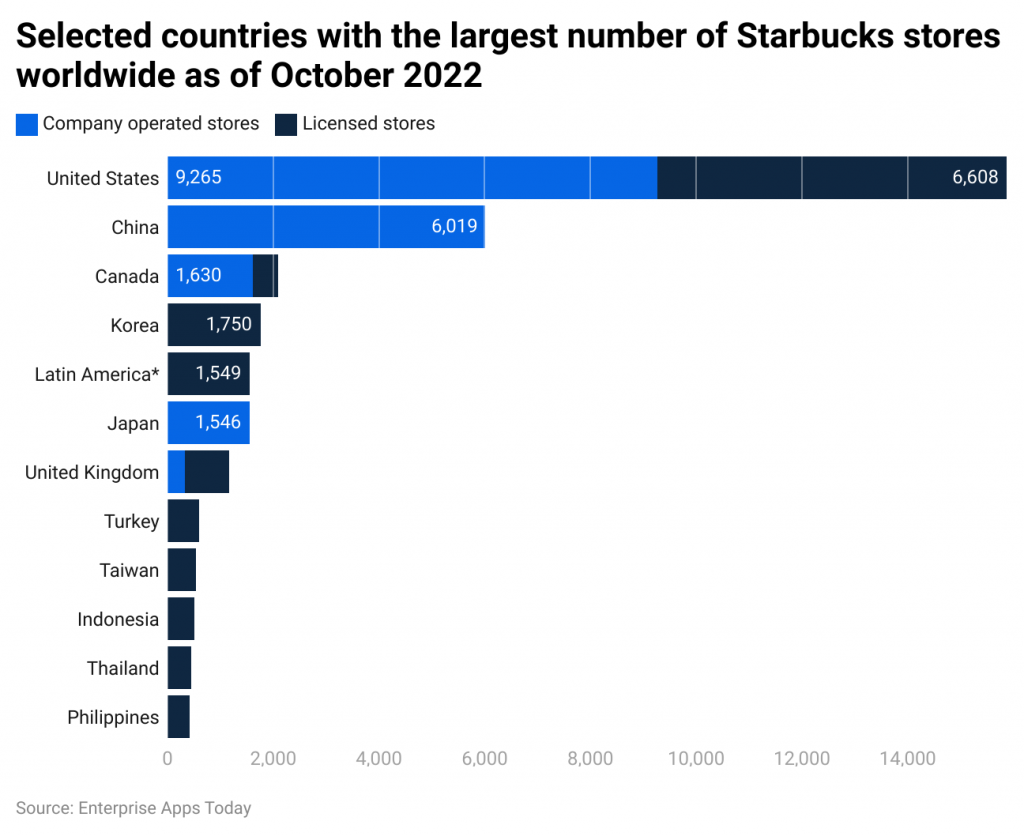
As of October 2022, the United States of America, China, Canada, and Japan are the countries with the highest number of company-operated stores, while Turkey, Taiwan, Indonesia, Thailand, and the Philippines have only licensed stores.
By Device Traffic
(Source: semrush.com)
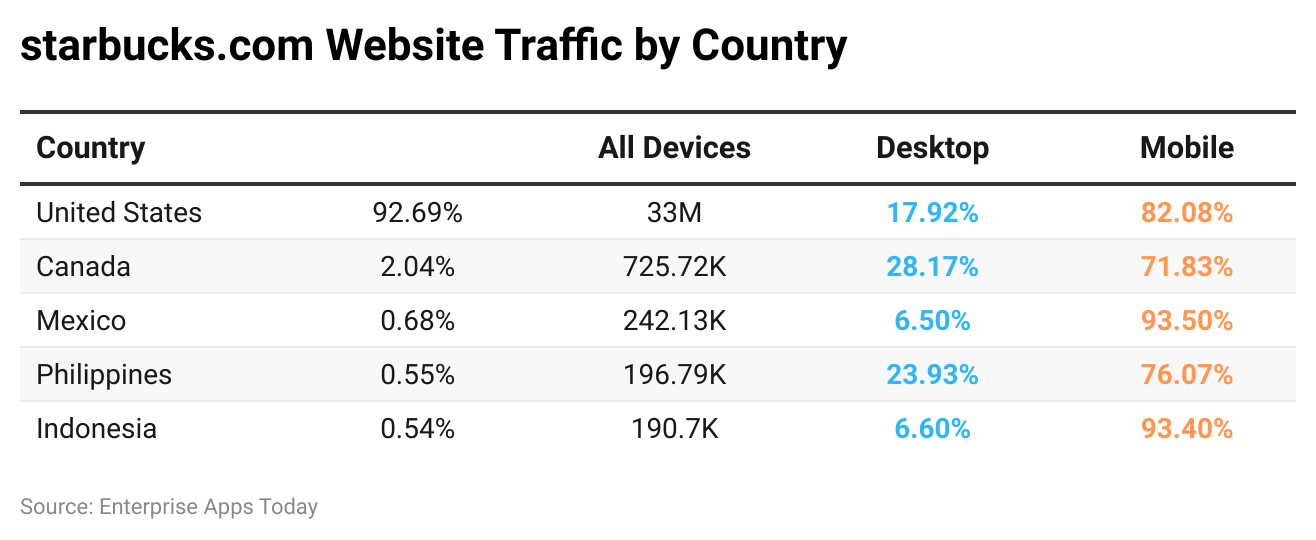
According to Starbucks Statistics, the majority of the app users are based in the United States of America resulting in 92.69% traffic over the last 6 months of 2023. The top countries with the highest traffic contributed the same by mobile devices as compared to desktop. Furthermore, the overall contribution of devices is as follows mobile (81.07%) and Desktop (18.93%), resulting in 28 million and 6 million respectively.
Starbucks Statistics by Brand Awareness in the USA
(Reference: statista.com)
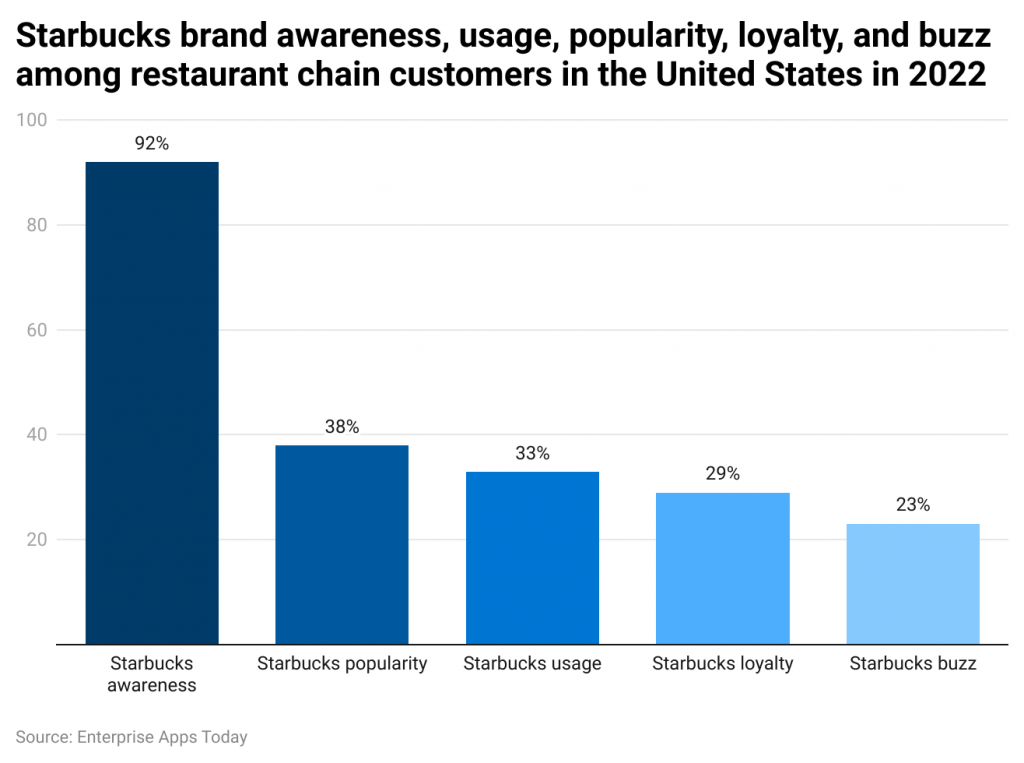
As of 2022, in the United States of America, the brand awareness of Starbucks resulted in 92%, however, it was popular only with 38% of Americans. Out of these, 33% are their customers and 29% are loyal to them. Americans could hear the buzz ‘bout the brand resulting in 23%.
Conclusion
These Starbucks Statistics, provide enough insights to understand how well this coffeehouse brand is performing around the world. Starbucks not only takes care of their customers but offers an exceptional experience during their time in the store. The variety and customization with order make the brand stand out from its competitors. Starbucks today is not only known for its coffee but a brand of variations.
Sources
FAQ.
Starbucks uses arabica coffee beans that provide the flavors of blonde roast, smooth medium roast, the rich and bold dark roast.
A typical cup of decaf coffee has 2 milligrams of caffeine, as compared to a regular cup of coffee with 95 milligrams of caffeine.
According to Insider.com, Caramel Macchiato and Vannila latte is one of the best hot coffee during cold seasons.
Yes. Online delivery can be placed using DoorDash or Uber Eats App.
Baristas are the people who provide service to the customers.

Barry is a lover of everything technology. Figuring out how the software works and creating content to shed more light on the value it offers users is his favorite pastime. When not evaluating apps or programs, he's busy trying out new healthy recipes, doing yoga, meditating, or taking nature walks with his little one.