
Subway Statistics 2024 By Brand Awareness in the USA, Brand Value and Digital Business
Page Contents
Introduction
Subway Statistics: Subway is an American multinational fast-food restaurant franchise that specializes in Submarine sandwiches, drinks, salads, and wraps. Subway offers customizable order menus for each customer. For this, customers can choose their choice of bread, fillings, and toppings. As of today, Subway operates in more than 100 countries.
Today, it has been more than 50 years since the Subway was first opened, and now has spread its operations across the world filling the taste and hunger of millions of people. These Subway Statistics show its current performance in the market along with calories in Subway food items.
Editor’s Choice
- Every year, the average every Subway store uses lettuce spread across 16 acres of land.
- In 2022, Subway became the largest quick-service restaurant in the USA with 9.18 billion of sales.
- As of December 2023, subway.com generated 13.33 million global traffic while it was 16.44 million in November 2023.
- Subway Statistics state that in the USA in 2023, Subway was one of the top 10 leading restaurant chains by brand awareness resulting in 89%, along with Domino’s Pizza, and Starbucks.
- Over the last 3 months, the majority of the consumers who ordered online directly through subway.com were residing in the USA.
- On average, mobile traffic contributed 81.34% while desktop 18.66% resulting in 10 million and 2 million devices respectively.
- The ham pepperoni, salami combo, and the BMT sandwich are named after the Brooklyn- Manhattan Transit System.
- Dick Pilchen has become the long lasted employee of Subway. In 1968 he joined the company and worked for more than 50 years.
- In 2014, Subway sold almost equal subs to the population of New York contributing 7.6 million per day.
- On the opening day, Pete’s Super Submarines sold more than 310 sandwiches which were charged less than 70 cents.
You May Also Like To Read
- McDonald’s Statistics
- Burger King Statistics
- Wendy’s Statistics
- Pizza Hut Statistics
- Starbucks Statistics
General Subway Statistics
- As of December 2023, subway.com generated 13.33 million global traffic while it was 16.44 million in November 2023.
- In 2023, the American Customer Satisfaction Index (ACSI) of Subway contributed 75. Since the last 10 years, the score has decreased significantly, which was 83 in 2013.
- In 2022, Subway became the largest quick-service restaurant in the USA with 9.18 billion of sales.
- In 2023, quick service restaurant franchise stores in the USA were 192,057.
Subway Facts
- The original Subway was opened in Connecticut and named Pete’s Super Submarines. Fred DeLuca took a $1000 loan from his friend and opened this restaurant.
- In 2014, Subway sold almost equal subs to the population of New York contributing 7.6 million per day.
- The ham pepperoni, salami combo, and the BMT sandwich are named after the Brooklyn- Manhattan Transit System.
- The 60-inch lunchtime classic was called the Snak, which was added in 1977 to the menus.
- On the opening day, Pete’s Super Submarines sold more than 310 sandwiches which were charged less than 70 cents.
- For every sandwich, subway hand-picks every black olives.
- Every year, the average every Subway store uses lettuce spread across 16 acres of land.
- Because of the freshness issues, as stated by a former Subway employee, meatballs and roast beef are the worst choices for filling.
- As of today, US Subways have more than 16 alternatives to their main sandwiches.
- Surprisingly, Subway has more fast food chains than McDonald’s.
- Dick Pilchen has become the long lasted employee of Subway. In 1968 he joined the company and worked for more than 50 years.
- Subway is planning to introduce a new platform that will allow customers to order using the touchscreen, and Wifi.
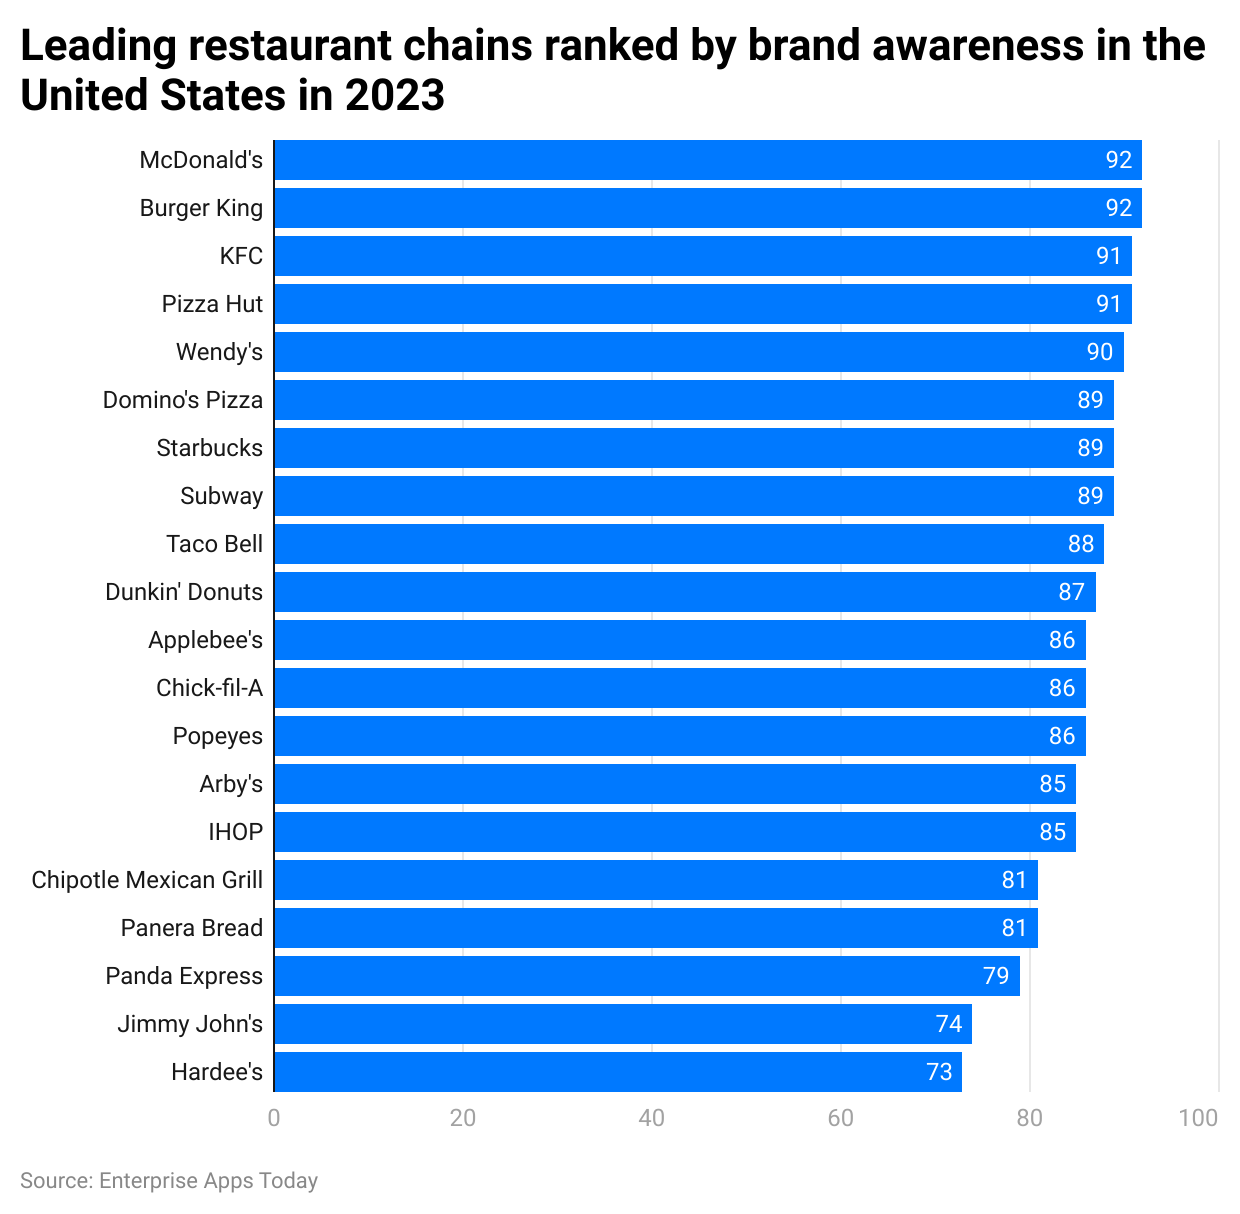
By Brand Awareness in the USA
(Reference: statista.com)
Subway Statistics state that in the USA 2023, Subway was one of the top 10 leading restaurant chains by brand awareness resulting in 89%, along with Domino’s Pizza, and Starbucks. McDonald’s, Burger King, and KFC topped the list with a 90+ score.
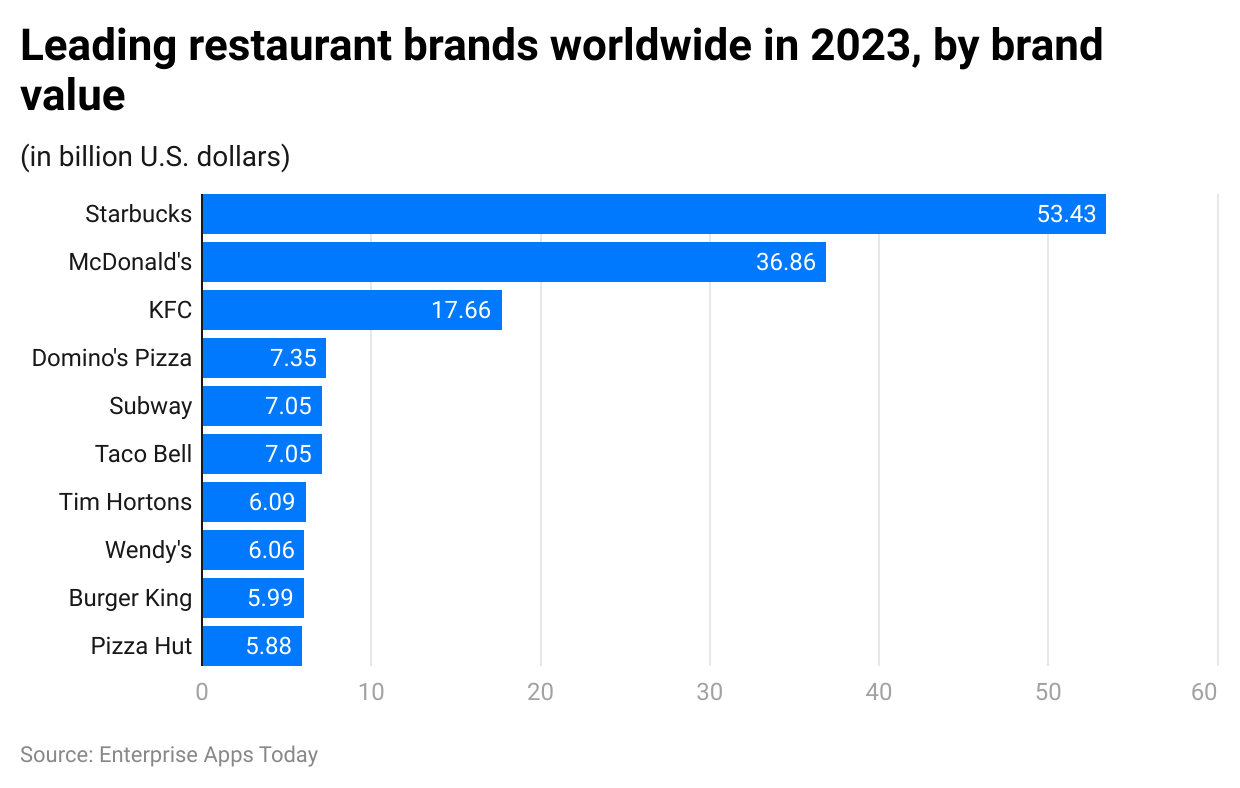
By Leading Restaurant Brands by Brand Value
(Reference: statista.com)
In 2023, around the world, Starbucks topped the list with $53.43 billion of brand value, followed by McDonald’s at $36.86 billion and KFC at $17.66 billion. However, Subway was one of the top 5 restaurant brands with $7.05 billion value. Other well-known restaurants included Wendy’s, Taco Bell, Domino’s Pizza, Burger King, Pizza Hut and Tim Hortons.
By Digital Business
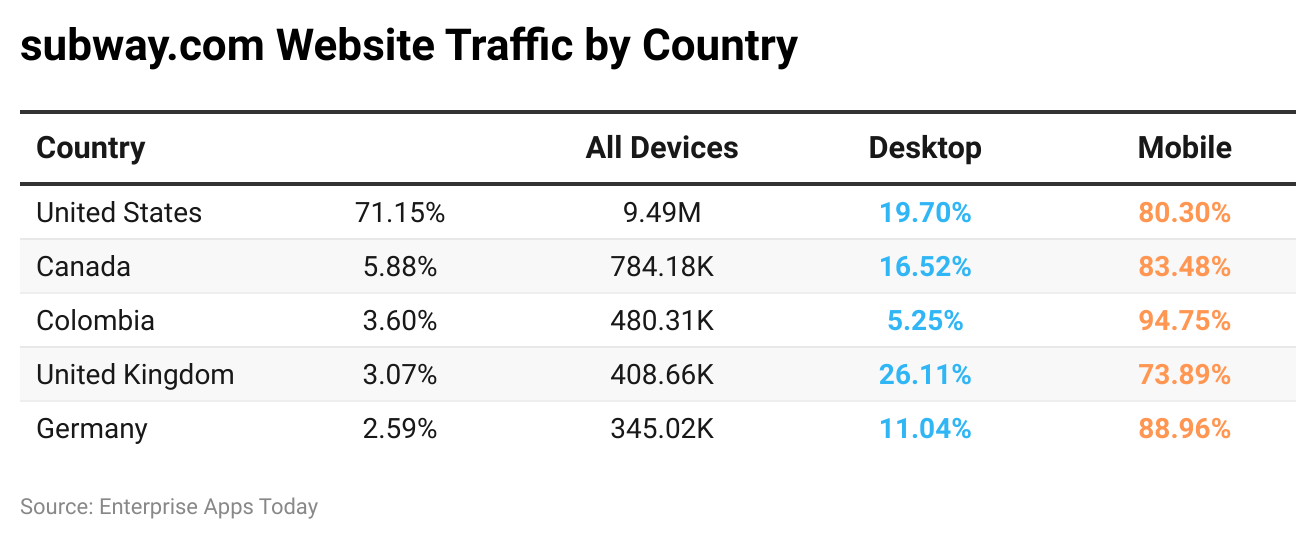
By Country-Wise Website Traffic
(Reference: statista.com)
Over the last 3 months, the majority of the consumers who ordered online directly through subway.com were residing in the USA. Canada, Colombia, the United Kingdom, and Germany were other top countries with the highest number of website visitors. Overall, the majority of consumer prefer to access the platform from their smartphones as compared to desktops. On average, mobile traffic contributed 81.34% while desktop 18.66% resulting in 10 million and 2 million devices respectively
By Country and Region
North America
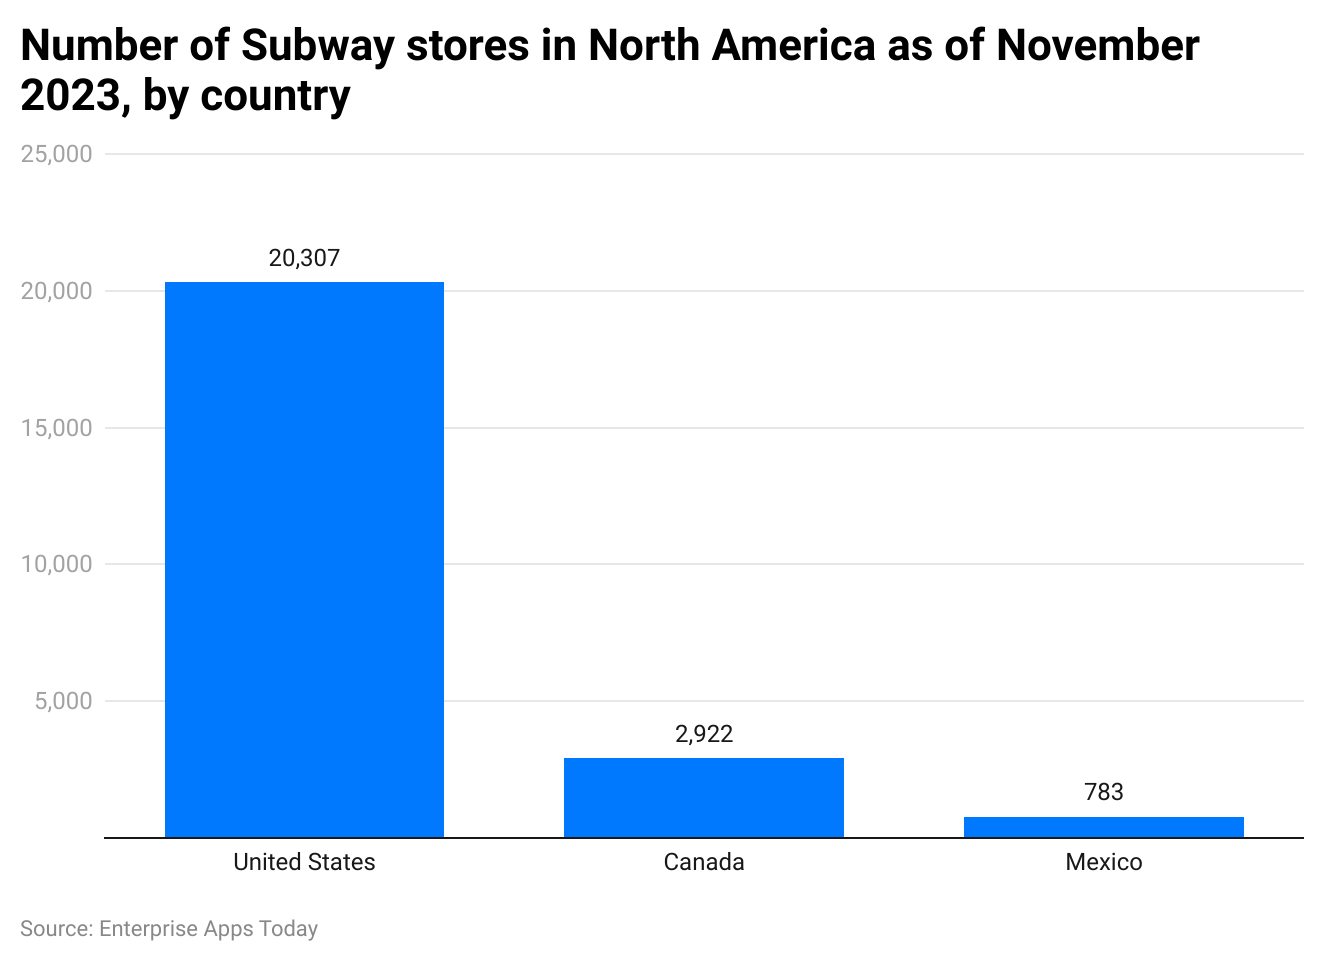
(Reference: statista.com)
As of 2023, the USA had the highest number of stores in the North American region with 20,307 stores, followed by Canada at 2,922 and Mexico at 783.
Europe
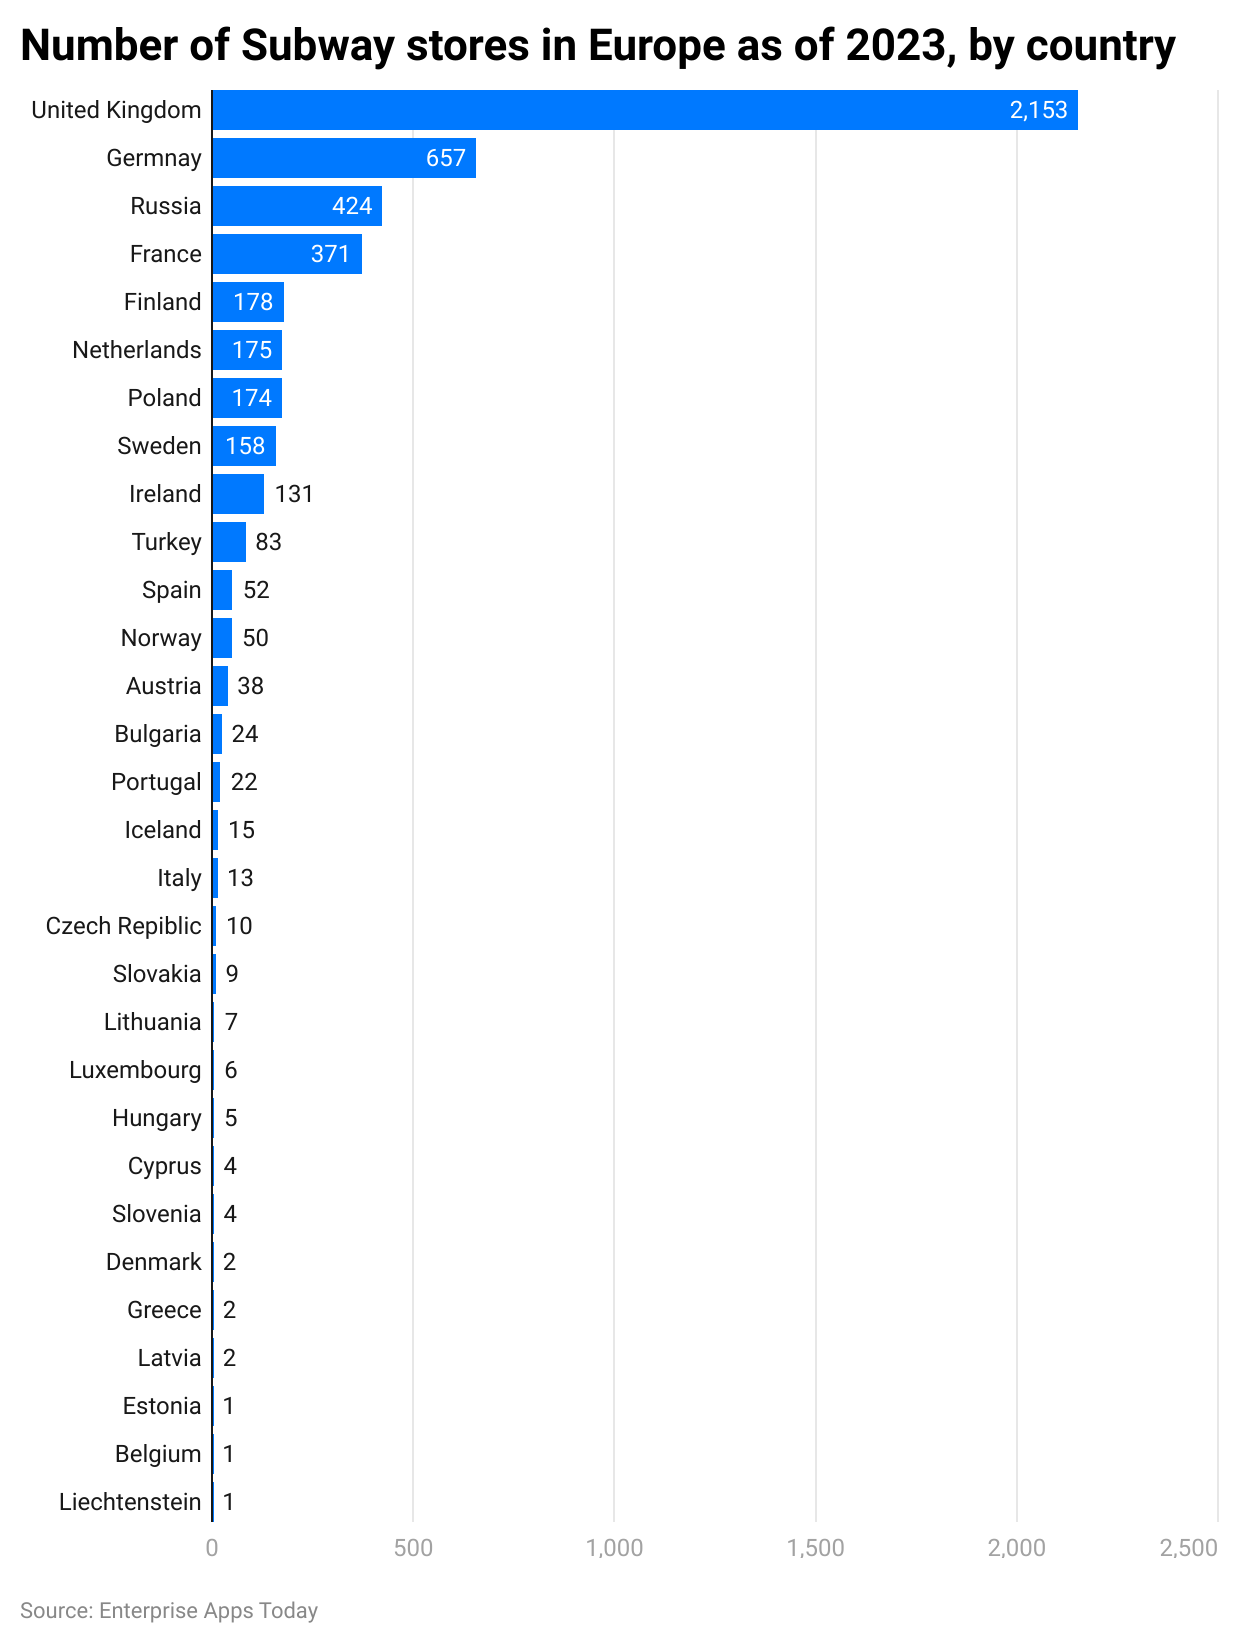
(Reference: statista.com)
According to Subway Statistics 2023, the highest number of stores in Europe were in the United Kingdom resulting in 2,153, followed by Germany at 657 and Russia at 424. Other countries with more than 100 stores were France, Finland, Netherlands, Poland, Sweden, and Ireland.
Worldwide
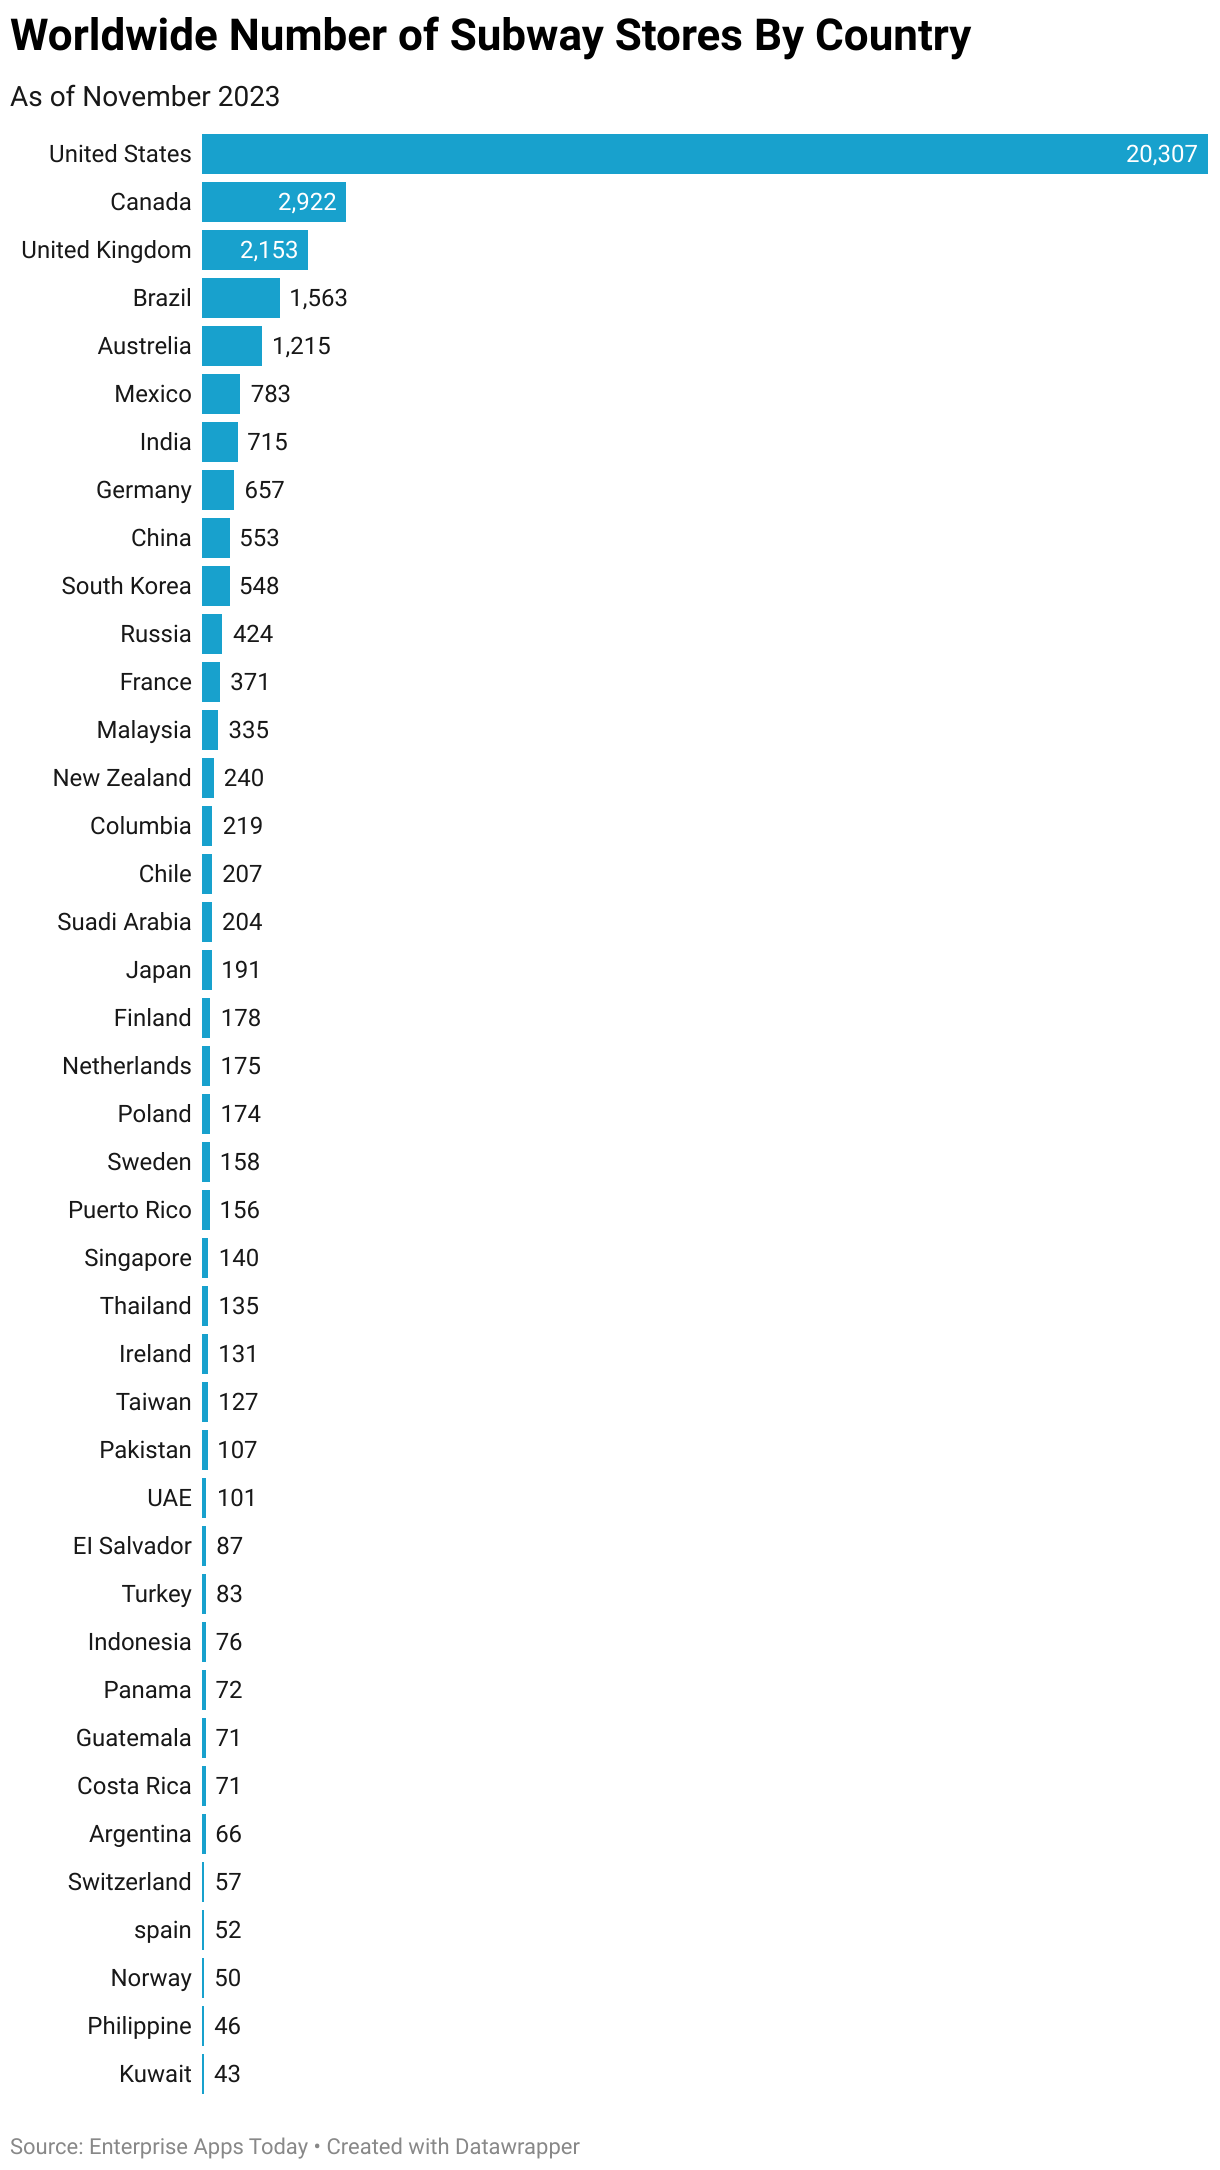
(Reference: statista.com)
Subway Statistics 2023 state that, compared to a global number of stores, the USA tops the list with 20,307 stores, followed by Canada with 2,922 and the United Kingdom with 2153. Brazil and Australia have more than 1,000 stores. Countries with less than 1,000 stores were Mexico, India, Germany, China, South Korea, Russia, France Malaysia, etc.
By Calories in Subway Food
| Subway Bread | Calories (kcal) | Fat (g) | Carbs (g) | Protein (g) |
| Italian Herbs and Cheese Bread, 6 inches, 1 serving | 200 | 4 | 36 | 9 |
| Gluten-Free Bread (packaged), 1 serving | 340 | 12 | 51 | 6 |
| Mini Hearty Multigrain Bread, 1 serving | 120 | 2 | 24 | 5 |
| Jalapeño Cheddar Bread, 6 inches, 1 serving | 190 | 4 | 34 | 9 |
| Mini Artisan Italian Bread, 1 serving | 100 | 1 | 22 | 4 |
| Multigrain Flatbread, 1 serving | 160 | 4 | 10 | 23 |
| Hero Bread, 6 inches, 1 serving | 100 | 5 | 27 | 12 |
| Artisan Italian Bread, 6 inches, 1 serving | 200 | 2 | 34 | 7 |
(Source: fatsecret.com)
| Subway Breakfast Items | Calories (kcal) | Fat (g) | Carbs (g) | Protein (g) |
| Steak, Egg, and Cheese with Plain Wrap, 1 serving | 820 | 45 | 56 | 47 |
| Bacon, Egg, and Cheese with Plain Wrap, 1 serving | 860 | 53 | 56 | 40 |
| Bacon, Egg White, Cheese on Plain Wrap, 1 serving | 670 | 32 | 57 | 39 |
| Egg and Cheese Artisan Italian, 6 inches, 1 serving | 380 | 20 | 36 | 19 |
| Black Forest Ham, Egg, and Cheese on Artisan Italian, 6 inches, 1 serving | 410 | 21 | 38 | 23 |
| Egg and Cheese on Artisan Italian, 6 inches, 1 serving | 450 | 22 | 38 | 29 |
| Egg white and Cheese Flatbread, 6 inches, 1 serving | 450 | 22 | 43 | 19 |
| Egg White and Cheese Flatbread, 6 inches, 1 serving | 530 | 28 | 44 | 24 |
| Steak, Egg White, and Cheese Flatbread, 6 inches, 1 serving | 520 | 25 | 44 | 29 |
(Source: fatsecret.com)
| Subway Melt Sandwiches | Calories (kcal) | Fat (g) | Carbs (g) | Protein (g) |
| Spicy Italian Fresh Melt, 6 inches, 1 serving | 540 | 34 | 40 | 24 |
| Meatball Marinara Fresh Melt, 6 inches, 1 serving | 520 | 27 | 50 | 25 |
| Black Forest Ham or Artisan Italian, 6 inches, 1 serving | 450 | 25 | 40 | 23 |
| Oven Roasted Chicken Fresh Melt, 6 inches, 1 serving | 400 | 15 | 42 | 26 |
| Sweet Onion Chicken Teriyaki Fresh Melt, 6 inches, 1 serving | 460 | 14 | 57 | 30 |
| Tuna Fresh Melt, 6 inches, 1 serving | 570 | 37 | 35 | 30 |
| Chicken and Bacon Ranch Fresh Melt, 6 inches, 1 serving | 570 | 32 | 39 | 38 |
| Oven Roasted Turkey Fresh Melt, 6 inches, 1 serving | 380 | 14 | 41 | 25 |
| Veggie Delite, 6 inches, 1 serving | 390 | 23 | 38 | 13 |
(Source: fatsecret.com)
| Subway Pizza | Calories (kcal) | Fat (g) | Carbs (g) | Protein (g) |
| Sausage Pizza, 1 serving | 870 | 37 | 96 | 34 |
| Bacon Pizza, 1 serving | 840 | 34 | 95 | 36 |
| Pepperoni Pizza, 2 slices | 850 | 35 | 95 | 34 |
| Meatball Pizza, 1 serving | 860 | 35 | 98 | 37 |
| Footlong Pro Pizza Sub, 1 serving | 1170 | 76 | 85 | 49 |
| Cheese Pizza, 1 serving | 720 | 24 | 94 | 28 |
| Pizza Sub on Plain Wrap,1 serving | 720 | 44 | 59 | 26 |
| Pizza Sub Salad, 1 serving | 310 | 23 | 16 | 14 |
| Pizza Sub Protein Bowl, 1 serving | 610 | 48 | 18 | 30 |
| Pizza Sub, 6-inch, 1 serving | 420 | 23 | 41 | 18 |
(Source: fatsecret.com)
| Subway Sandwiches | Calories (kcal) | Fat (g) | Carbs (g) | Protein (g) |
| Veggie Delite, 6 inches, 1 serving | 200 | 2 | 39 | 8 |
| Spicy Italian, 6 inches, 1 serving | 430 | 24 | 39 | 19 |
| Tuna, 6 inches, 1 serving | 430 | 25 | 37 | 19 |
| Italian BMT, 6 inches, 1 serving | 410 | 16 | 39 | 19 |
| Subway Club, 6 inches, 1 serving | 500 | 20 | 41 | 29 |
| Oven Roasted Turkey, 6 inches, 1 serving | 260 | 3 | 39 | 20 |
| Steak, and Cheese, 6 inches, 1 serving | 320 | 10 | 37 | 25 |
| Meatball Marinara, 6 inches, 1 serving | 410 | 18 | 48 | 20 |
| Black Forest Ham, 6 inches, 1 serving | 270 | 4 | 41 | 18 |
(Source: fatsecret.com)
| Subway Soups | Calories (kcal) | Fat (g) | Carbs (g) | Protein (g) |
| Beef chili with Beans soup, 1 serving | 360 | 22 | 21 | 21 |
| Chicken Noodle Soup, 1 serving | 70 | 3 | 6 | 7 |
| Broccoli Cheddar Soup, 1 serving | 200 | 16 | 16 | 9 |
| Loaded Baked Potato with Bacon Soup, 1 serving | 200 | 14 | 17 | 9 |
(Source: fatsecret.com)
| Subway Wraps | Calories (kcal) | Fat (g) | Carbs (g) | Protein (g) |
| Wrap, 1 serving | 300 | 8 | 50 | 8 |
| Grilled Chicken on plain wrap, 1 serving | 470 | 11 | 54 | 42 |
| Oven Roasted Turkey on plain wrap, 1 serving | 430 | 10 | 54 | 32 |
| Chicken and Bacon Ranch on plain wrap, 1 serving | 840 | 45 | 56 | 55 |
| Italian BMT on Plain wrap, 1 serving | 680 | 36 | 58 | 32 |
| Sweet Onion Chicken Teriyaki on plain wrap, 1 serving | 540 | 11 | 71 | 41 |
| Buffalo Chicken Wrap, on plain wrap, 1 serving | 560 | 19 | 56 | 42 |
| All American Club Wrap, 1 wrap | 630 | 27 | 56 | 42 |
| Rotisserie-style chicken on plain Wrap, 1 serving | 500 | 15 | 54 | 38 |
(Source: fatsecret.com)
| Subway Salads | Calories (kcal) | Fat (g) | Carbs (g) | Protein (g) |
| Oven Roasted Turkey Salad, 1 serving | 210 | 9 | 12 | 22 |
| Buffalo Chicken Salad with grilled chicken, 1 serving | 300 | 19 | 13 | 20 |
| Oven Roasted Chicken Salad, 1 serving | 130 | 4 | 11 | 16 |
| Sweet onion Chicken Teriyaki Salad, 1 serving | 260 | 4 | 43 | 19 |
| Veggie Delite Salad, 1 serving | 50 | 1 | 9 | 3 |
| Tuna Salad, 1 serving | 310 | 24 | 10 | 15 |
| Rotisserie-style Chicken Salad, 1 serving | 150 | 5 | 10 | 18 |
| Steak and Cheese Salad, 1 serving | 210 | 9 | 12 | 22 |
| Italian B.M.T Salad, 1 serving | 240 | 15 | 12 | 14 |
(Source: fatsecret.com)
| Subway Sauces | Calories (kcal) | Fat (g) | Carbs (g) | Protein (g) |
| Franks Red Hot Buffalo Sauce, 1 serving | 5 | 0 | 1 | 0 |
| Peppercorn ranch Sauce, 1 serving | 80 | 8 | 1 | 0 |
| Sweet Onion Teriyaki Sauce, 1 serving | 30 | 0 | 7 | 0 |
| Baja Chipotle Southwest Sauce, 1 serving | 70 | 7 | 1 | 0 |
| Oil and Vinegar, 1 serving | 45 | 5 | 0 | 0 |
| Oil, 1 serving | 45 | 5 | 0 | 0 |
| Barbecue Sauce, 1 serving | 30 | 0 | 7 | 0 |
| Little Cheesesteak, 1 serving | 30 | 0 | 7 | 0 |
(Source: fatsecret.com)
| Subway Cookies | Calories (kcal) | Fat (g) | Carbs (g) | Protein (g) |
| Oatmeal Raisin, 1 serving | 200 | 8 | 30 | 3 |
| Raspberry Cheesecake, 1 serving | 210 | 9 | 29 | 2 |
| White Chip Macadamia Nut, 1 serving | 210 | 10 | 28 | 2 |
| Double Chocolate Cookies, 1 cookie | 210 | 9 | 30 | 2 |
(Source: fatsecret.com)
Conclusion
Subway has shown remarkable growth and innovation at the start of 2024, underlined by the introduction of new menu items and continued positive sales momentum. A significant highlight is the launch of the Subway Sidekicks, including Footlong Cookies, Cinnabon® Footlong Churros, and Auntie Anne's® Footlong Pretzels, which saw over 3.5 million units sold within just two weeks of their debut. This surge in demand underscores Subway's successful efforts in menu innovation and its ability to meet and exceed consumer expectations.
Moreover, Subway has reported a strong performance in the first quarter of 2023, with a 12.1% increase in same-store sales globally and an 11.4% increase in digital sales. In North America, same-store sales rose by 11.7%, with digital sales seeing a 21.2% increase. This performance is part of a broader trend of consistent growth, marking Subway's ninth consecutive quarter of positive sales. Additionally, Subway achieved its highest weekly average unit volume (AUV) in the U.S. since 2010 during the second quarter.
These achievements reflect Subway's strategic focus on guest experience, digital innovation, and franchisee profitability. Looking forward, Subway aims to maintain this momentum with new menu offerings, further enhancements to the digital experience, and smart growth strategies including international expansion and modernization of restaurant locations.
Sources
FAQ.
As of today, the brand is valued at around $10 billion.
The Subway Footlong Sandwich is 12 inches.
Compared to other fast-food restaurant chains, Subway offers healthier options with choices of bread, filling, and toppings. Their food is freshly cut and has a great amount of fiber and protein.

Barry is a lover of everything technology. Figuring out how the software works and creating content to shed more light on the value it offers users is his favorite pastime. When not evaluating apps or programs, he's busy trying out new healthy recipes, doing yoga, meditating, or taking nature walks with his little one.