
Alcoholism Statistics – By Country, Demographics, Industry, Location, Deaths, Reasons and Hangover
Page Contents
- Introduction
- Editor’s Choice
- What is Alcoholism?
- Drawbacks of alcoholism
- Complications From Excessive Drinking
- General Alcoholism Statistics
- Alcoholism Statistics By Country
- Alcoholism Statistics By Treatment
- Alcoholism Statistics By Demographics
- Alcoholism Statistics By Occasion
- Alcoholism Statistics By Deaths
- Alcoholism Statistics By Disorder
- Alcoholism Statistics By Type
- Further Insights Into Preferred Types of Alcoholic Drinks are as follows:
- Alcoholism Statistics By Industry
- Alcoholism Statistics By Working Location
- Alcoholism Statistics By Reasons
- Alcoholism Statistics By Hangover
- Alcoholism Statistics By Student
- Conclusion
Introduction
Alcoholism Statistics: Drinking Alcohol every day has become extremely common today and people are facing severe health issues. Moreover, Unlike in the old days, alcohol-selling shops as restaurants offering international brands have also become usual. Such drinks are easily available in grocery shops. Therefore, worldwide alcoholic beverage consumption is projected to increase up to 312,660.08 million liters by the year 2025.
These Alcoholism Statistics are circled with many segments including the students.
Editor’s Choice
- Alcoholism or excessive drinking in women includes 8 or more drinks and for men 15 or more drinks in a week.
- On a worldwide range, every year 3 million deaths are reported due to alcohol abuse.
- Alcoholism Statistics say that in the United States of America around 385 people die every day because of excessive drinking habits.
- Single fathers and single mothers are respectively excessive drinkers at 9.3% and 6.3%.
- In the case of alcohol abuse men are 3 times more likely to die than women.
- 1 out of 5 excessive alcohol-drinking-related deaths is reported between the age of 20 years to 49 years.
- Overall, Americans with excessive drinking habits lose 3.59 million years of potential life.
- Worldwide, alcoholism plays a 5.1% part as a reason to disease and injury related to heavy drinking.
- In the United States of America, per capita, alcohol consumption is 2.45.
- As of 2021, around 2.5 million treatments related to alcohol abuse were recorded in the United States of America.
You May Also Like To Read:
- Drinking At Work Statistics
- Most Expensive Alcoholic Drinks
- Most Expensive Tequilas
- Most Expensive Champagne Bottles
What is Alcoholism?
Alcoholism or alcohol abuse or alcohol use disorder (AUD) or alcohol dependence, is referred to when a person has a habit to drink excessive alcohol on a daily average. Comparing to moderate drinkers these types of people drink more than necessary and are more likely to lose consciousness. Alcoholism badly affects physical as well as mental health. When it becomes a habit, and the person is addicted it requires medical attention to withdraw the symptoms. During the withdrawal symptoms, it is difficult to manage the person as he may do such uncontrollable things.
Drawbacks of alcoholism
By Short Term
- Stillbirths or Miscarriage
- Alcohol poisoning
- Injuries such as drowning, burns, or a motor vehicle crash.
- High-risk sexual activities.
- Unconsciousness
- Increased expenses on the purchase of alcoholic drugs.
You May Also Like to Read: Top 10 Most Expensive Alcoholic Drinks in the World
By Long Term
- Alcohol dependence.
- Depression, anxiety, and other mental health problems.
- Memory-related issues.
- Increased risk in the diagnosis of cancer such as voice box, liver, throat, breast, rectum, or esophagus.
- Other health issues such as liver disease, digestive problems, high blood pressure, and heart disease.
- Or alcohol-related deaths.
Complications From Excessive Drinking
- Brain damage.
- Dehydration
- Seizures
- Hypothermia
- Irregular heartbeat.
- Difficulty in breathing.
- Death
General Alcoholism Statistics
- Worldwide, alcoholism plays a 5.1% part as a reason to disease and injury related to heavy drinking.
- Alcoholism Statistics say that in the United States of America around 385 people die every day because of excessive drinking habits.
- On a worldwide range, every year 3 million deaths are reported due to alcohol abuse.
- In the case of alcohol abuse men are 3 times more likely to die than women.
- Overall, Americans with excessive drinking habits lose 3.59 million years of potential life.
- Single fathers and single mothers are respectively excessive drinkers at 9.3% and 6.3%.
- In the United States of America, out of $5, $2 of the economic cost of excessive alcohol use, was paid by the local, state, and federal governments.
- 1 out of 5 excessive alcohol-drinking-related deaths is reported between the age of 20 years to 49 years.
- In the United States of America, per capita, alcohol consumption is 2.45.
- There are 36% of students learning in 8,10 and 12 grades have once drunk alcohol in their lifetime.
- 8% of males between 18 to 25 years continuously drank in the year 2021.
- 1 out of 4 Americans has reported binge drinking in the past 30 days of life.
- 6% of deaths around the world are due to alcoholism.
- Alcoholism or excessive drinking in women includes 8 or more drinks and for men 15 or more drinks in a week.
Alcoholism Statistics By Country
By Highest
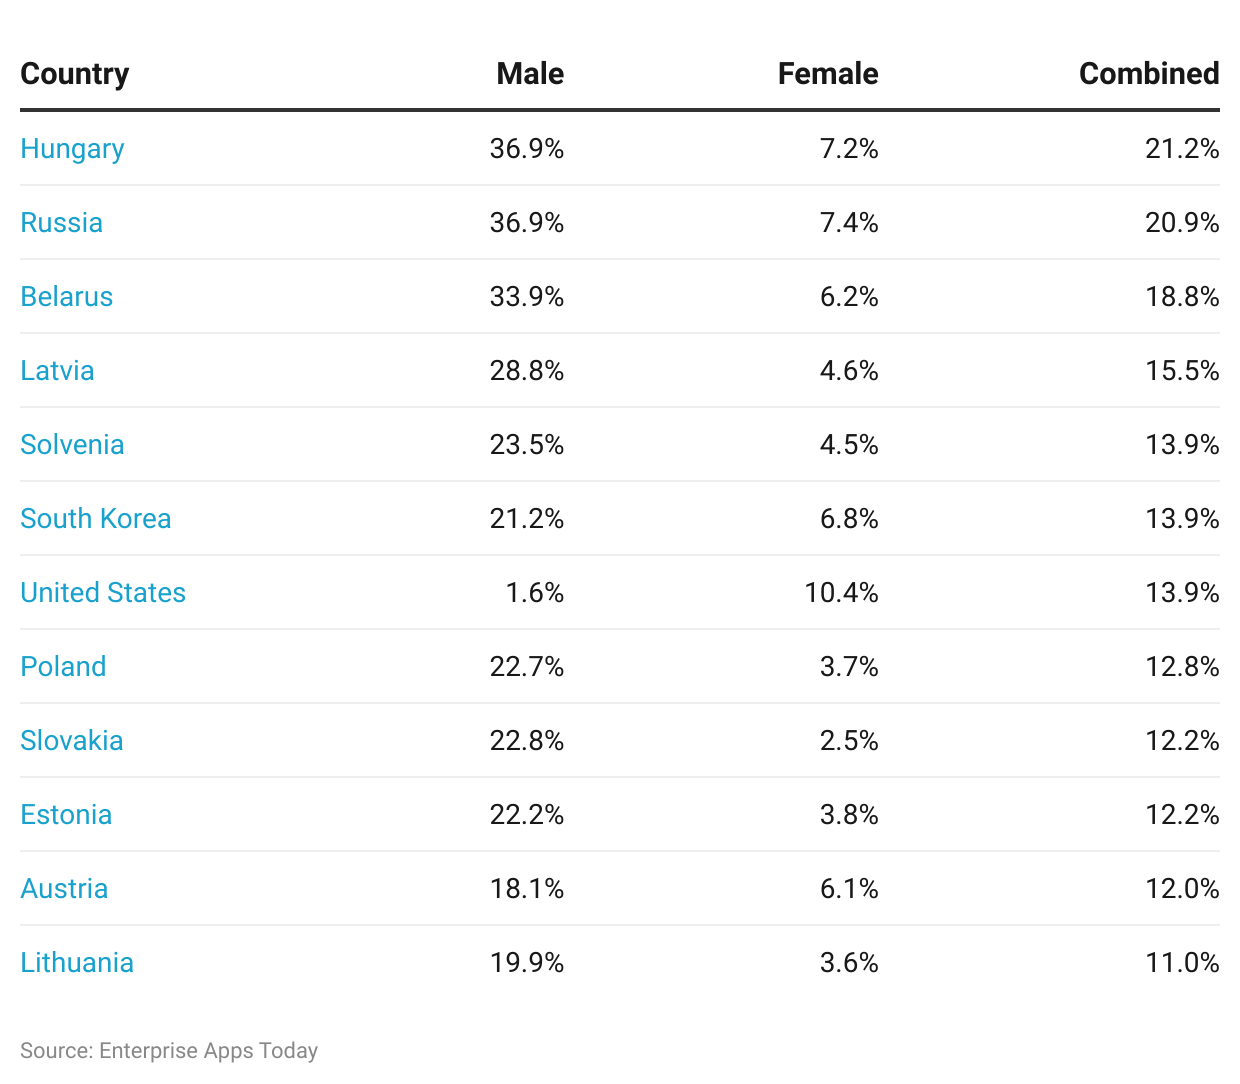
(Reference: worldpopulationreview.com)
- As per the Alcoholism Statistics of 2023, the highest rate of drug abuse country is Hungary resulting in 21.2% out of these 36.9% being male and 7.2% being female.
- The list is further followed by Russia and Belarus showing respective rates of 20.9% and 18.8%.
- Russia has a 36.9% of male population and 7.4% of the female population and Belarus has 33.9% male and 6.2% female with alcoholism.
- This is further continued with the following insights: Latvia: 15.5% (M: 28.8% and F: 4.6%), Slovenia:13.9% (M: 23.5% and F: 4.5%), South Korea: 21.2% (M: 6.8% and F: 13.9%), United States of America: 13.9% (M: 17.6% and F: 10.4%), Poland: 12.8% (M: 22.7% and F: 3.7%), Slovakia: 12.2% (M: 22.8% and F: 2.5%), Estonia: 12.2% (M: 22.2% and F: 3.8%), Austria: 12% (M: 18.1% and F: 6.1%), and Lithuania: 11% (M: 19.9% and F: 3.6%).
Alcoholism Statistics By Treatment
- In the United States of America, 50% of adults with immoderate drinking habits received treatment from self-help.
- As of 2021, around 2.5 million treatments related to alcohol abuse were recorded in the United States of America.
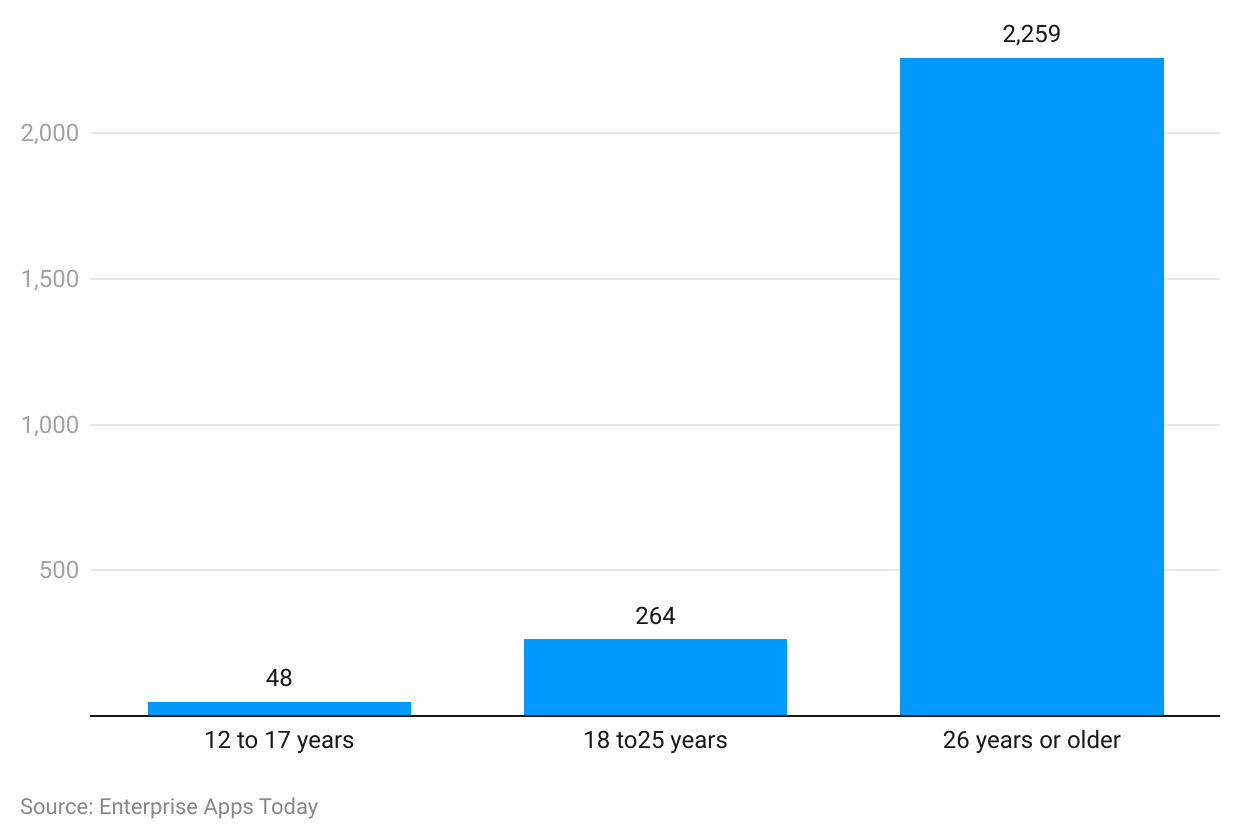
(Reference: Statista.com)
- As of 2021, in the United States of America, there were 48 people aged between 12 to 17 years with alcohol use treatment.
- Furthermore, there were 264 people aged between 18 to 25 years who received similar treatment.
- And 2,259 people were 26 years and above.
Alcoholism Statistics By Demographics
- Alcoholism Statistics segmented by income level and drinking habits are shown in the chart below.
By Income Level
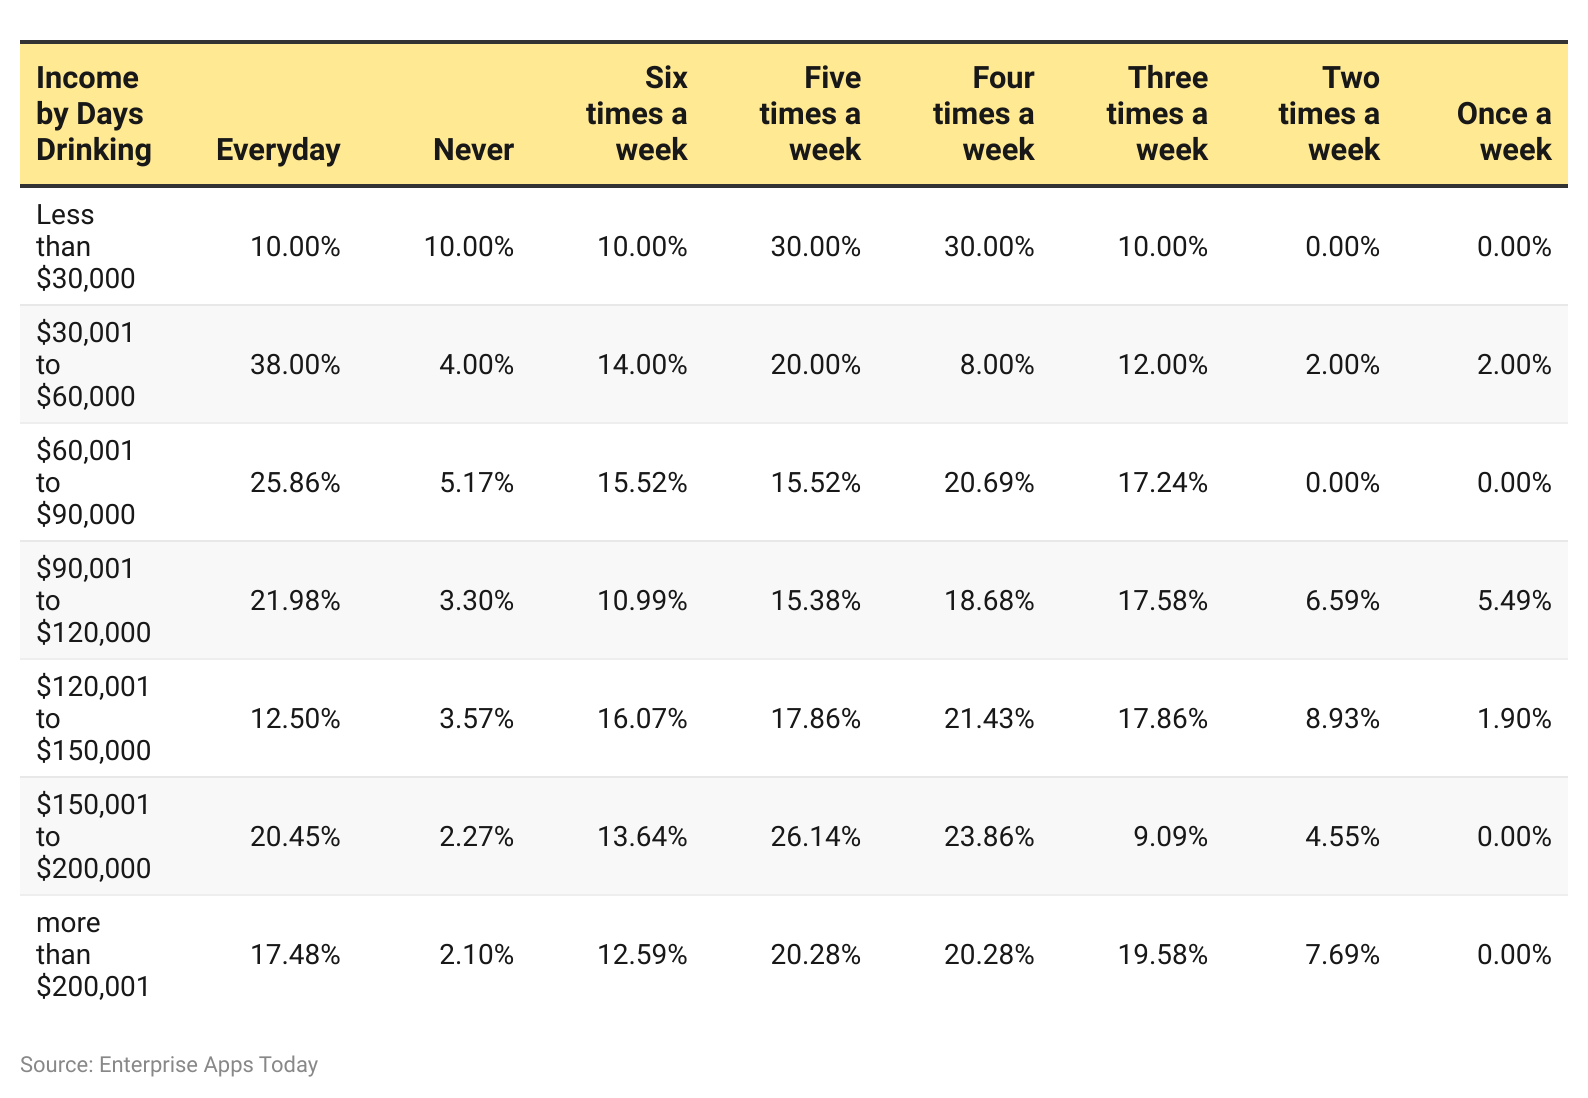
(Reference: Sunnyside.co)
By Status
- Furthermore, the below chart explains the habit of drinking segmented by marital status as of 2022.
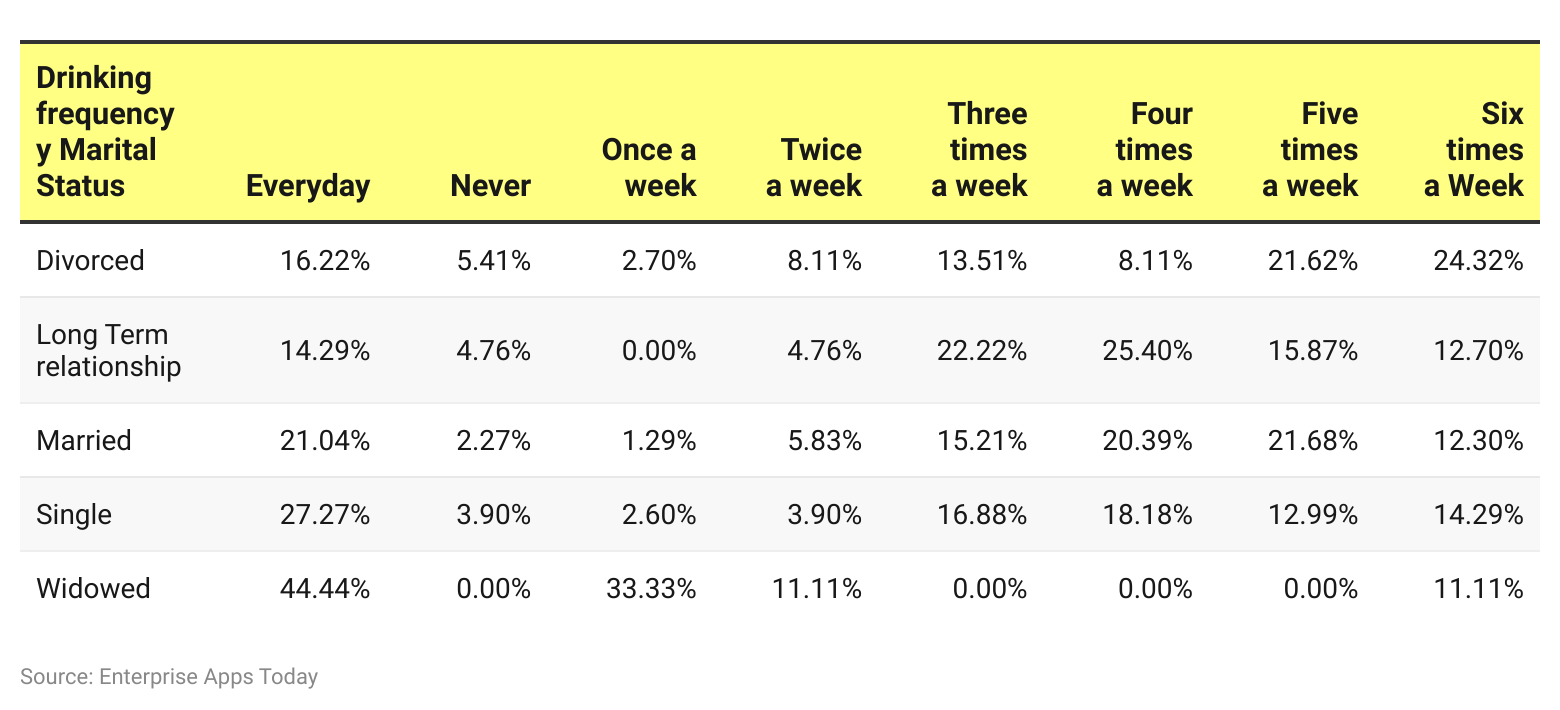
(Reference: Sunnyside.co)
By Gender
(Reference: Sunnyside.co)
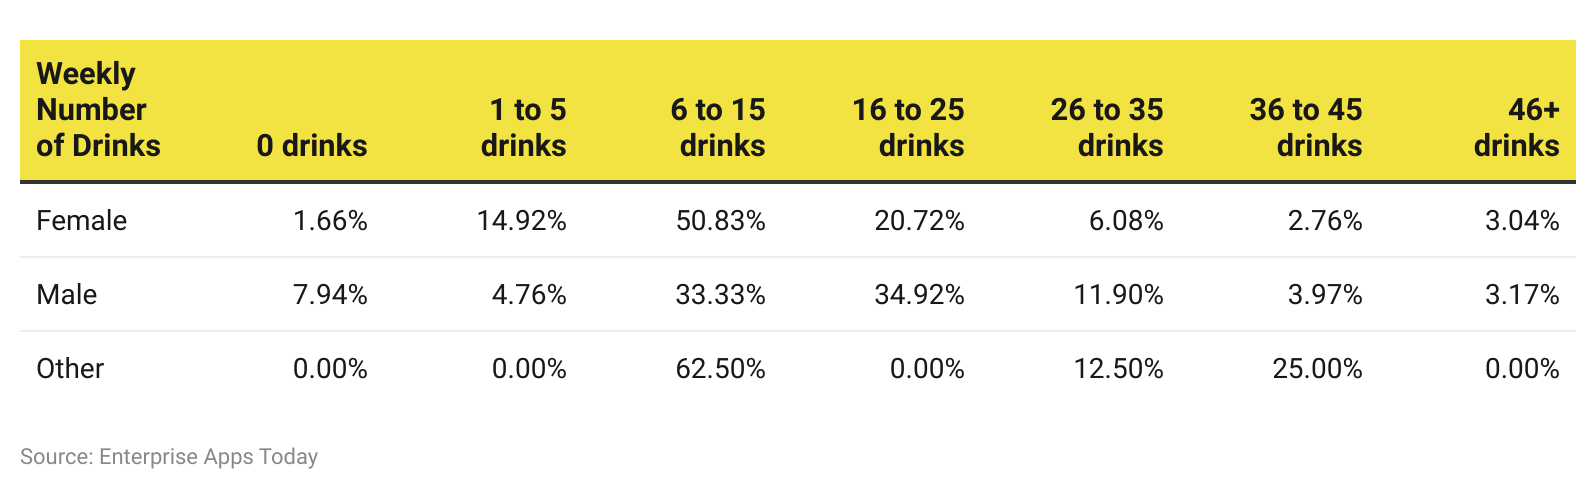
The following insights studied by Alcoholism Statistics explain the weekly consumption by the number of drinks taken.
By Female Population
- No drinks (1.66%)
- 1 to 5 drinks (14.92%)
- 6 to 15 drinks (50.83%)
- 16 to 25 drinks (20.72%)
- 26 to 35 drinks (6.08%)
- 36 to 45 drinks (2.76%)
- And more than 46 drinks (3.04%)
By Male Population
- No drinks (7.94%)
- 1 to 5 drinks (4.76%)
- 6 to 15 drinks (33.33%)
- 16 to 25 drinks (34.92%)
- 26 to 35 drinks (11.90%)
- 36 to 45 drinks (3.97%)
- And more than 46 drinks (3.17%)
Other
- 6 to 15 drinks (62.50%)
- 26 to 35 drinks (12.50%)
- 36 to 45 drinks (25%)
By Age
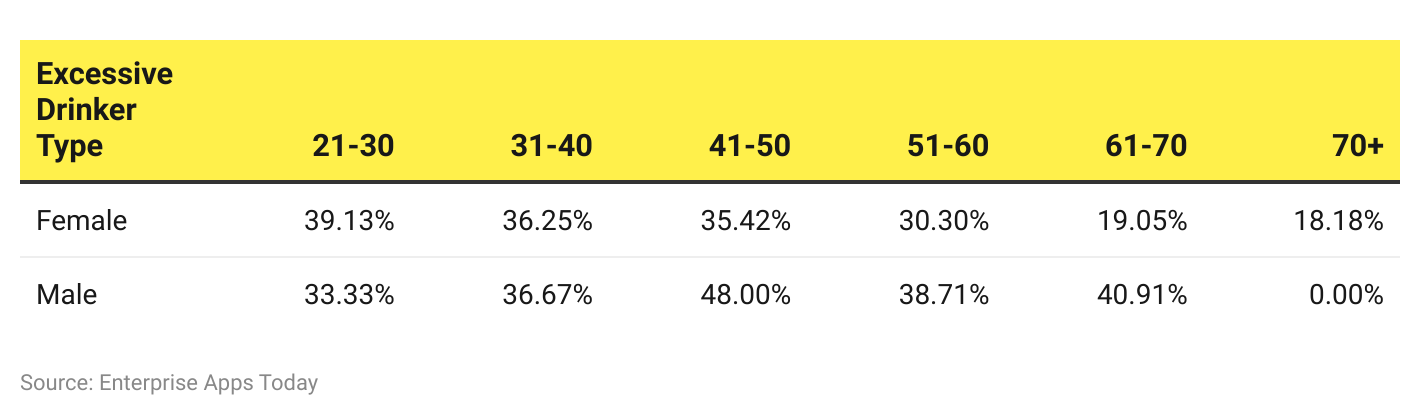
(Reference: Sunnyside.co)
- Excessive drinkers as of 2022 stated by Alcoholism Statistics, belong to all ages following are the insights.
Female
- 21 to 30 years (39.13%)
- 31 to 40 years (36.25%)
- 41 to 50 years (35.42%)
- 51 to 60 (30.30%)
- 61 to 70 years (19.05%)
- 70 years and above (18.18%)
Male
- 21 to 30 years (33.33%)
- 31 to 40 years (36.67%)
- 41 to 50 years (48%)
- 51 to 60 (38.71%)
- 61 to 70 years (40.91%)
- 70 years and above (0%)
Alcoholism Statistics By Occasion
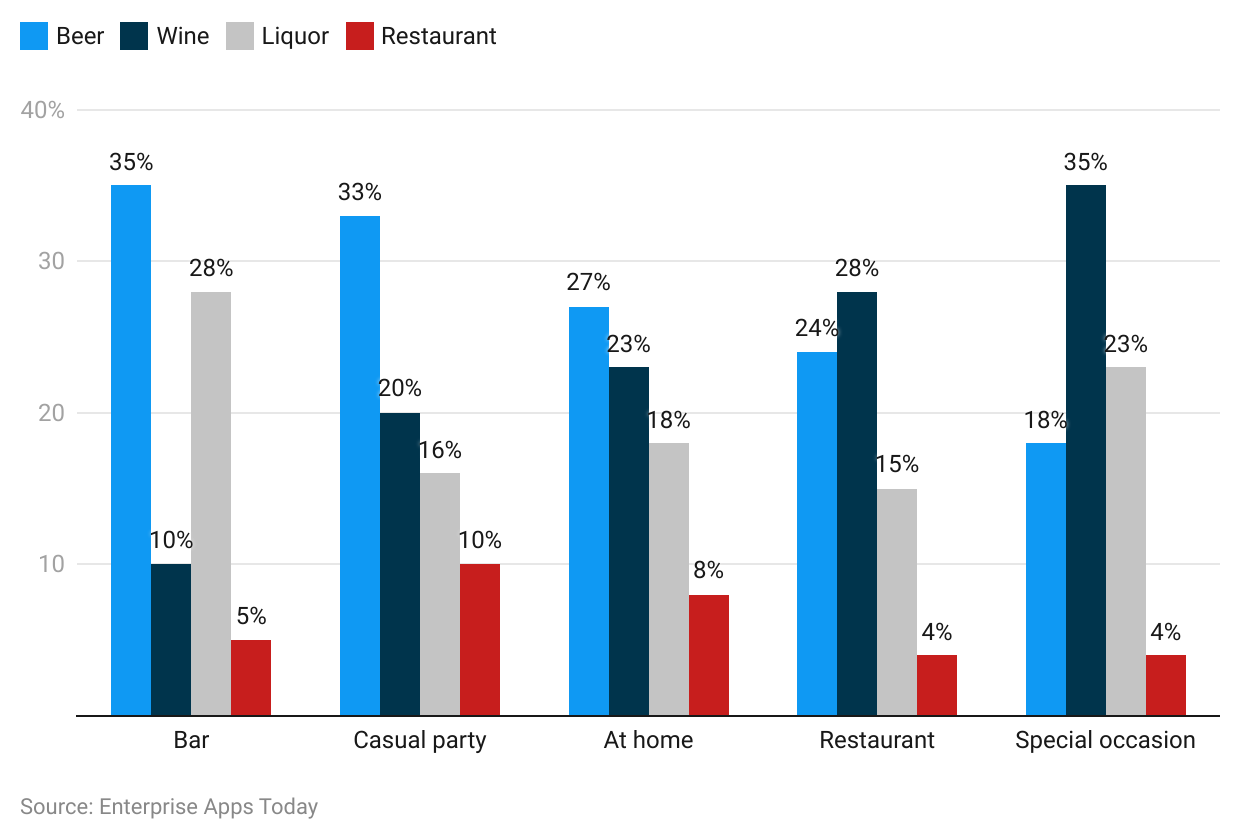
(Reference: Statista.com)
- On average as per the Alcoholism Statistics, in the United States of America as of 2022, the selected group of people stated the various alcohol segment preference by occasion, following are the insights.
People Who Drink at the Bar
- Beer (35%)
- Wine (10%)
- Liquor (28%)
- Hard Seltzer (5%)
People Who Drink at a Casual Party
- Beer (33%)
- Wine (20%)
- Liquor (16%)
- Hard Seltzer (10%)
People Who Drink at Home
- Beer (27%)
- Wine (23%)
- Liquor (18%)
- Hard Seltzer (8%)
People Who Drink at the Restaurants
- Beer (24%)
- Wine (28%)
- Liquor (15%)
- Hard Seltzer (4%)
People Who Drink During Special Occasions
- Beer (18%)
- Wine (35%)
- Liquor (23%)
- Hard Seltzer (4%)
Alcoholism Statistics By Deaths
| Characteristics | |
|---|---|
| Number of deaths per year (in millions) | 3 |
| Percentage of all (%) | 5.3 |
| Percentage of total disease and injury burden (%) | 5.1 |
| Percentage of all deaths among 20-39 year-olds (%) | 13.5 |
(Reference: Statista.com)
- Out of the reported 3 million alcohol-related deaths as of 2022, 5.1% belonged to the total disease and injury burden.
- The total percentage of alcohol-related death around the world is 5.3%.
- 5% of deaths were reported to people aged between 20 to 39 years.
Alcoholism Statistics By Disorder
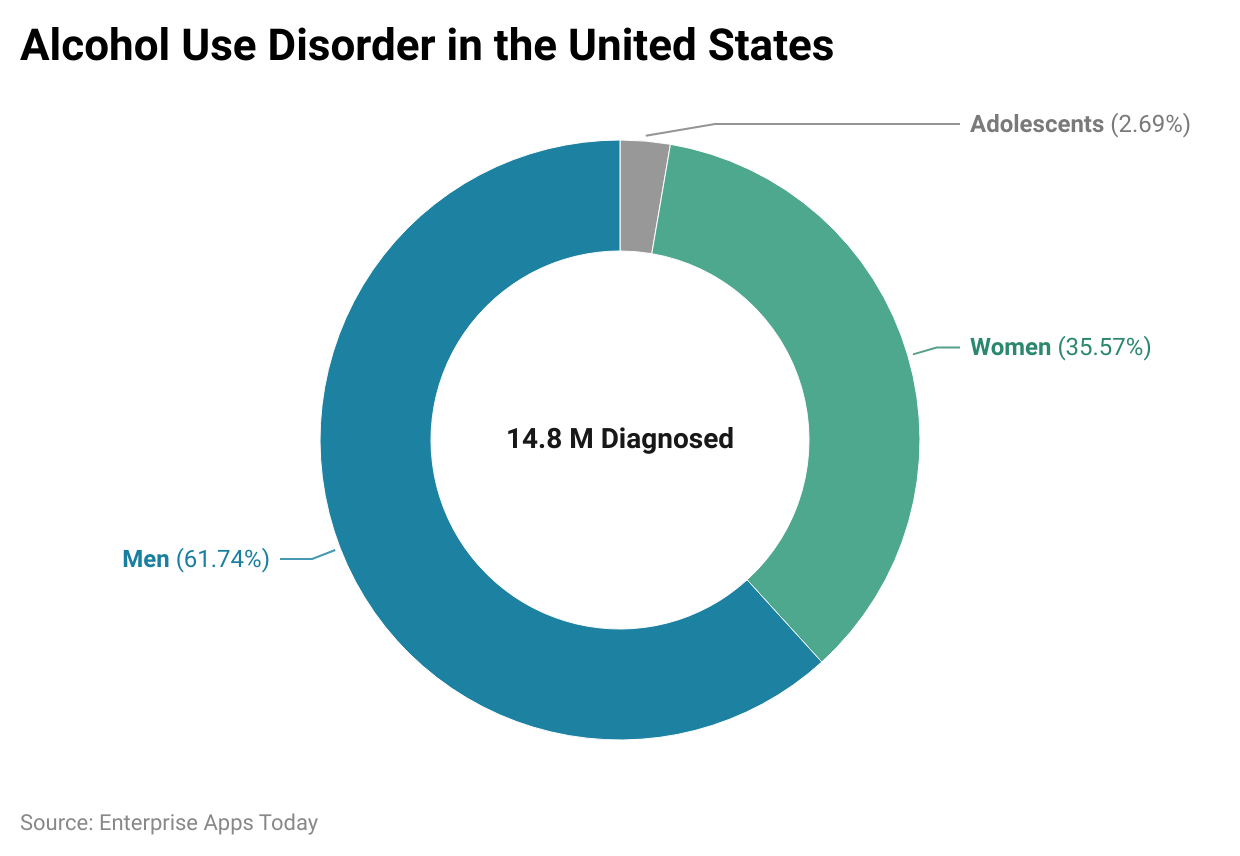
(Reference: drugabusestatistics.org)
- As of 2021, in the United States of America, around 14.8 million people were diagnosed with alcohol use disorder.
- Out of these 2.69% were adolescents, 35.57% were women and 61.74% were men.
Alcoholism Statistics By Type
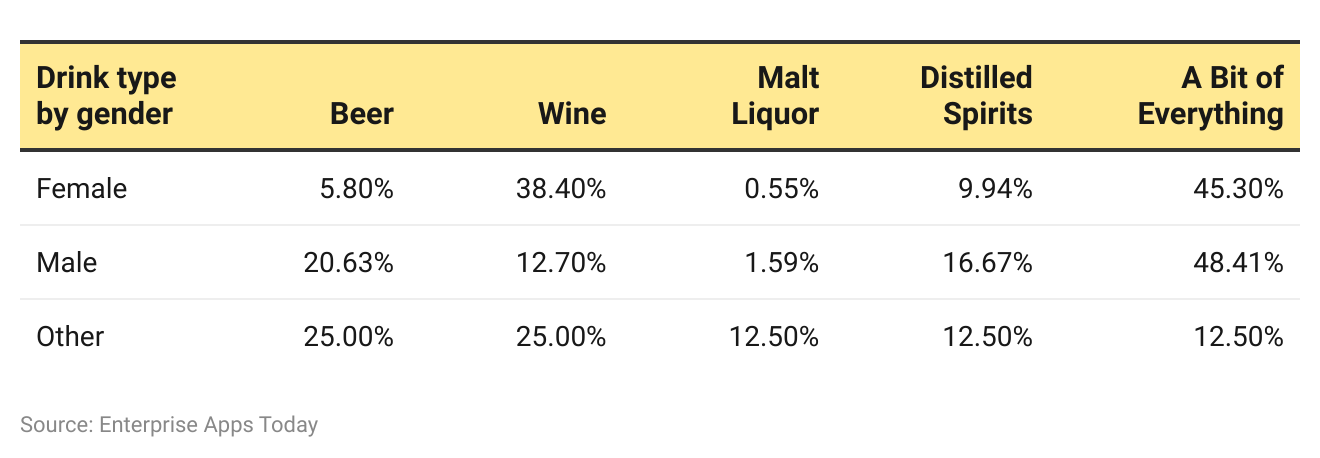
(Reference: Sunnyside.co)
- Alcoholism Statistics by type state that, the highest number of types of preferred alcoholic drinks by women is wine resulting in 38.40% while the male population prefers beer resulting in 20.63%.
Further Insights Into Preferred Types of Alcoholic Drinks are as follows:
Female
- Beer (5.80%)
- Malt Liquor (0.55%)
- Distilled Spirits (9.94%)
- Taste from everything (45.30%)
Male
- Wine (12.70%)
- Malt Liquor (1.59%)
- Distilled Spirits (16.67%)
- Taste from everything (48.41%)
Other
- Beer (25%)
- Wine (25%)
- Malt Liquor (12.50%)
- Distilled Spirits (12.50%)
- Taste from everything (12.50%)
Alcoholism Statistics By Industry
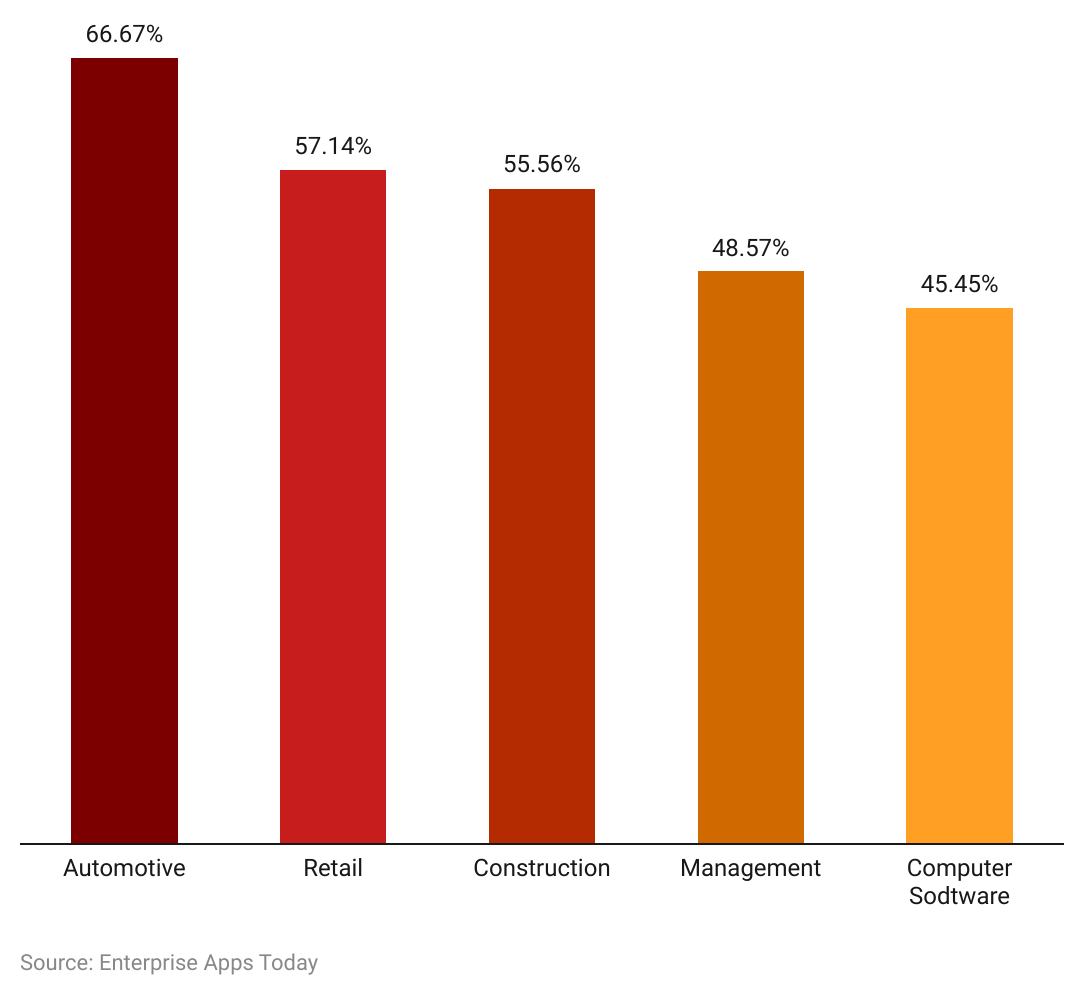
(Reference: Sunnyside.co)
- The highest ever excessive drinkers belong to the automotive industry resulting in 66.67%, while there is 57.14% from the retail industry.
- 56% of drinkers who drink 16 times or more in a week work in the construction industry while 48.57% work in the management industry.
- The lowest of all percentage of people who drink 16 times or more every week work in computer software industries resulting in 45.45%.
Alcoholism Statistics By Working Location
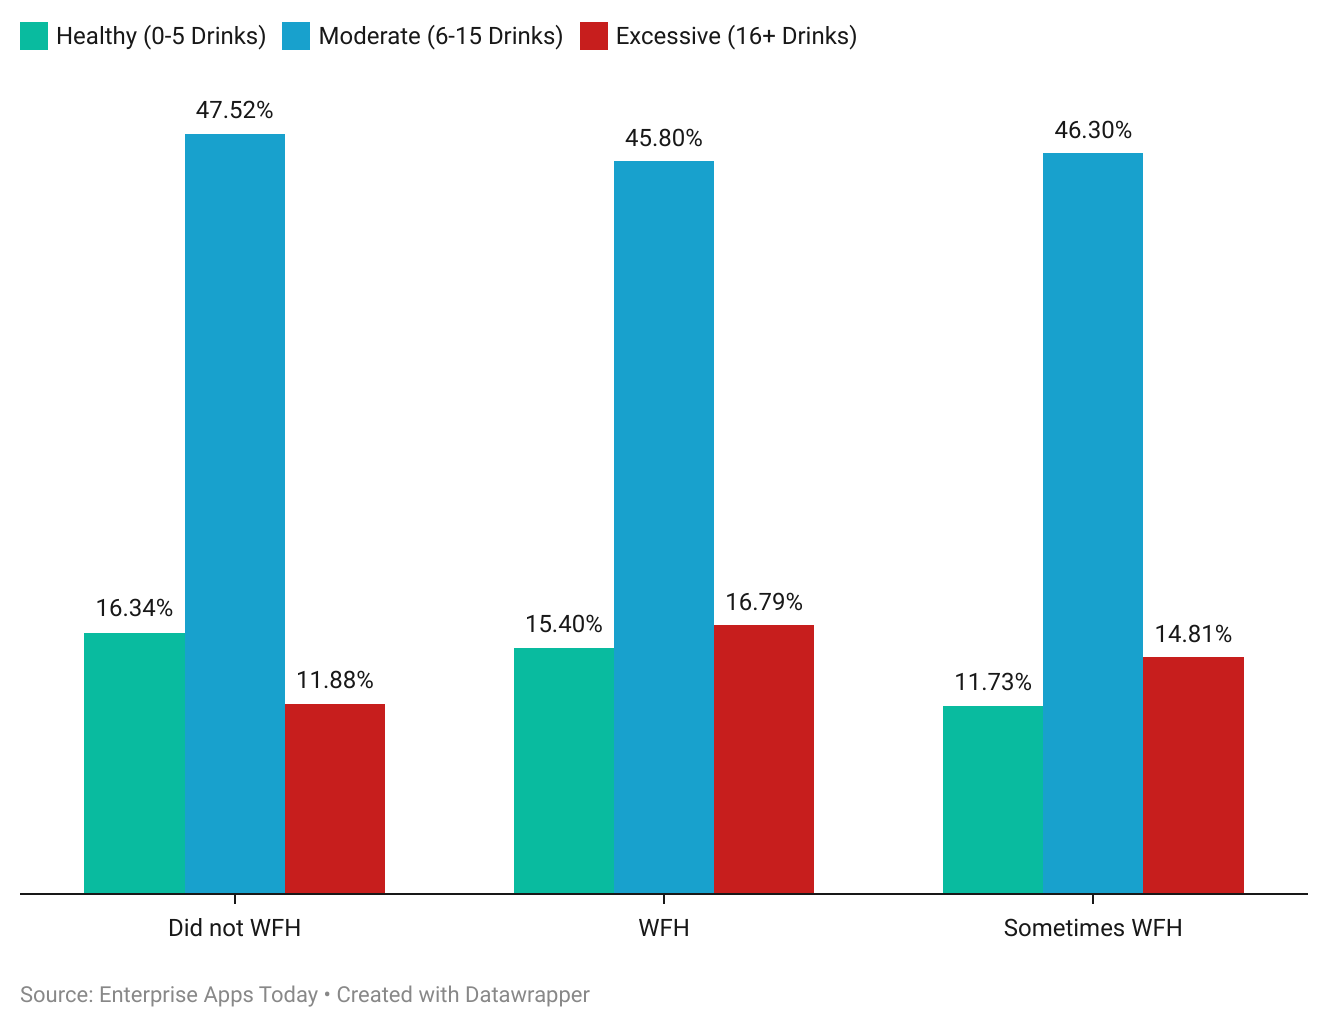
(Reference: Sunnyside.co)
- Considering the recent trends of remote work, some employees associated alcoholism with the term.
Employees who did not work from home:
- Healthy drinking 0 to 5 drinks (16.34%)
- Moderate 6 to 15 drinks (47.52%)
- Excessive 16-plus drinks (11.88%)
Employees with Work from home facility
- Healthy drinking 0 to 5 drinks (14.5%)
- Moderate 6 to 15 drinks (45.8%)
- Excessive 16-plus drinks (16.79%)
Occasional Work from home
- Healthy drinking 0 to 5 drinks (11.73%)
- Moderate 6 to 15 drinks (46.3%)
- Excessive 16-plus drinks (14.81%)
Alcoholism Statistics By Reasons
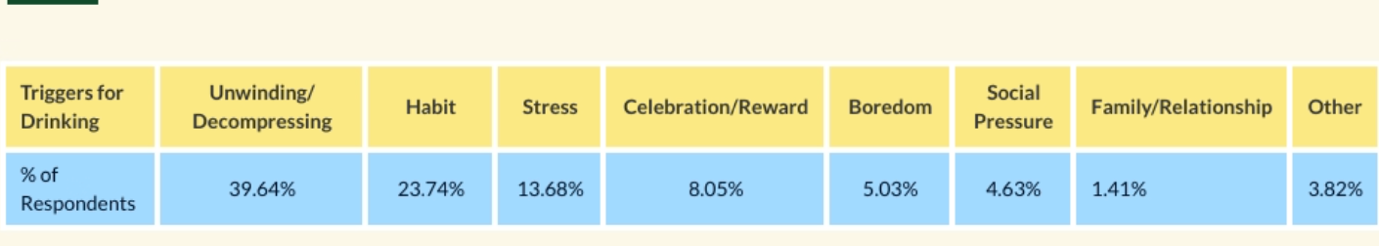
(Reference: Sunnyside.co)
- As of 2022, the highest number of drinkers told the reasons by which the activity is triggered is because of decompressing/unwinding resulting in 39.64%.
- Furthermore, 23.74% of people said they do it due to habit while 13.68% drink because of stress.
- 05% consider it as due to celebration/ reward and while 5.03% drink out of boredom.
- On the other hand, 4.63% drink because of social pressure and 1.41% said, they do it because of family/ relationship.
- 82% of people gave other various reasons.
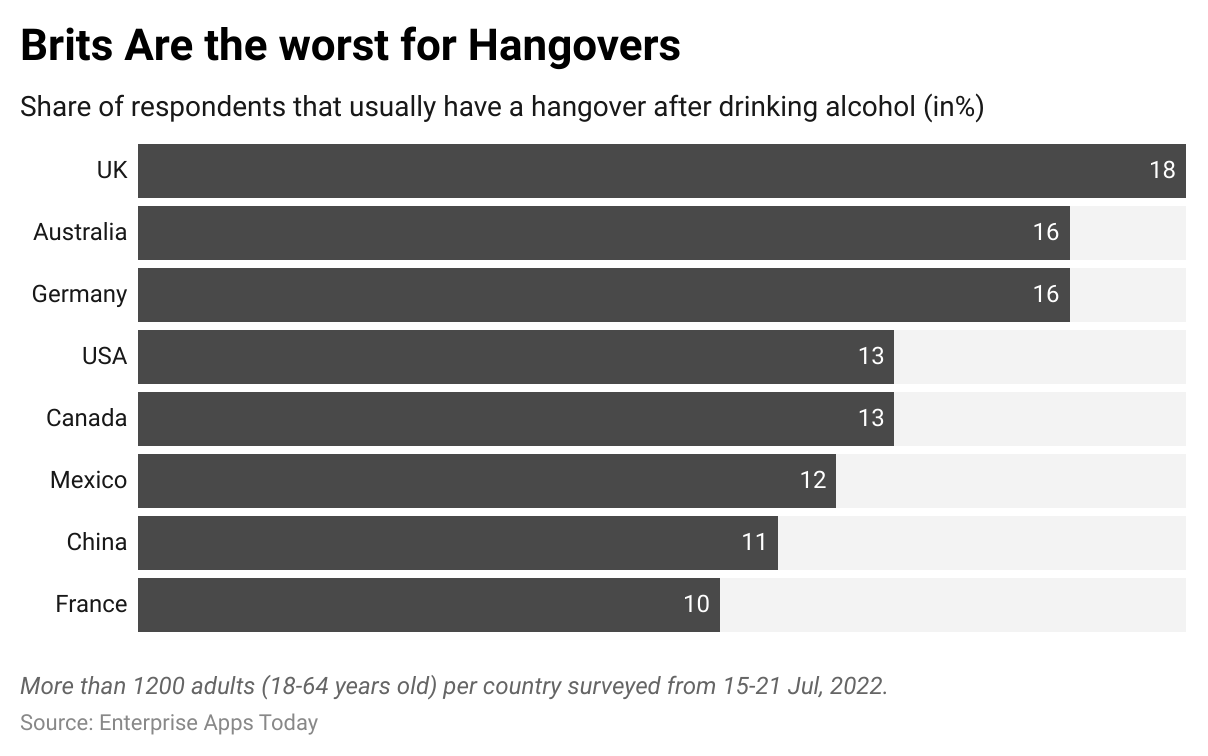
Alcoholism Statistics By Hangover
(Reference: Statista.com)
- As of July 2022, in the United Kingdom, 18% of people reported having a hangover after drinking alcohol.
- Moreover, residents in Australia and Germany similarly reported a rate of hangover of 16%.
- In the United States of America and Canada, 13% of people said they usually experience hangovers after drinking alcohol.
- Furthermore, similar incidents are usually faced by 12%, 11%, and 10% of people living in Mexico, China, and France.
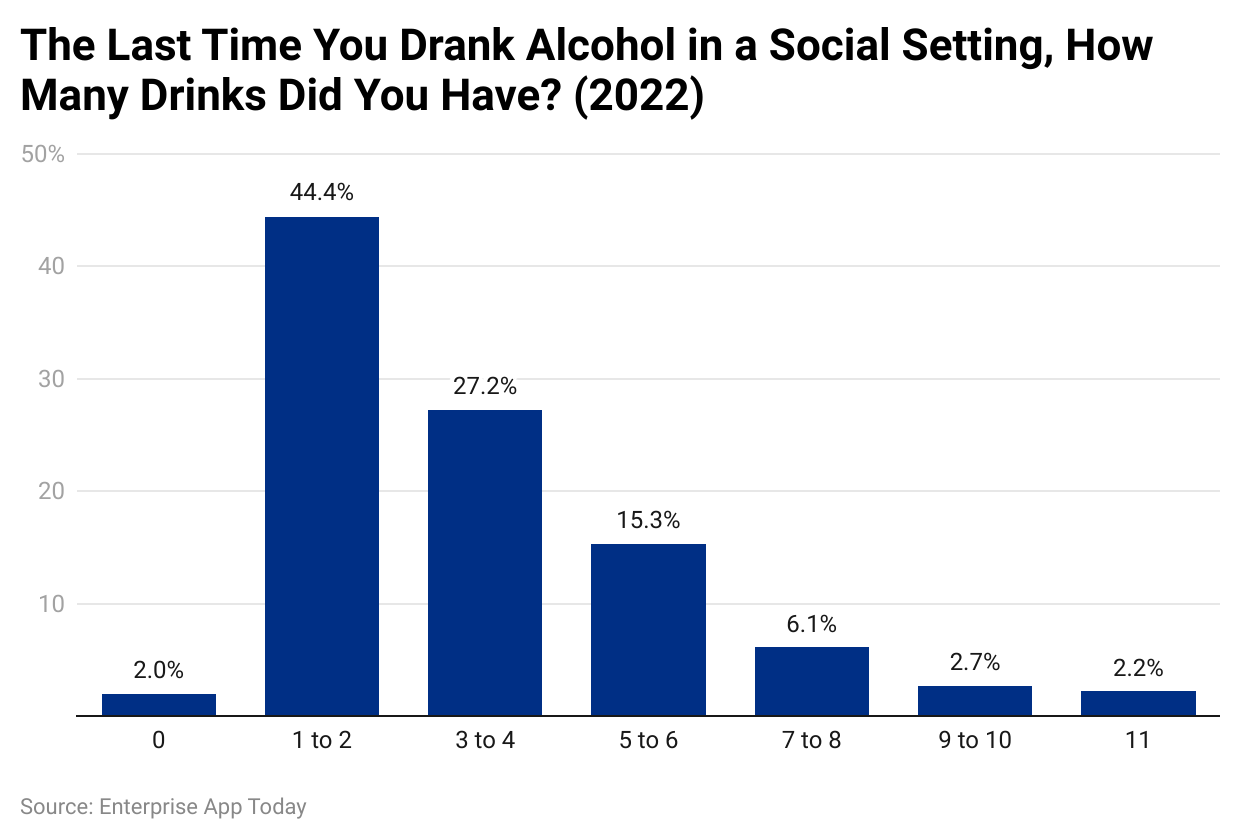
Alcoholism Statistics By Student
(Reference: bestcolleges.com)
- In the United States of America as of 2022, Alcoholism Statistics studied that in a social setting, 44.4% of the students during the last time drank alcohol once or twice.
- Similarly, there were only 2% of students didn’t drink anything at all.
- As of 2022, there were 27.2% and 15.3% of students who respectively had a drink at least 3 to 4 times and 5 to 6 times.
- Moreover, some students drank 7 to 8 times and 9 to 10 times resulting in 6.1% and 2.7%.
- On the other hand, 2.2% of students reported drinking more than 10 drinks in the last social setting.
Conclusion
Alcoholism is a global problem and is commonly found in all genders. There are multiple reasons why people are attracted to alcoholic drugs, but reducing pain or stress doesn’t always need alcohol. Occasional drinking has its advantages and cannot be mixed with regular drinking habits. It is up to us to control such habits, rather than talking about changing the world, start from you, it will make a difference. Therefore, concluding the Alcoholism Statistics with the hope to see a positive change!
Sources
FAQ.
The standard drink is 14 grams which is 0.6 ounces of pure alcohol. Following are the measurements for the same:
1.5 ounces or shot (whiskey, vodka, gin, rum) (40%)
5 ounces of wine (12%)
8 ounces of malt liquor (7%)
12 ounces of beer (5%)
Alcohol is made up of starch, sugar, and yeast and is found in beer, liquor, and wine. It is referred to as ethyl alcohol.
Red wine is beneficial for health because it is high in healthy antioxidants.
Corona, Beck’s, Leffe, Budweiser Hoegaarden, Skol, Brahma, and Stella Artois are some of the famous alcoholic beverage companies

By conducting scientific research, I write about illness, health and healthcare. As a professional medical writer, my experience includes creating feature articles for newsletters and websites as well as research news stories for doctors and researchers. Reading has been an integral part of me since childhood - I'm fan of "Friends" and the "Harry Potter series". Before this career, I was employed by a French multinational company. However, my passion for reading led me to pursue writing professionally; my first Amazon-published short story entitled "The envelope that changed our lives" has recently been released. In my free moments, I enjoy long bike rides around town.