
Apple Statistics By Products and Services, Demographics, Brand Value, Market Share, Social Media Network Traffic in the US, Region
Page Contents
- Introduction
- Editor’s Choice
- What is Apple?
- Products and Services of Apple, Inc.
- Features of Apple Products
- General Apple Statistics
- Apple Statistics by Products and Services
- By iPhone
- iPhone Market Share by Country
- Apple Statistics by Market Share in the US
- Apple Statistics by Demographics
- Apple Statistics by The Total Number of Stores
- Apple Statistics by Brand Value
- Apple Statistics by Traffic Sources
- Apple Statistics by Social Media Network Traffic
- Apple Statistics by Device Traffic
- Apple Statistics by Region
- Apple Statistics by Leading OTT Platform in the US
- Apple Statistics by Popular App Store Categories
- Top 20 Valuable Technology Brands
- Prices of iPhones for Every Household
- Apple Statistics by the Duration of iOS Compatibility for Every iPhone Model
- Conclusion
Introduction
Apple Statistics: Don’t you get confused with the yearly new launches of Apple products? And don’t know which model to buy? Don’t worry this is not a newsletter to clear your confusion, but these are Apple Statistics Go guide on insights collected focusing on the United States of America.
Some of the segments written in these Statistics are way more interesting which might make you buy an iPhone. Tell us your favorite Apple product!
Editor’s Choice
- Apple Statistics further state that 36.5% of the wearables market is captured by Apple.
- As of 2022, Apple has the primary 8 types of products while it comes to 100 if subcategorized by various versions of products.
- iPhone generated the highest percentage of total revenue compared to other Apple devices resulting in 57.8%.
- Considering other types of devices, 34% of the devices are owned by males while 66% of the devices are owned by females.
- The regional disaggregation of net sales state that, the American region generated the highest number of sales in 2022 resulting in $169,658 million.
- As of 2022, Apple TV+ ranked among the top 10 leading video-on-demand brands in the United States of America by having total users of (76%).
- As of November 2022, in the United States of America, the most expensive refurbished model of Apple phones was iPhone 12 Pro (512 GB) costing more than $800.
- iOS has captured 25% of the mobile operating system market around the globe.
- Apple is the number 1 brand in the United States of America in the headphones category.
- Apple Statistics by top app store categories of 2022 in Q3 in the United States of America are Games (12.68%), Business (10.35%), and Education (9.79%).
What is Apple?
Apple, Inc. is an American-based multinational technology company founded by Steve Jobs, Mike Markkula, Ronald Wayne, and Steve Wozniak in 1976. Apple is the global largest technology company by revenue. Its headquarters are in California, USA. Apple sells technologically advanced products all over the world. The primary reason for people to purchase Apple products is because of the security and trend in the markets.
Products and Services of Apple, Inc.
Products
- iPad – iPad Pro, iPad, and iPad mini
- iPhone – iPhone 14 Pro, iPhone 14, iPhone 13, iPhone SE, iPhone 12, and iPhone 11
- Mac – MacBook Pro, MacBook Air, Mac Mini, Mac Studio, Mac Pro, and desktops iMac
Wearables, Home, and Accessories
- HomePod mini, Beats, and accessories.
- Apple TV
- AirPods – AirPods, AirPods Pro, and AirPods Max
- Apple Watch- WatchOS, Apple Watch Ultra, Apple Watch SE, Apple Watch Series 8
Service
- Apple Card
- Apple Pay
- Apple Arcade
- Apple Music
- Apple News+
- Apple TV+
- On-demand radio Stations
- App Store
- Cloud Services
- AppleCare
- Apple Fitness+
- Siri
Features of Apple Products
- Apple Products are long-lasting.
- They are stylish.
- Moreover, they are built with a maximum level of security.
- Regular software updates.
- Various inbuilt features in all types of Apple products.
- These products have great resale value.
- Provides connectivity to the home.
- Family Sharing.
General Apple Statistics
- As of 2022, there are around 1.6 million applications on iOS that are priced at less than $1.
- Apple Statistics state that, Apple App developer earns around 60 billion.
- The average Star rating for the top 10 on Apple App Store is 3.35 stars.
- Currently, there are more than 1 billion active iPhone users globally.
- iOS has captured 25% of the mobile operating system market around the globe.
- Apple captures 20 million to 30 million new users in the market every year.
- As of 2022, Apple has the primary 8 types of products while it comes to 100 if subcategorized by various versions of products.
- As of November 2022, in the United States of America, the most expensive refurbished model of Apple phones was iPhone 12 Pro (512 GB) costing more than $800.
- As of March 2023, apple.com generated around 448.5 million global traffic on the website, while in February it was 419.7 million. This has recorded an increase in visitors by 6.86%.
- In the month of January 2023, the website received 489.5 million traffic from global visitors.
- As of 2023, according to Apple Statistics, the adoption rates for iPhone 13 Pro and iPhone 14 Pro Max are 3.5% and 8.56% respectively.
- Leading iOS among Apple Devices in 2023 is iOS 16.
- Moreover, the total number of apps available on the Apple App Store is 3.80 million.
- 50% of Apple product owners are likely to travel to more than 5 countries.
- 27% of Apple product owners purchase these because of student discounts.
- Apple, Inc. has more than 1,50,000 employees spread across the world, out of these 61% are male and 38% are female.
- Apple company earns $1,820 every 1 second.
- On average, iPhone users check their phones 58 times every day, while 30 times are allotted during work hours.
- Apple Statistics state that, the company sells around 849,450 iPhones a day, breaking into 35,393 per hour and 590 every minute, and 10 iPhones every second.
Apple Statistics by Products and Services
- Apple Statistics further state that 36.5% of the wearables market is captured by Apple.
(Image Source: mackeeper.com)
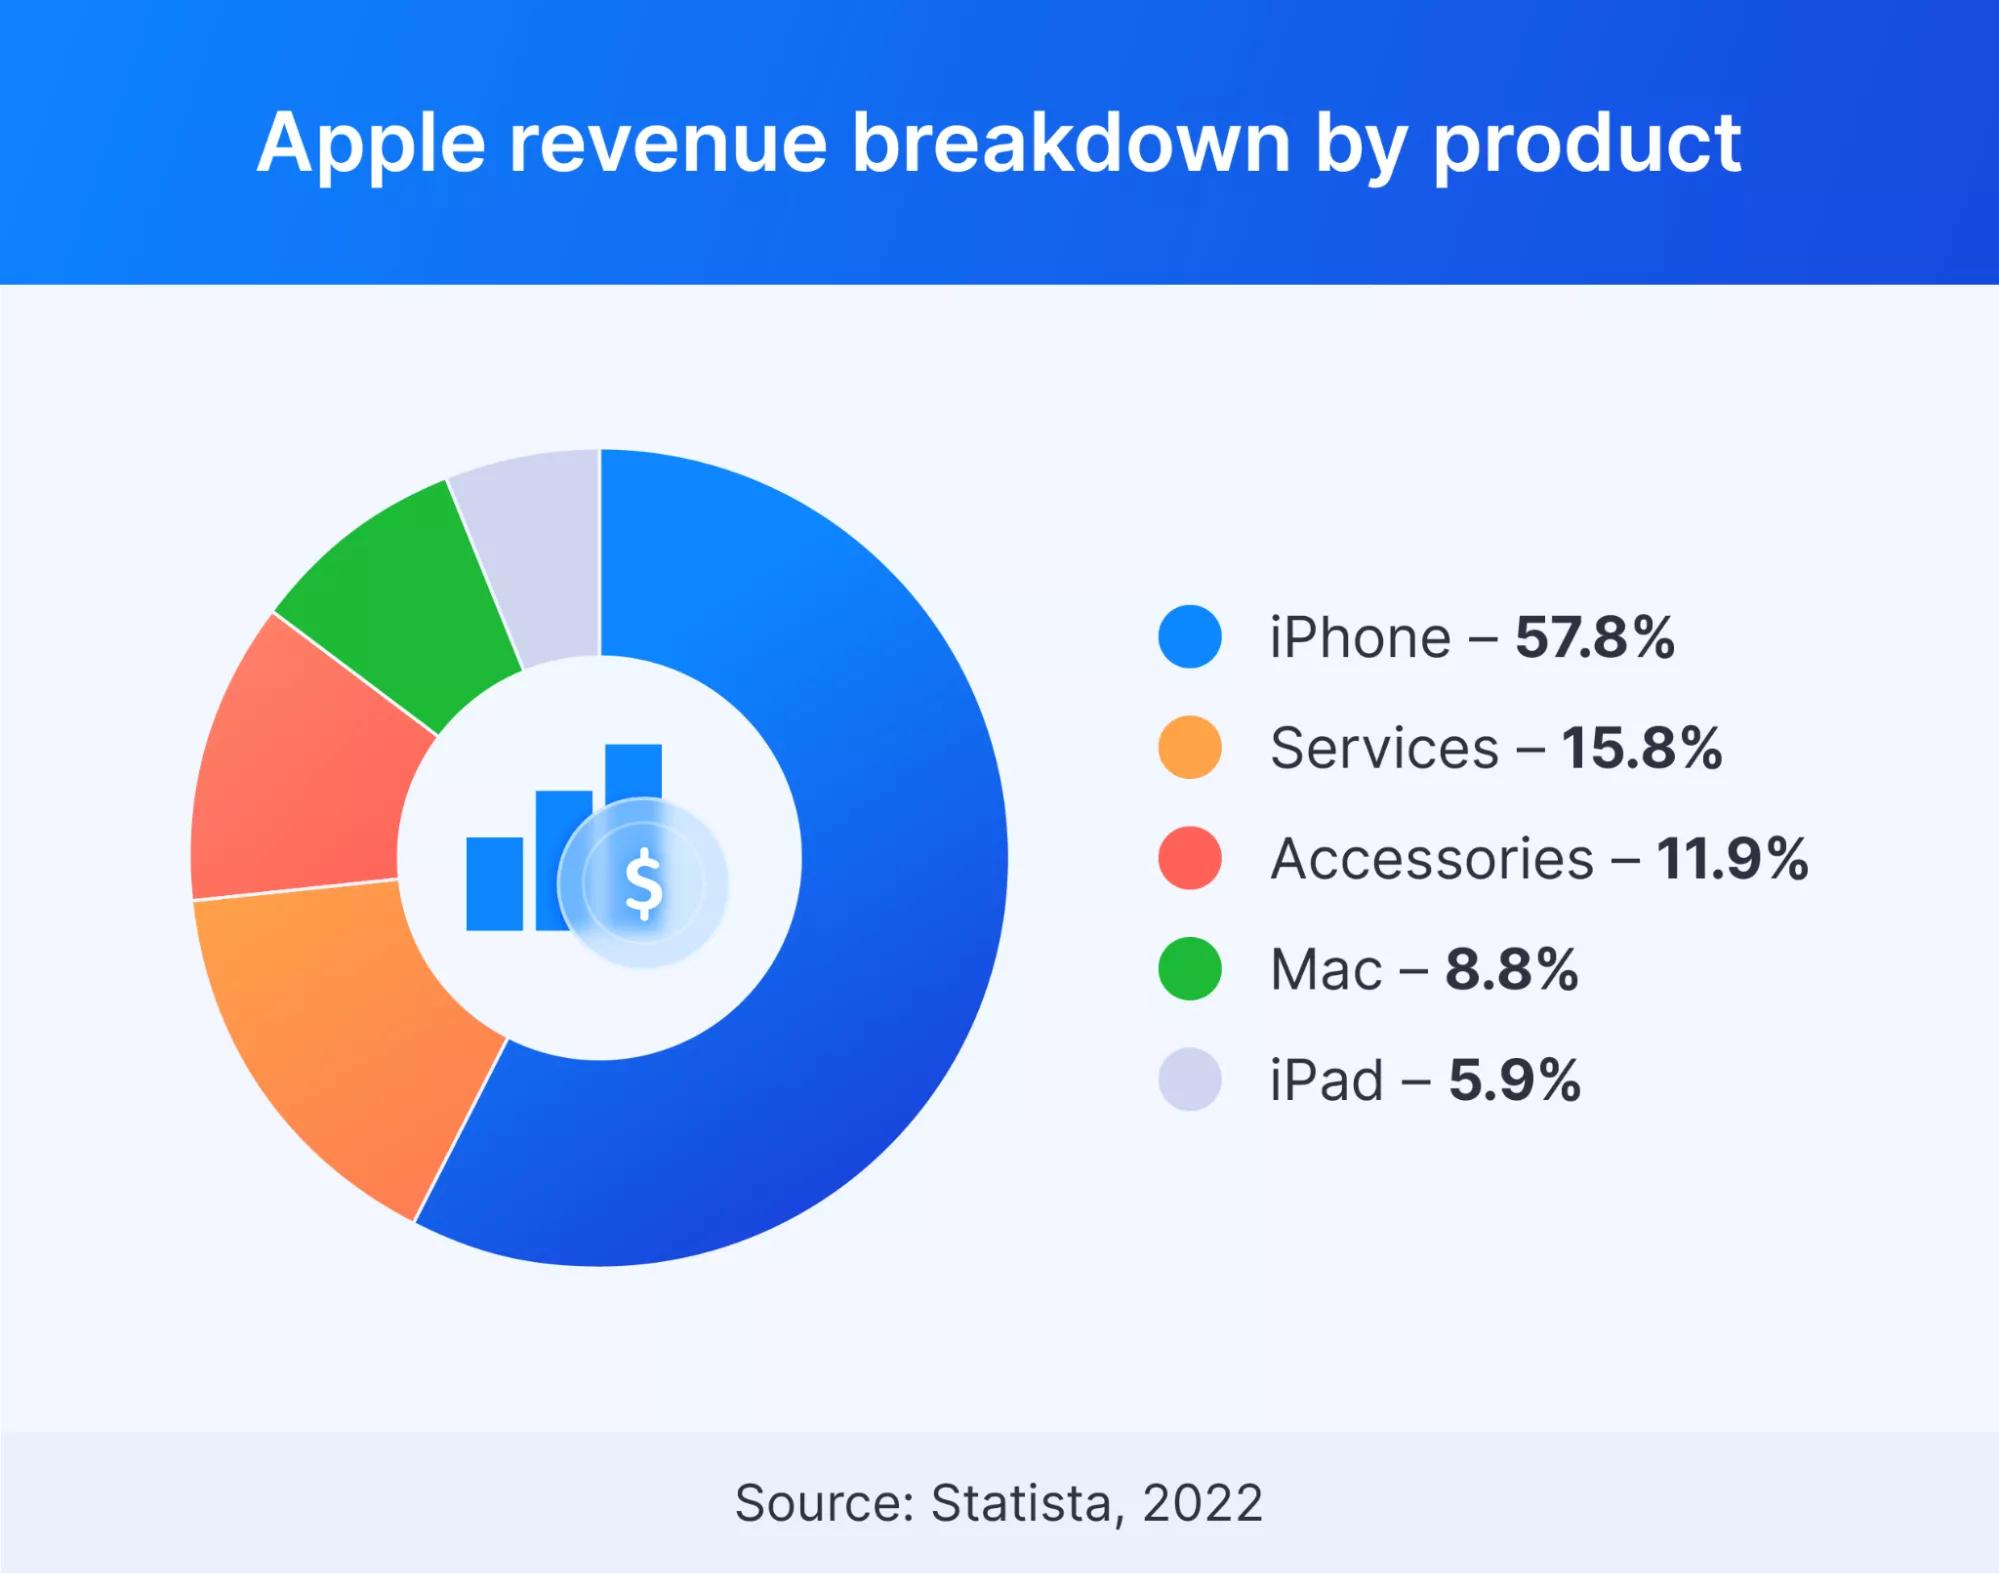
- Apple Statistics state that, the iPhone generates the highest percentage of total revenue compared to other Apple devices resulting in 57.8%.
- Furthermore, services offered by Apple, Inc create around 15.8% of revenue while 11.9% comes from accessories.
- Mac’s total revenue comes to around 8.8% while iPad generates around 5.9%.
By iPhone
- As of 2022, total sales of iPhone contributed around 50% of Apple’s revenue.
- 63% of the iPhones around the globe have the latest version of iOS installed.
- As of Q1 of 2023, iPhone’s total revenue became $65.8 billion.
- Similarly, the share of the total sales in Apple’s revenue in the iPhone category in Q1 of 2023 is 56%.
- Total iPhone shipments in Q2 of 2022 were 72.3 million globally.
- iPhone owners have at least one car at their home.
- 22% of iPhone users said they purchase Apple products because it has a variety of applications in the Store.
- $40 is the average of purchases made on apps and in-app purchases every year.
- Facebook stands most popular app for iPad and iPhone at all times.
- 74% of iPhone users are aged above 25 years and 66% of users are women.
- 46% of iPhone owners have at least one child.
- 78% of iPhone owners have an average income of $25,000 every year.
- Moreover, 54% of phone buyers said their last phone was iPhone.
- In the United States of America, Apple Statistics show that 3% of users use the iPhone 13, 10% of Americans use iPhone 14, and 12% of users own iPhone 14 Pro, whereas iPhone 14 Pro Max is owned by 23% of Americans.
- Moreover, In the United States of America, a total of 52% of iPhone owners own various series of iPhones.
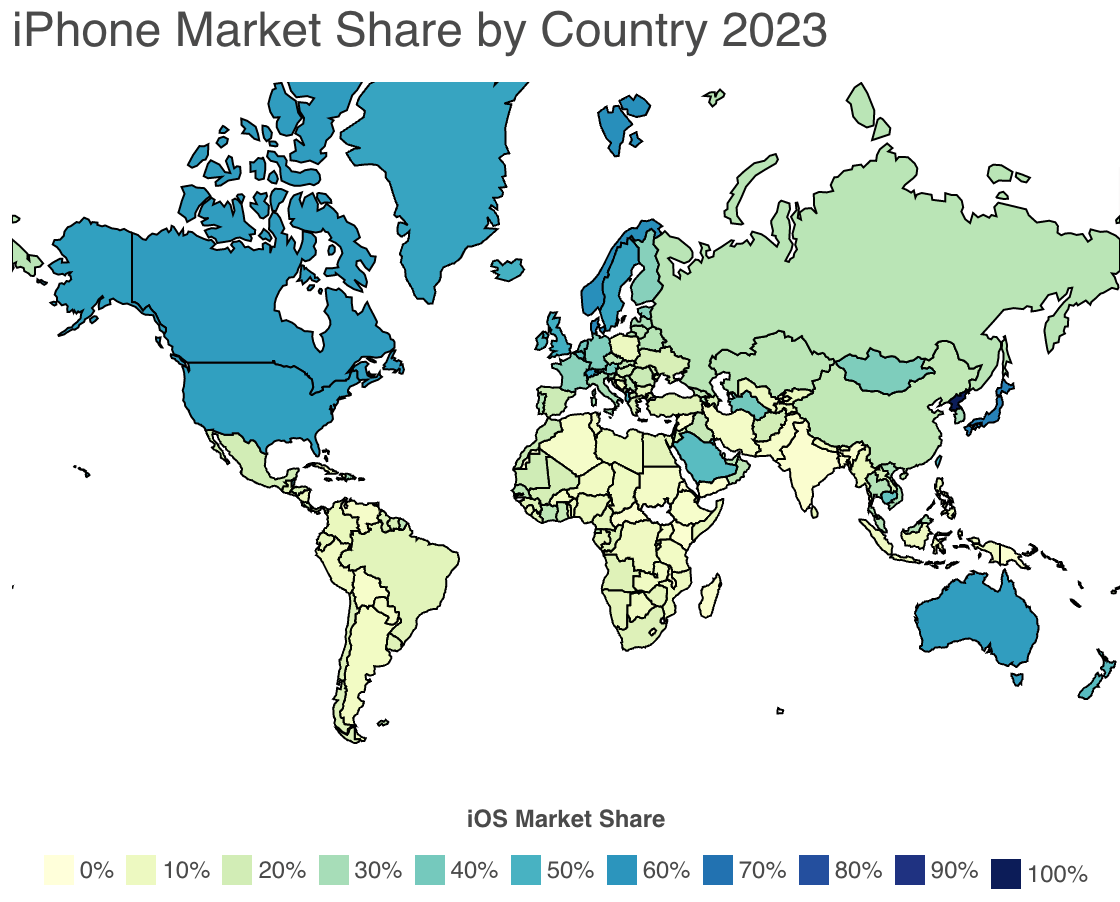
(Source: worldpopulationreview.com)
By Mac
- Apple Statistics further state that, Mac computers have generated around $7.7 billion of revenue in total sales.
- The most used macOS version in 2022 is MacOS Catalina.
- Moreover, as of Q4 2022 Apple shipped 7 million Mac units globally.
- 52% of Mac users live in a city.
- Moreover, 40% of Mac users are below the age of 34 years. Whereas 67% of users are female.
- Apple Statistics state that, 67% of users are more likely to back up their Macs continuously.
- If given a choice to choose the brand of motorcycle based on Mac users, 52% of them are more likely to go with Vespa.
- On average, Mac owners have an income of $98,500 in every household.
By Headphone
- Apple is the number 1 brand in the United States of America in the headphones category.
By Apple Watch
- In the United States of America, 35% of iPhone users own Apple Watch.
- 73% of Apple Watch users live in North America, whereas 86% of them are male users.
- Apple Watch owners typically earn $100,000 or more every year.
(Reference: headphonesaddict.com)
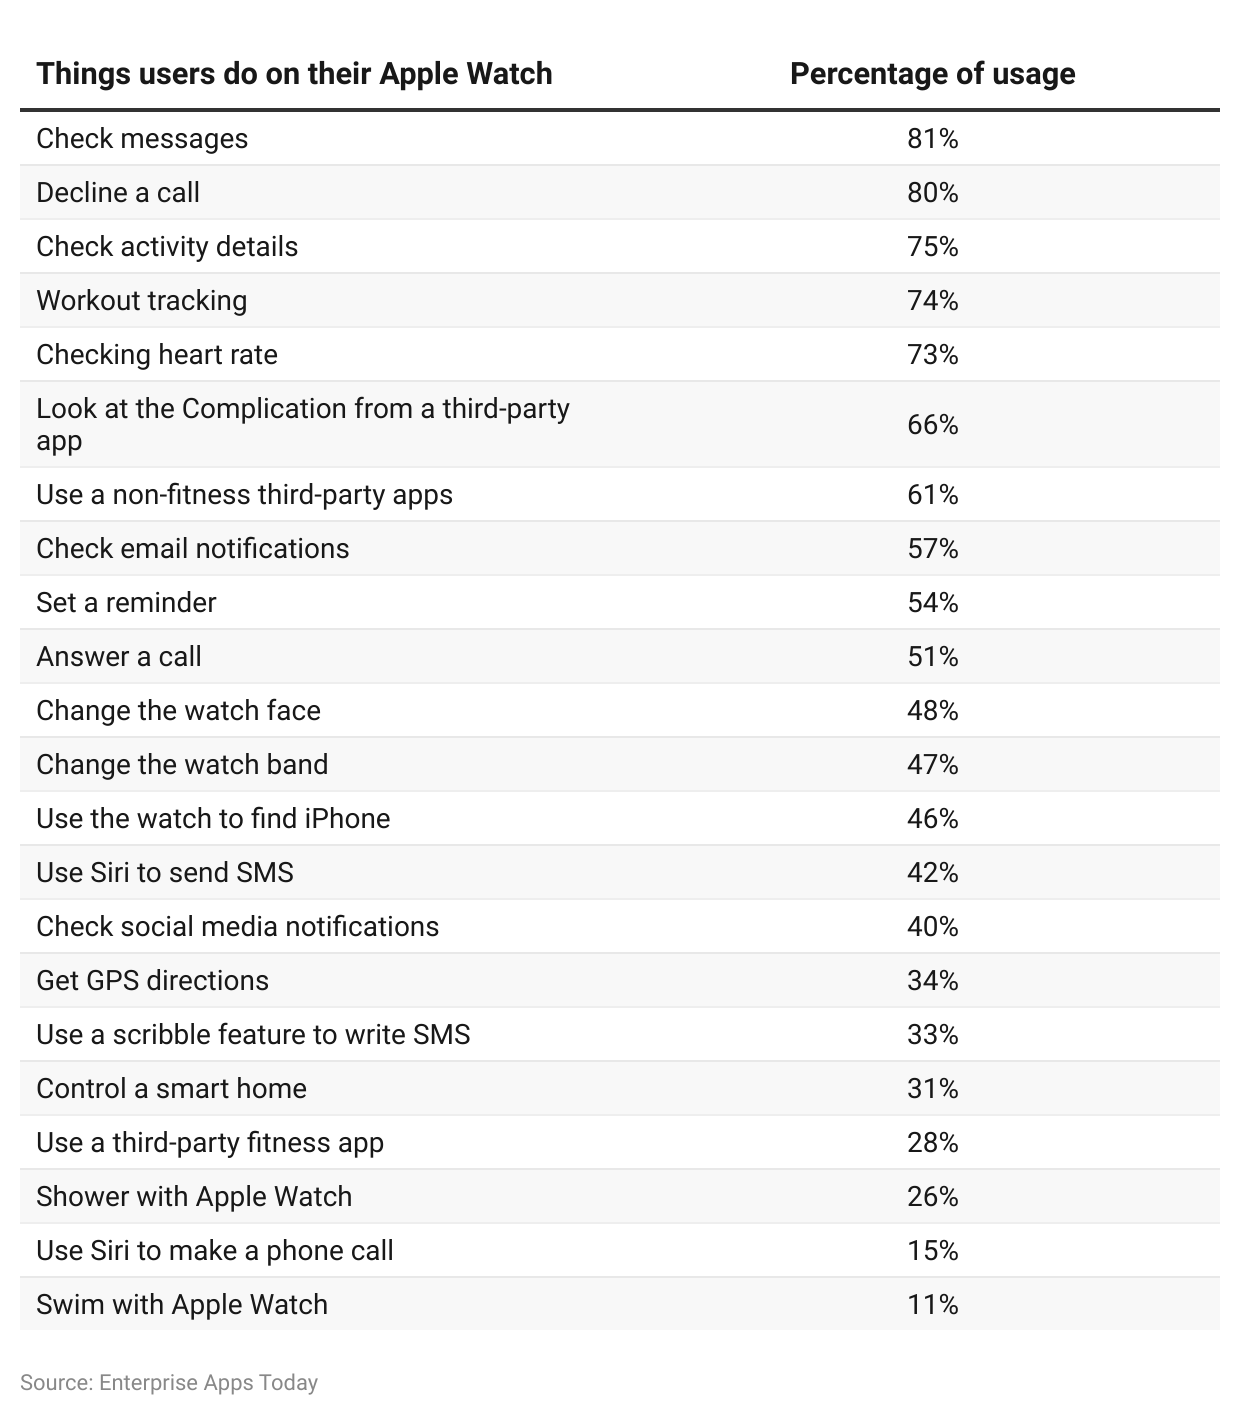
Most Apple Watch users prefer to check messages on Apple Watch resulting 81%. While others decline a call and check activity details resulting in 80% to 75% respectively. Only 15% and 11% of Apple Watch users ask Siri to make a phone call and swim with Apple Watch.
By Apple Pay
- In the United States of America, Apple Pay has 90% of the total share in the mobile wallet market.
By iPad
- As of 2023, Q1, iPad contributed 8% of Apple’s total revenue resulting in $9.4 billion.
- Moreover, in Q3 of 2022, iPad’s total global shipments contributed around 37.5% resulting in 14.5 million.
- Apple, Inc. generated 9.4 billion of total revenue from iPad sales in Q1 of 2023.
- Around 43% of Americans own iPad as of 2022.
- 44% of children have iPad on their Wishlist for holiday shopping.
- When shopping online, on average, iPad is ordered in bulk.
- Apple Statistics state that, 1.5 million iPads are utilized in classrooms.
By Siri
- Apple’s Siri has captured 36% of the share of the total voice assistant market globally.
- The most frequently asked question to Siri is what is 0 divided by 0.
By iPod
- Apple’s Wearables, Home, and accessories segment generated around 9.74% of revenue in Q3 of 2022.
- 50% of iPod, as well as iPad users, are aged below 5 years.
- 69% of iPod Touch users are aged between 13 to 24 years.
By Apple Arcade
- In the United States of America, 59% of the people have brand awareness about the Apple Arcade.
- Out of these 32% of users like the brand. On the other hand, 31% of users use Apple Arcade regularly.
- Whereas 72% of Americans are loyal to Apple Arcade.
By Apple TV+
- Similarly, Apple TV+ has 77% of brand awareness in the United States of America as of 2022.
- Out of this 77% of people, 26% of Americans like the brand.
- On the other hand, 23% of Americans use this brand regularly, while it has 72% of loyal customers.
(Reference: oberlo.com)
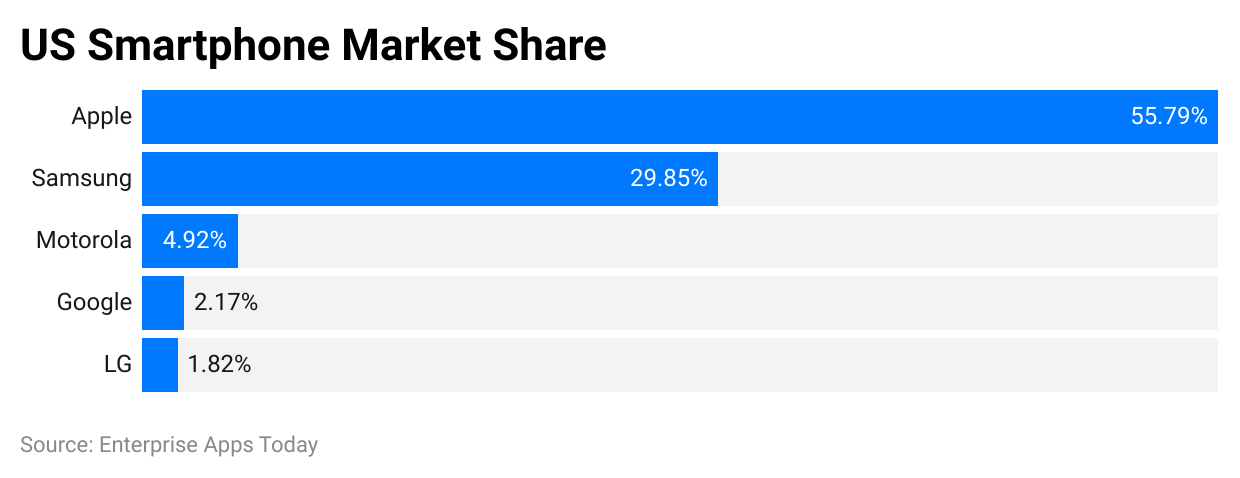
- As of 2022, Apple captured 55.79% of the share in the smartphone market of the United States of America.
- Samsung and Motorola have respective market shares at 29.85% and 4.92%.
- On the other hand, Google and LG have the lowest captured market share in the US at 2.17% and 1.82% respectively.
Apple Statistics by Demographics
- 51% of iPhone users are females.
- Considering other types of devices, 34% of the devices are owned by males while 66% of the devices are owned by females.
- As of 2022,60% of the users aged between 18 to 29 years have iOS-based mobile devices in the United States of America.
(Reference: similarweb.com)
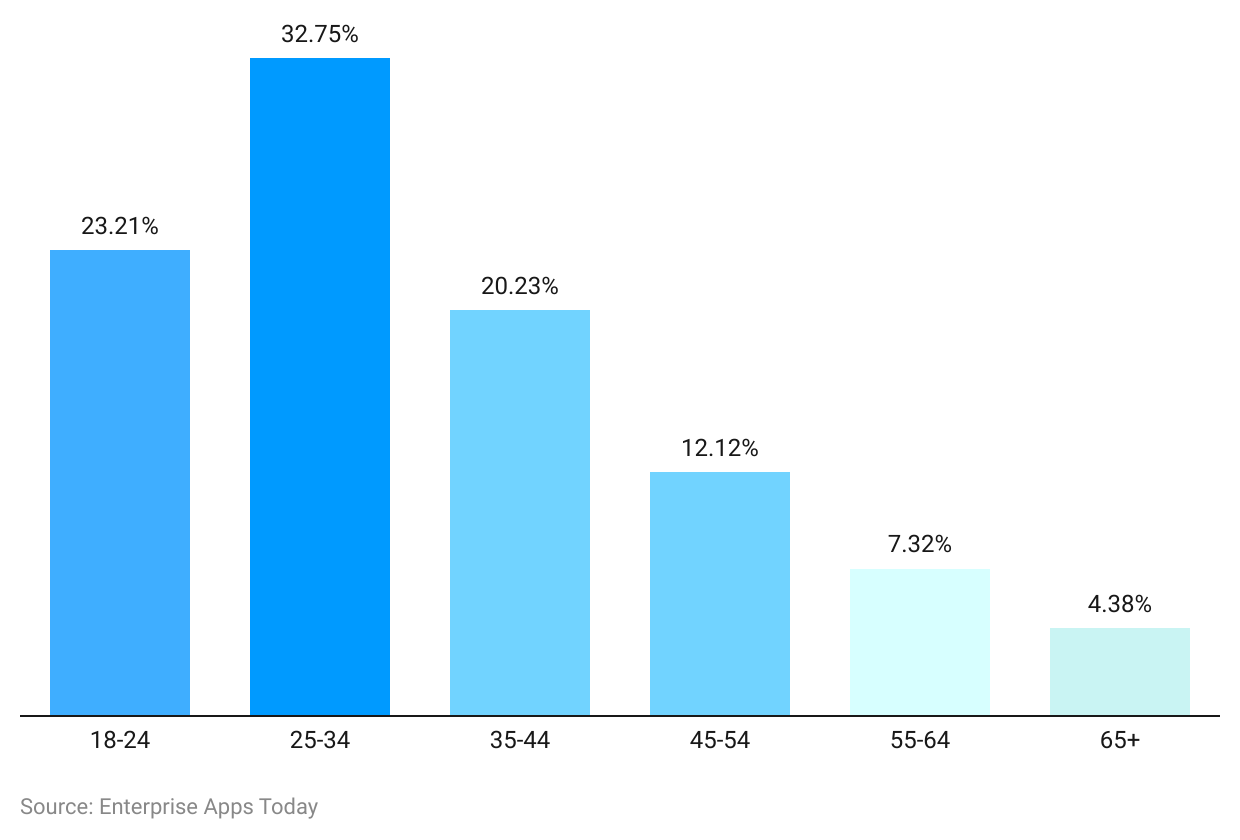
- The highest number of website visitors on apple.com are aged between 25 to 34 years, resulting in 32.75%.
- Moreover, there are 23.21% of users aged 18 to 24 years.
- 23% and 12.12% of website traffic are contributed by people aged 35 to 44 years and 45 to 54 years respectively.
- And there are 7.32% of people from the age group of 55 to 64 years and 4.38% of website visitors aged 65 years and above.
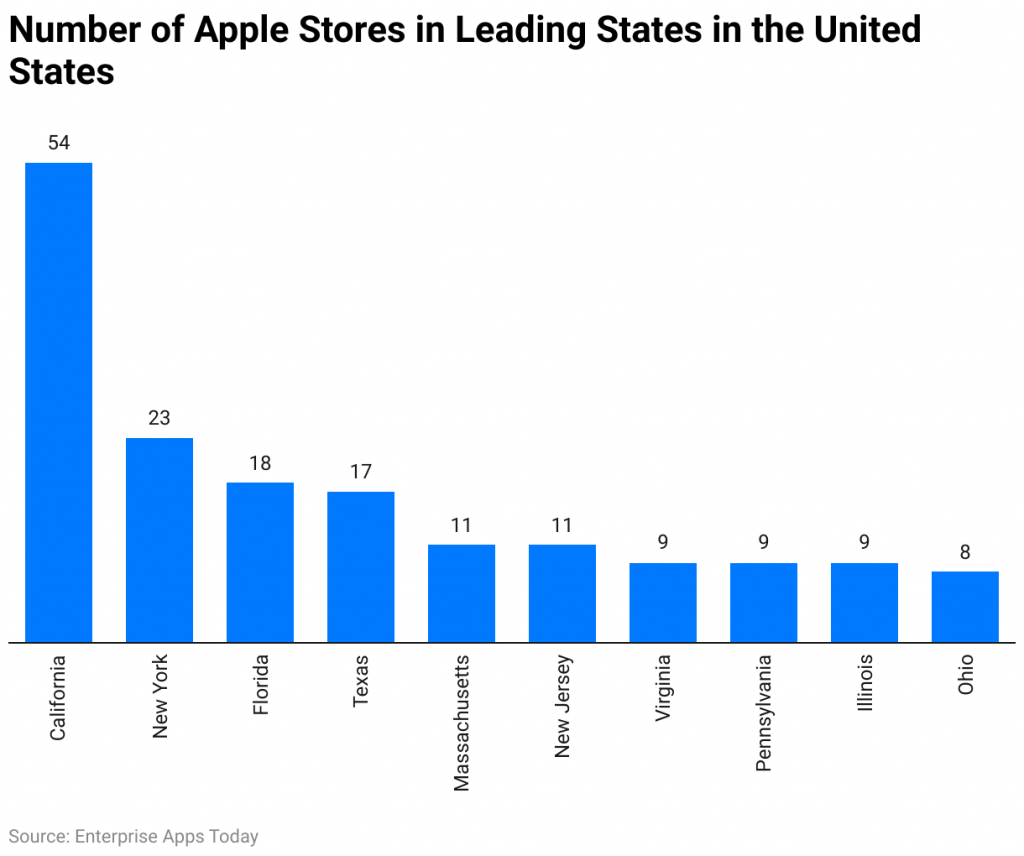
Apple Statistics by The Total Number of Stores
(Reference: Statista.com)
- In the United States of America as of November 2022, the highest number of Apple Stores were found in California (54), New York (23), and Florida (18).
- Whereas other states in the USA have the following number of Apple Stores – Texas (17), Massachusetts (11), New Jersey (11), Virginia, Pennsylvania, Illinois (9), and Ohio (8).
Apple Statistics by Brand Value
(Reference: Statista.com)
Apple Statistics by Traffic Sources
- The majority of traffic on apple.com has been observed as Organic search traffic resulting in 46.40%.
- Whereas 33.90% and 11.63% of traffic are respectively direct and referral.
- Furthermore, Apple’s Statistics of website traffic sources state that it has only 2.77% of paid traffic, while 3.27% of traffic is sent by social media networks.
- Mail traffic and Display traffic contribute by 1.29% and 0.74% respectively.
Apple Statistics by Social Media Network Traffic
- YouTube and Twitter have almost similar referral traffic rates resulting in 27.82% and 22.76% respectively.
- 01% of website traffic is sent by Reddit while LinkedIn contributes around 10.50%.
- Whereas, Facebook has a 9.63% of referral rate, and other social media networks collectively make 18.29% of referral traffic.
Apple Statistics by Device Traffic
- Over the past 6 months, there was 59.7% of mobile traffic while 40.3% of traffic was recorded from desktops resulting in 400 million and 226 million respectively.
(Reference: semrush.com)
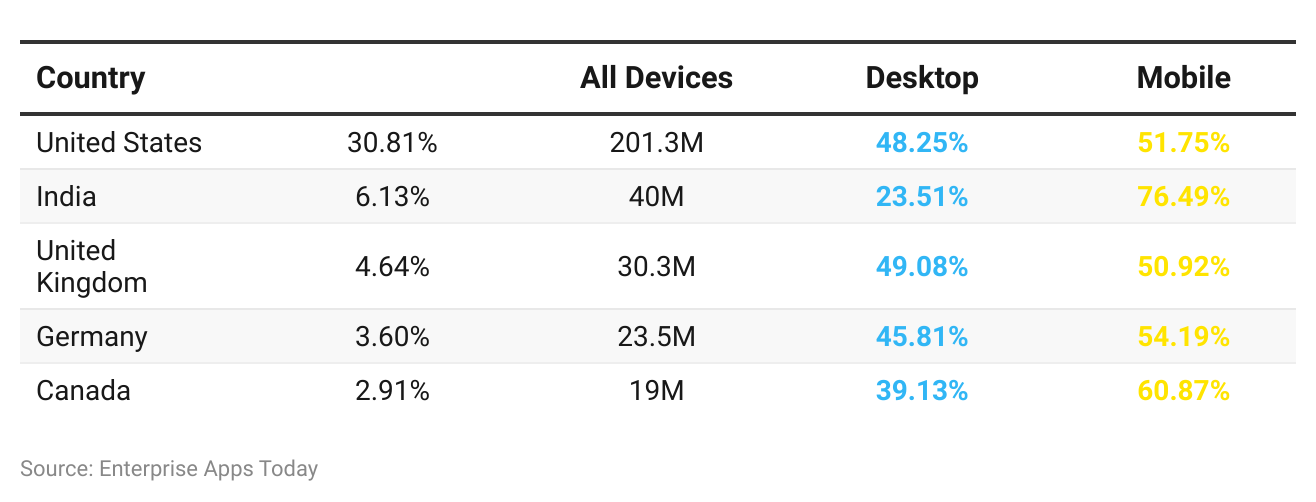
- com has the highest number of traffic from the United States of America resulting in an overall 30.81% of total traffic. It has around 201.3 million visitors out of which 48.25% are desktop and 51.75% are mobile visitors.
- India and the United Kingdom contribute around 6.13% and 4.64% respectively with a total of 40 million and 30.3 million devices.
- India has 23.51% desktop and 76.49% mobile visitors while the United Kingdom has 49.08% and 50.92% of desktop and mobile visitors.
- Germany and Canada generate 3.6% and 2.91% of traffic, resulting in 23.5 million and 19 million total devices.
- Whereas Germany contributes 45.81% (desktop) and mobile (54.19%) and Canada has 39.13% (desktop) and 60.87% (mobile) visitors.
Apple Statistics by Region
By Net Sales
(Reference: s2.q4cdn.com)
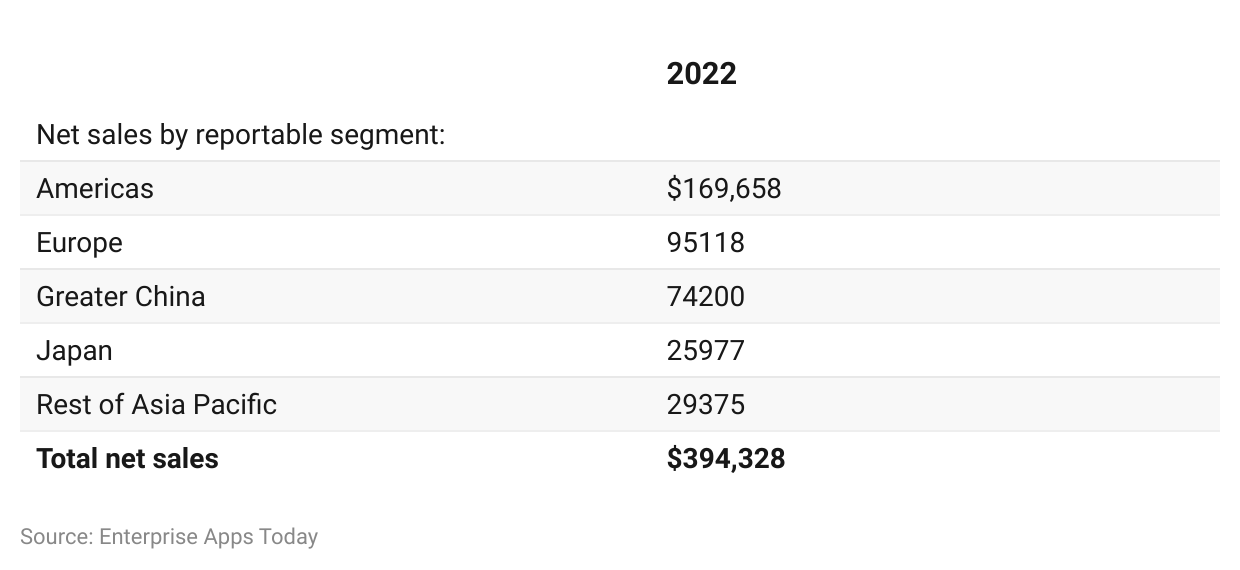
- The regional disaggregation of net sales state that, the American region generated the highest number of sales in 2022 resulting in $169,658 million.
- Followed by Europe and Greater China with $95,118 and $74,200 of net sales respectively.
- Japan and the Rest of Asia Pacific contributed around $25,977 and $29,375 of total sales in 2022.
- Apple Statistics show that total net sales including all regions collected around $394,328 of revenue.
By Product Sales
(Reference: s2.q4cdn.com)
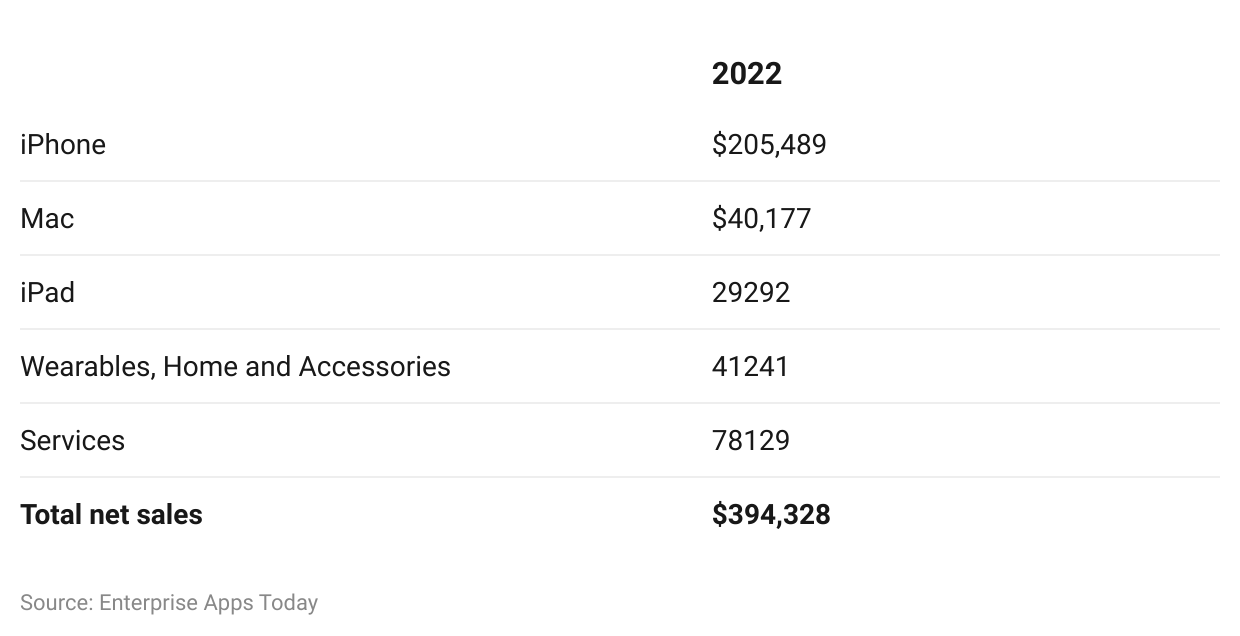
- As of 2022, the highest number of sales were recorded by iPhone resulting in $205,489 million globally.
- The total sales of Mac and iPad products contributed by $40,177 million and $29,292 million respectively.
- Furthermore, total sales in the categories of wearables, home, and accessories generated around $41,241 million.
- Whereas other services. Offered by Apple, Inc captured $78,129 million in total sales.
- Further Apple Statistics for 2022 state the total net sales generated by the sale of products and services collectively made $94,328.
Apple Statistics by Leading OTT Platform in the US
(Reference: Statista.com)
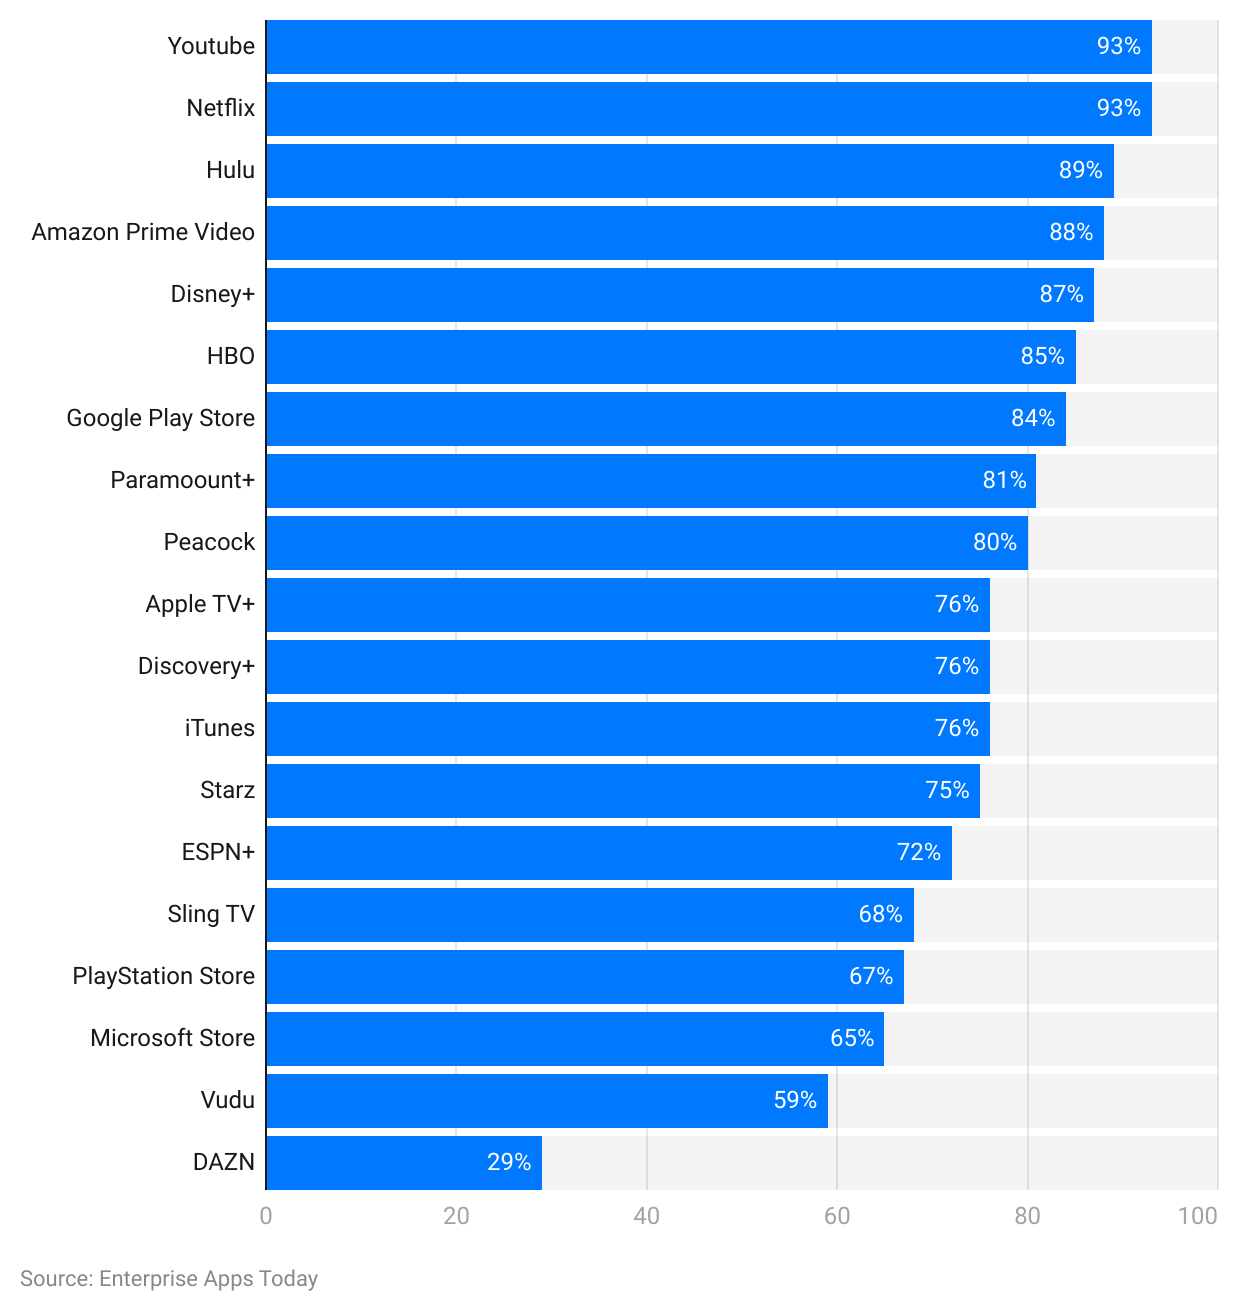
- Apple Statistics of 2022 state, Apple TV+ ranked among the top 10 leading video-on-demand brands in the United States of America by having total users of (76%).
- Other leading video-on-demand brands include YouTube and Netflix (93%), Hulu (89%), Amazon Prime Video (88%), Disney+ (87%), HBO (85%), Google Play store (84%), Paramount+ (81%), Peacock (80%), Discovery+ (76%), iTunes (76%), Starz (75%), ESPN+ (72%), Sling TV (68%), PlayStation Store (67%), Microsoft Store (65%), Vudu (59%), and DAZN (29%).
Apple Statistics by Popular App Store Categories
(Source: Statista.com)
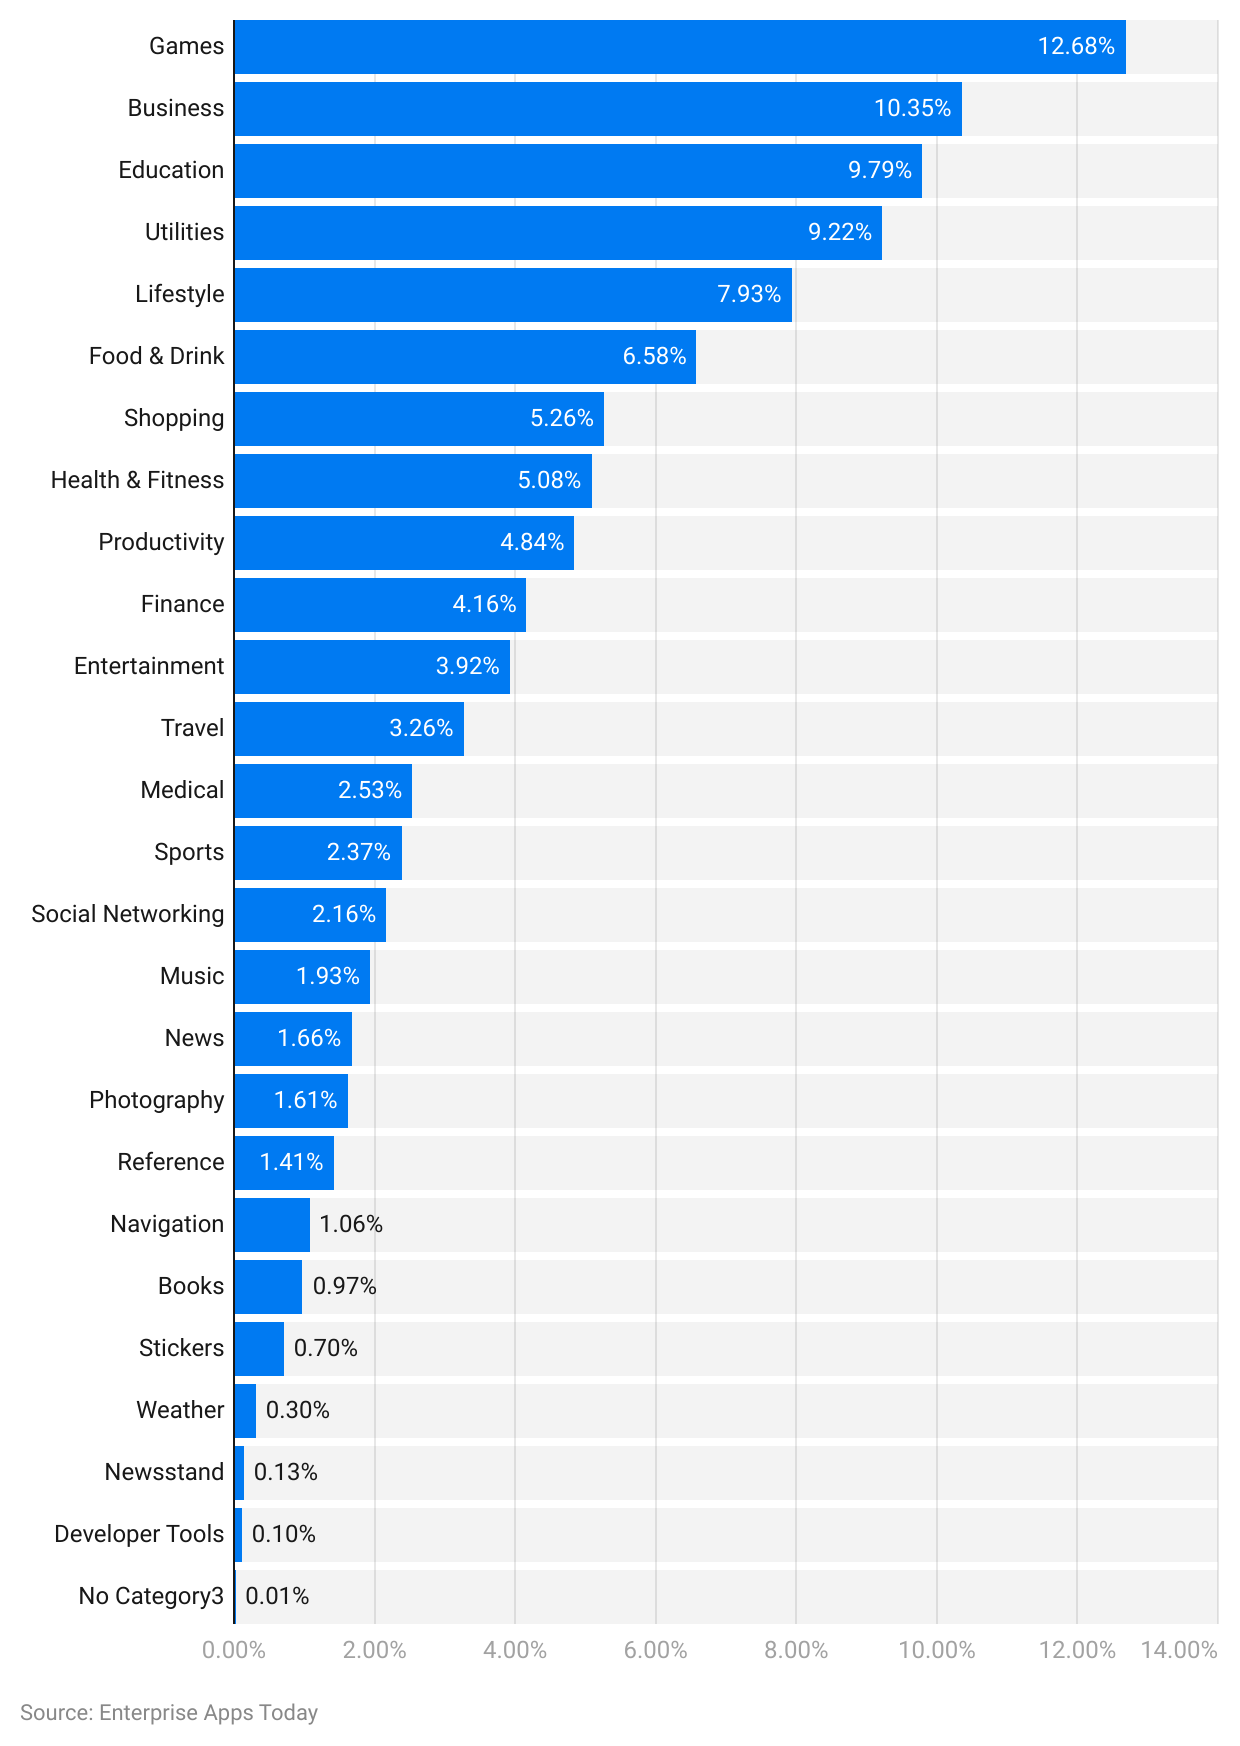
Apple Statistics by top app store categories of 2022 in Q3 in the United States of America are Games (12.68%), Business (10.35%), and Education (9.79%). On the other hand, the least preferred iOS apps in App Store are Weather (0.3%), Newsstand (0.13%), Developer Tools (0.1%), and No Category Apps3 (0.01%).
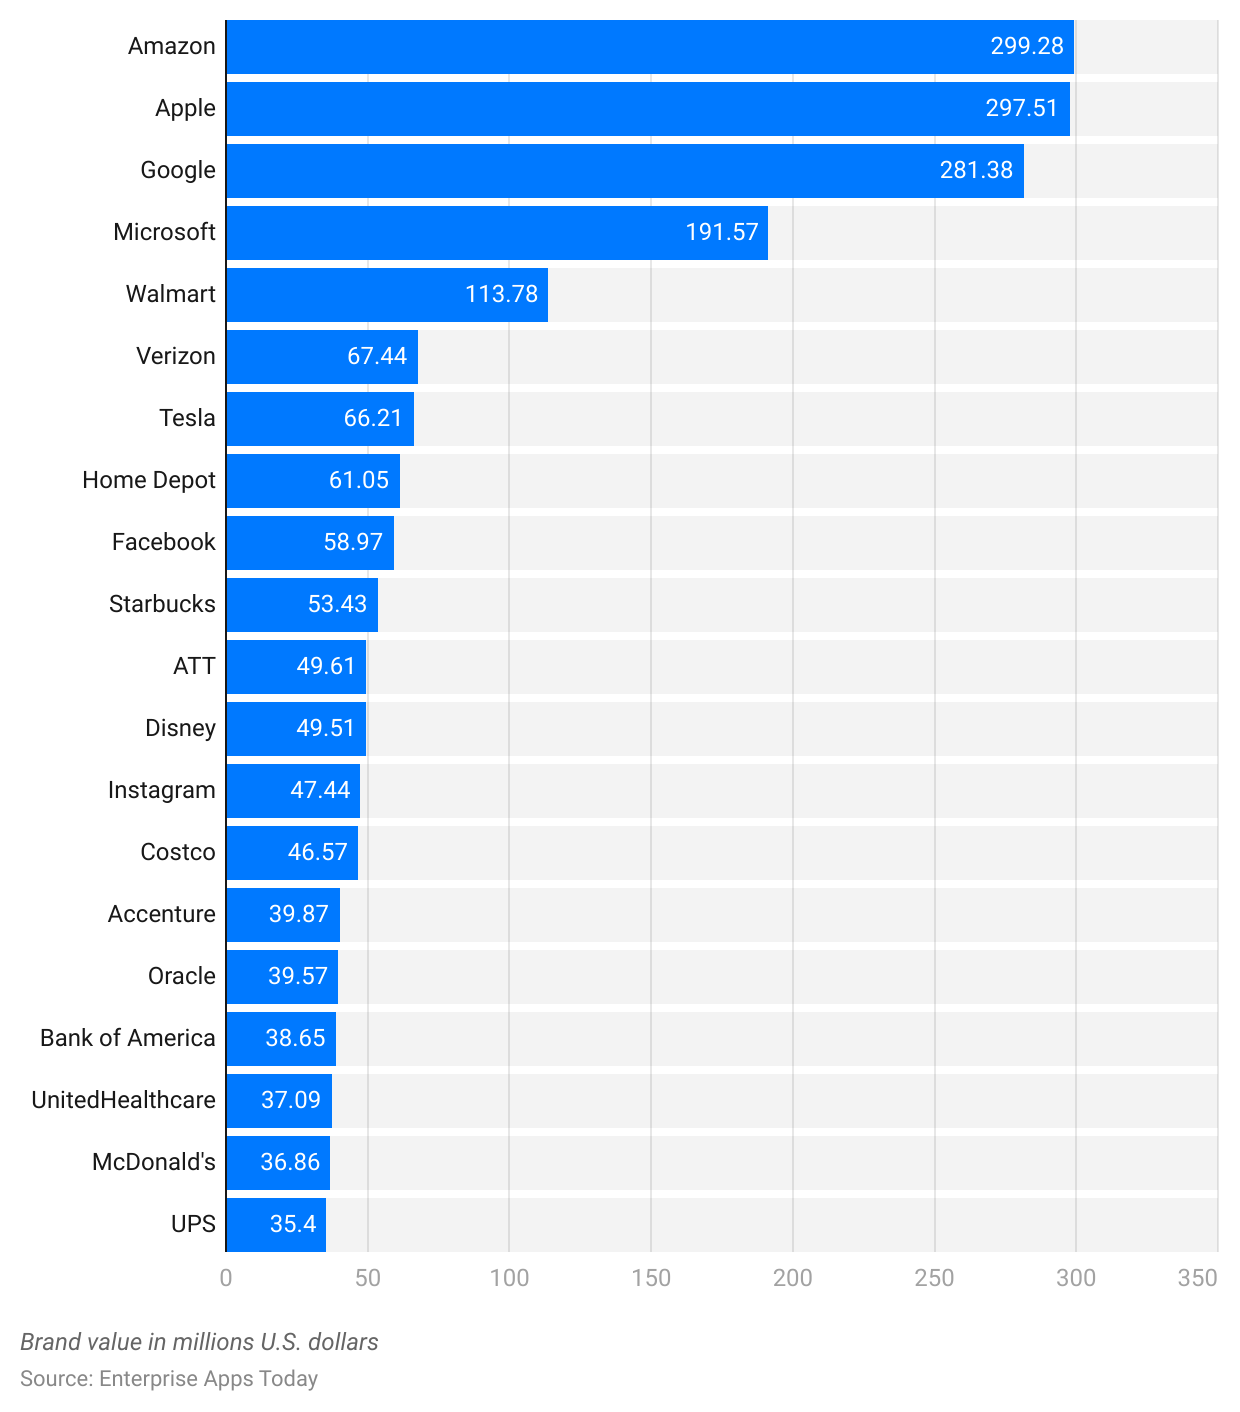
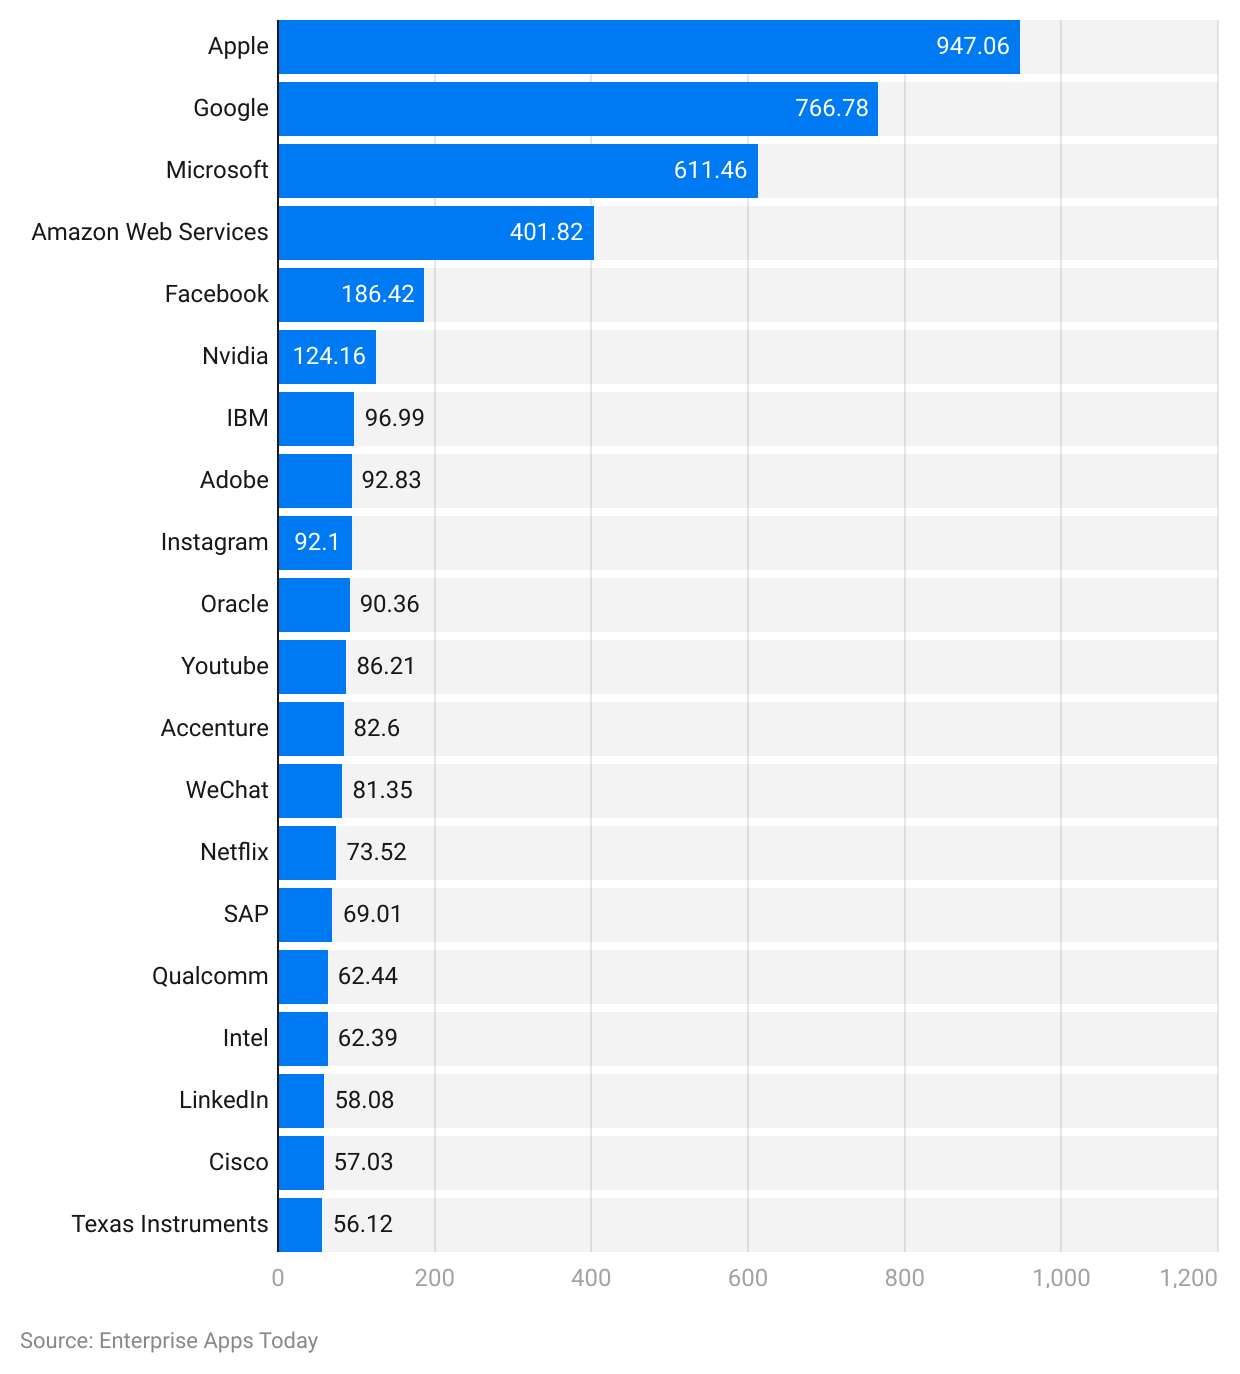
Top 20 Valuable Technology Brands
(Source: Statista.com)
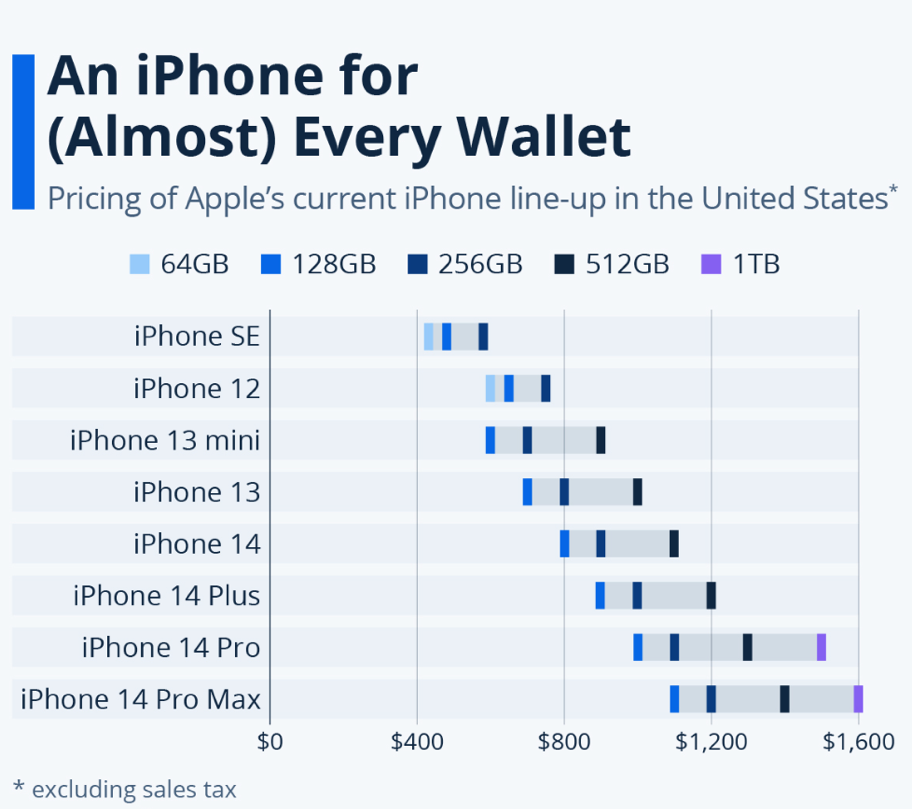
Prices of iPhones for Every Household
(Source: Statista.com)
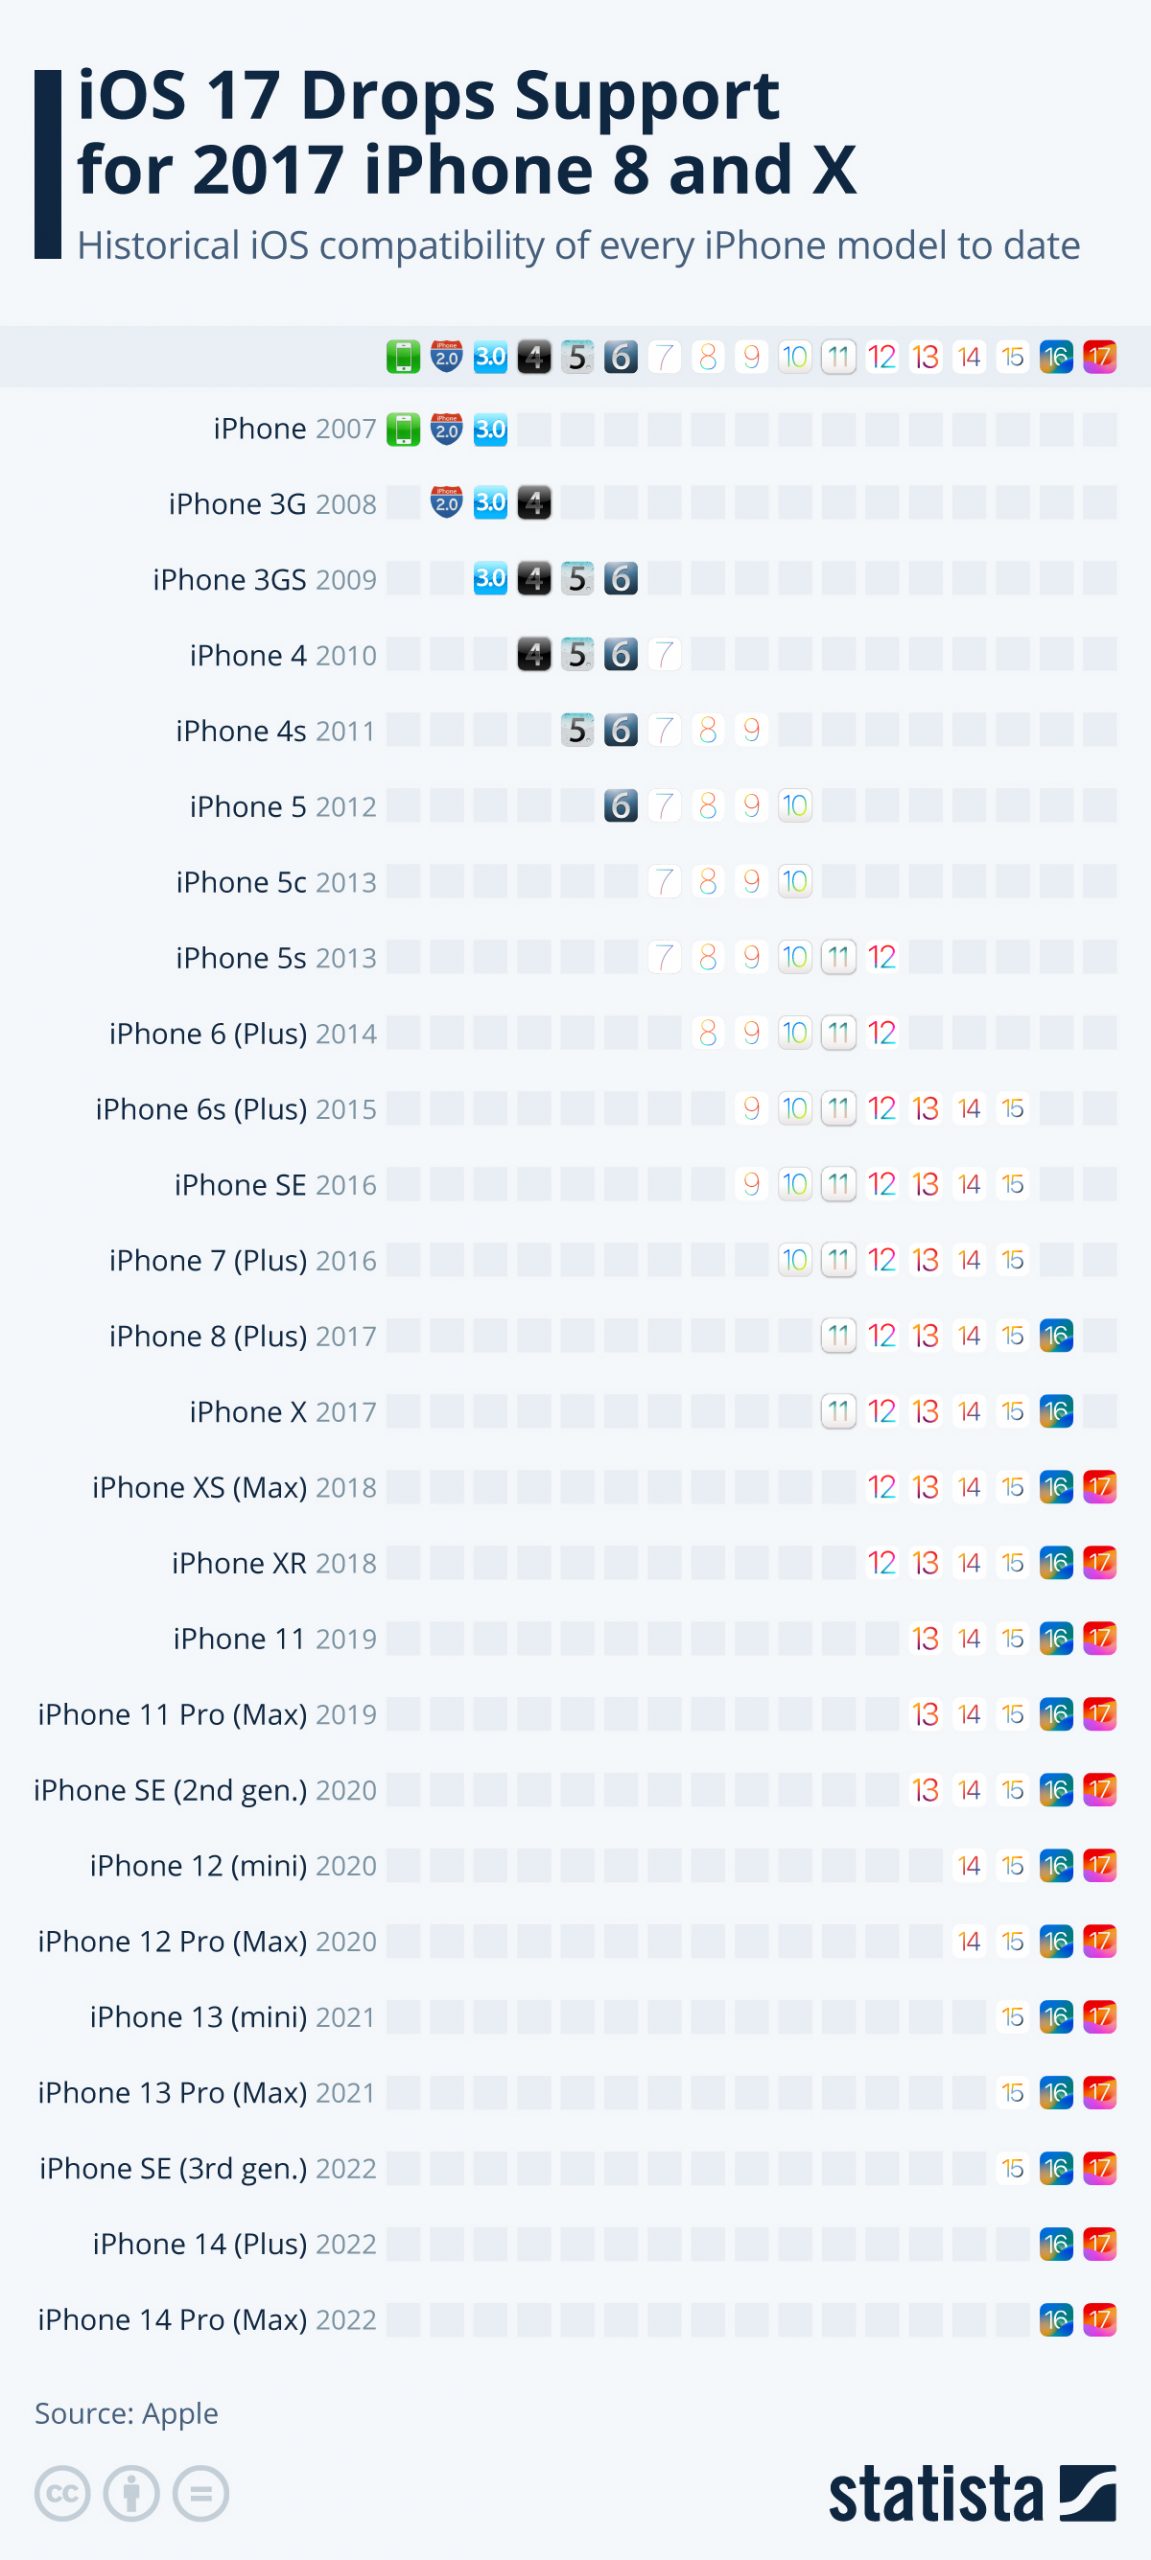
Apple Statistics by the Duration of iOS Compatibility for Every iPhone Model
(Source: Statista.com)
Conclusion
Globally, Apple Statistics prove that the company has already captured more than 50% of the market. Irrespective of the performance during the lockdown, when the company had to shut down some of its stores, it achieved a great level of revenue just in 2 years of business after COVID-19. Apple always focuses on the security and uniqueness of its products. Today, in the world of technology, you can live in a hands-free home, where all Apple devices are connected and run on voice commands. Therefore, in 2023, it is still worth buying Apple Products!
Sources
FAQ.
You can purchase authentic Apple products either in authorized Apple Stores or on their official website at www.apple.com.
To be honest, you should not waste liquid money on the phone unless you want to go with the trend. You can always buy the lower versions of the iPhone at lower prices.
Go to icloud.com and log in with the credentials of the lost Apple product. Then go to the ‘Find My’ app – Select the device you want to search, once you select it, it will give you a live location of the product. You can also find your friends or family missing iPhones using your own iPhone by following the above steps. Initially, you are required to have a location to find the device.
You can log in to their Official website and go to Support. Fill up the form, and select the method of communication by email, chat, or phone.

Barry is a lover of everything technology. Figuring out how the software works and creating content to shed more light on the value it offers users is his favorite pastime. When not evaluating apps or programs, he's busy trying out new healthy recipes, doing yoga, meditating, or taking nature walks with his little one.