
Inflation Statistics and Facts
Page Contents
- Introduction
- Editor’s Choice
- Impacts of Inflation on U.S. Industries
- Important Facts About the Inflation Rate
- General Inflation Statistics
- The Car Inflation Rate in the U.S.
- The Change in the Inflation Rate of the United States Housing
- Restaurants and Hotel Statistics
- Inflation Momentum Change in the United States
- Conclusion
Introduction
Inflation Statistics: The inflation rate is a metric used in economics to determine how much a particular set of commodity prices have changed. It shows the amount of decrease in the purchasing power of the currency as well as the percentage rate of change in the level of prices over time. In the United States, the annual rate of inflation for 2022 was around 8% higher than the rate for the year before. The main causes of the high rise in the inflation rate in the U.S. were the COVID-19 pandemic and the Russia-Ukraine war in February 2022, which have enhanced higher food and energy costs. This article includes many informative statistics from different aspects that will help in a better understanding of inflation rates.
Editor’s Choice
- The statistics are published by the Department of Labor’s Bureau of labor statistics, U.S.
- The main cause of the higher inflation rate was Russia's invasion of Ukraine.
- In 2022, the United States' inflation rate rose to 9.1%.
- On 30th June 2022, the inflation rate remained highest ever at 9.06%.
- On 31st December 2022, the valuation was 6.45%.
- As of 30th April 2023, the valuation decreased and turned to 4.93%.
- Venezuela in 2022, had the highest inflation with 200.91% and in 2023 is estimated to be 399.98%
- Bolivia was having the lowest inflation rate in 2022 with only 1.75%.
- In 2022, consumer prices in the United States are expected to have grown by nearly 7%, the greatest increase in forty years.
Impacts of Inflation on U.S. Industries
- In 2022, the average retail price of regular gasoline was $ 4.11 / gallon which has increased by $ 1.33 since last year, and in 2023 it was $ 3.57 / gallon.
- The average diesel price remained at $ 4.91 / gallon in the 1st quarter of 2022 and $ 4.07 in 2023.
- More than 66% of restaurants have seen a reduction in business due to inflation in 2022.
- In August 2022, retail food inflation was estimated to be 15.5%.
- Loss of productivity turned out to be 54% in August 2022.
- Inflation causes a high rate of interest.
- It also causes lower Debt service costs.
- The CPI evaluation dropped to 6.5% by the end of 2022 and expect to have some positive conditions in 2023.
- The CPI dropped to 4.9% in April 2023 it is termed as the lowest-ever rate of inflation.
Important Facts About the Inflation Rate
- In April 2023, the US annual inflation rate surprisingly dropped to 4.9%.
- In 2022, the fuel oil rate increased by 41.5%.
- Airfare rate by 28.5%.
- Public transportation by 18.2%.
- Dairy products by 15.3%.
- Electricity by 14.3%.
- Tools and hardware by 13.8%.
- Food by 10.4%.
- Rent of residences by 8.3%.
- Energy by 7.3%.
- New vehicles by 5.9%.
- Major appliances decreased by 0.6%.
- Gasoline by -2%.
- Computers and home appliances by -5.8%.
- Used cars and trucks by -8.8%.
- Television by -14.4%.
- In 2022, the GDP increased by 2% which was $25.5 trillion.
- The GDP decreased in the first half of 2022 but increased in the second.
- To combat inflation, the Federal Reserve raised interest rates seven times in 2022.
- As of 1st February, bringing the target rate up from almost nothing to 4.5% towards 4.75%.
General Inflation Statistics
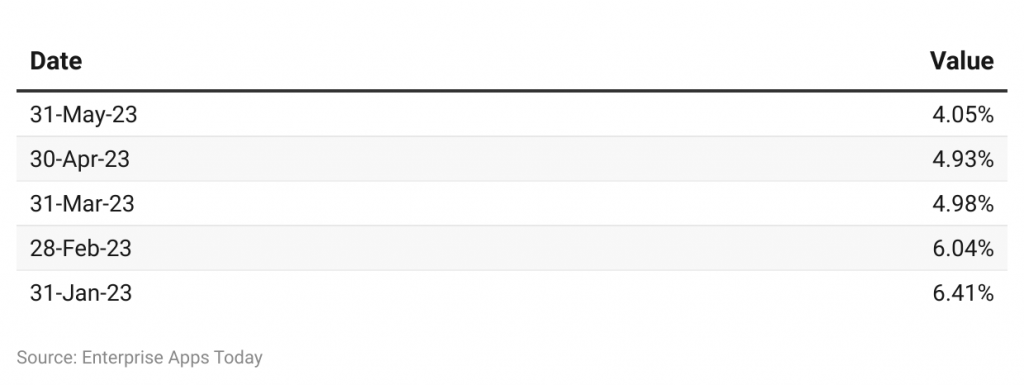
- The above figure and graph describe the U.S. inflation rate for 2023.
- From 2023, the inflation rate has started to decrease from last year.
- On 31st January it was 6.41%, on 28th February it reduced to 6.04%, on 31st March it become 4.98%, and on the recent 30th April it become 4.93%.
The change in the unemployment rate of the United States because of a high rise in the inflation rate in 2022:
- The overall unemployment rate in January 2023 is 4%.
- February = 3.8%
- March = 3.6%
- April = 3.6%
- May = 3.6%
- June = 3.6%
- July = 3.5%
- August = 3.7%
- September = 3.5%
- October = 3.7%
- November = 3.6%
- December = 3.5%
(Source: oversight.house.gov)
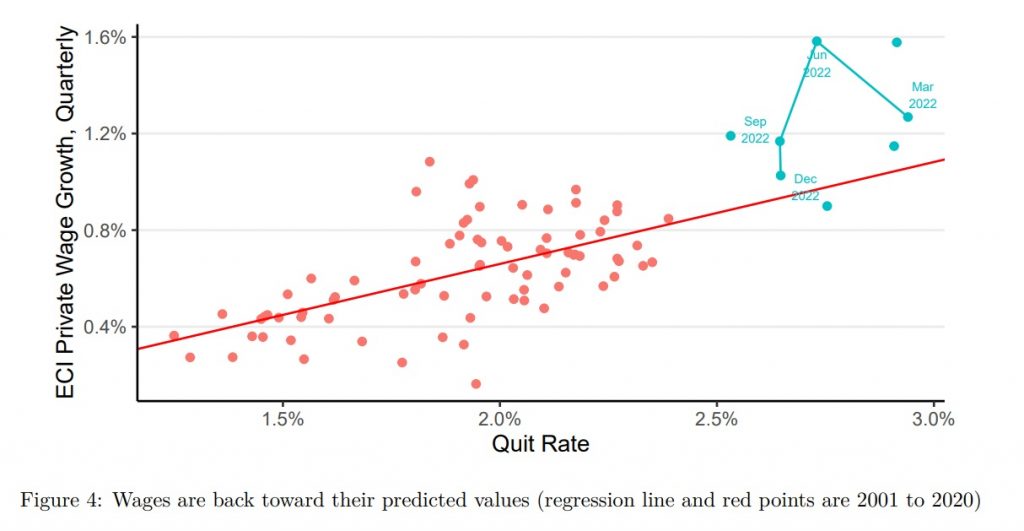
- In the first half of 2022, the Employment Cost Index's private wage growth rate ranged from 5 to 6% annually.
- In the final quarter of 2022, it had a 4% growth rate annually.
- Values were significantly higher than what had been expected for the entire year 2022.
- In March 2022 = 1.3%
- In June 2022 = 1.6%
- In September 2022 = 1.2%
- In December = 0.9%
The annual % change in GDP due to the rise in the U.S. inflation rate in 2022:
- The GDP has decreased by 3.8% than the previous year.
- The GDP growth rate of 2022 was only 2.1%.
(Source: morningstar.com)
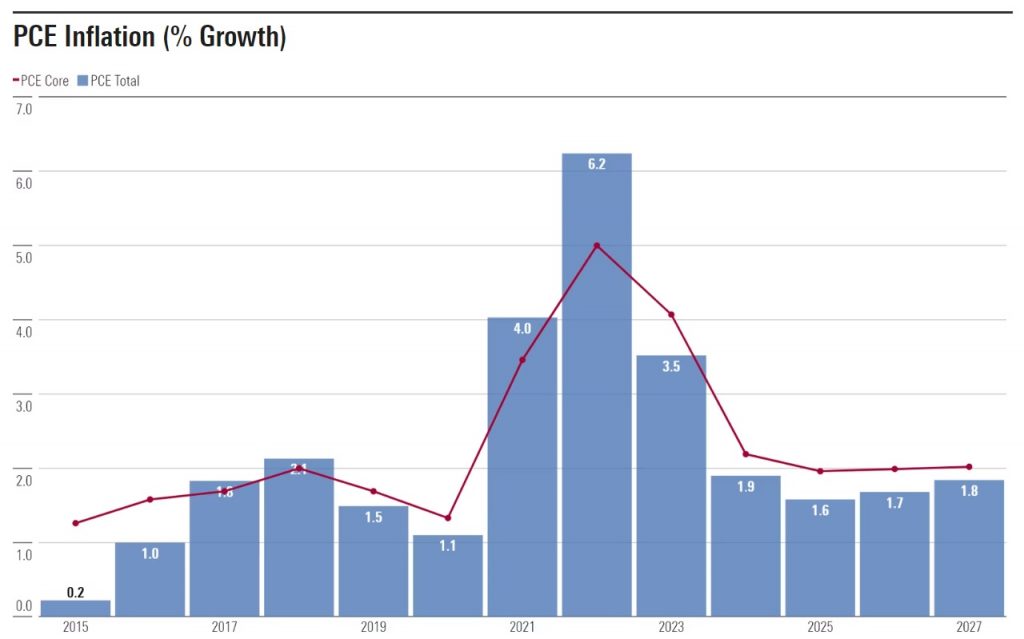
- The inflation rate was expected to be 3.5 % in 2023 after the high rise of 6.2% in 2022.
- The average inflation from 2024-2027 is expected to be 1.8%.
- In 2022, the United States' inflation rate rose to 9.1%.
- In 2023 the valuation decreased and turned to 4.93%.
Change in the United States customer price index of 2022:
- On 31ST January 2022, the CPI was 7.8%.
- In 28th February = 7.87%
- In 31st March = 8.54%
- In 30th April = 8.26%
- In 31st May = 8.58%
- In 30th June = 8.52%
- In 31st July = 8.52%
- In 31st August = 8.26%
- In 30th September = 8.20%
- In 31st October = 7.75%
- In 30th November = 7.11%
- In 31st December = 6.45%
(Source: morningstar.com)
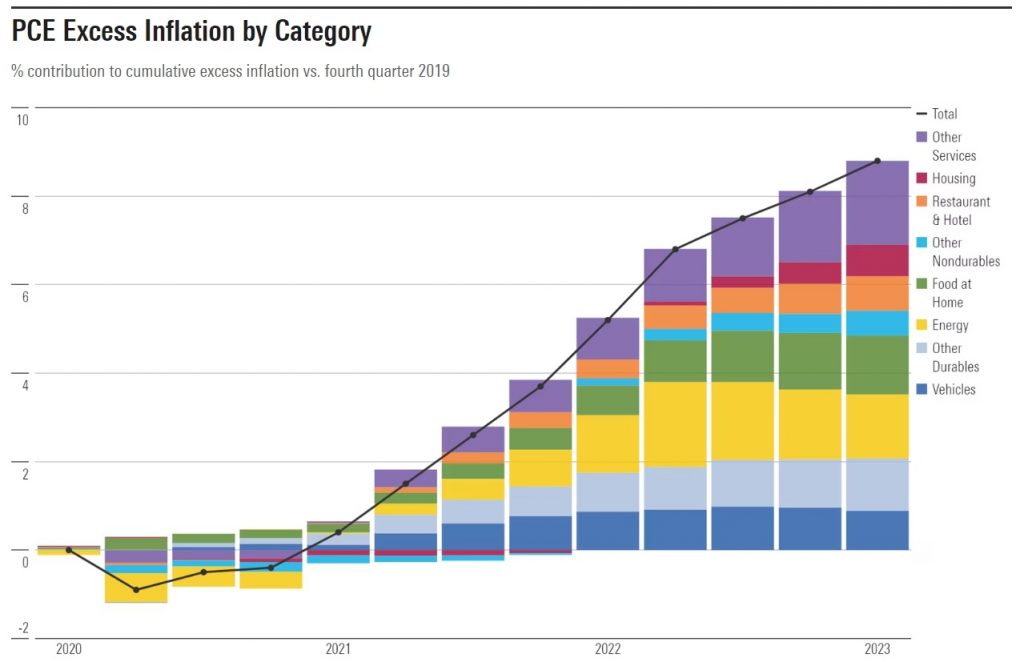
- The above graph describes the PCE (personal consumption expenditure) excess inflation by category 2022.
In the fourth quarter of 2022,
- Vehicles rate=1%,
- Other durables=2.1%
- Energy=3.8%
- Food at home=5.8%
- Other nondurable=5.3%
- Restaurants and hotels=6%
- Housing=6.2%
- Other services=8.1%
In 2023,
- Vehicles rate=0.9%,
- Other durables=2.1%
- Energy=3.7%
- Food at home=5.8%
- Other nondurable=5.4%
- Restaurants and hotels=6.2%
- Housing=6.5%
- Other services=8.9%
The Car Inflation Rate in the U.S.
- The sales of new vehicles were forecasted at 14.4 million in 2022.
- The sales of used cars and trucks increased by 25.8% in 2022 from last year.
- In June 2022 the cost of manufacturers and distributors increased by 6.4%.
- The productivity decreased because of the delay in parts delivery by 97% in 2022.
The Change in the Inflation Rate of the United States Housing
- The above graph is representing
- In 2022, the rate of inflation was 7.15% which cost near about $977,121.94.
- In 2023, it reduced and become 4.97% which is almost equivalent to $1,025,650.30.
(Reference: owner.com)
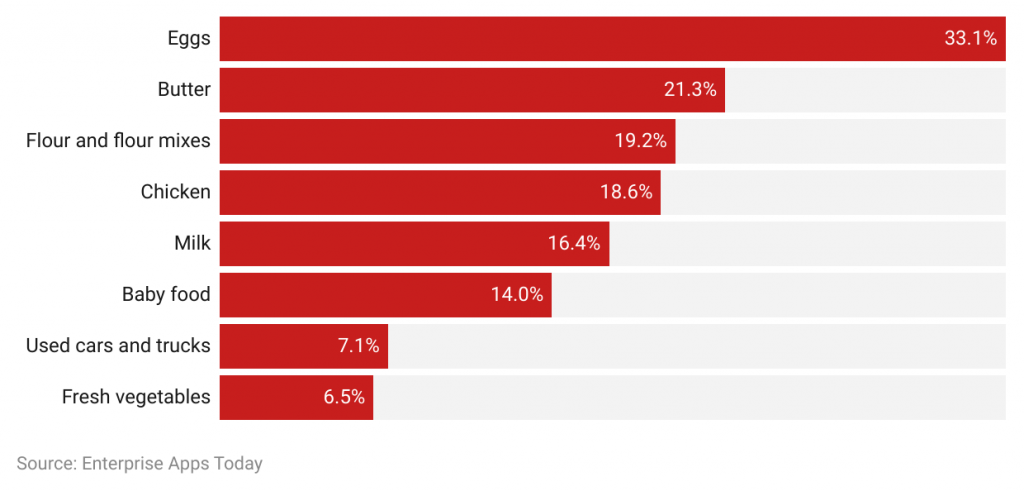
- The higher inflation rate has been affected badly by increasing the prices of food staples in the U.S., in 2022.
- Eggs = 33.1%, Butter = 21.3%, Flour and flour mixes = 19.2%, Chicken = 18.6%, Milk = 16.4%, Baby food = 14%, Fresh Vegetable = 6.5%.
Restaurants and Hotel Statistics
- In 2022, 65% of American people preferred local restaurants more.
- The annual sales rate was expected to be $ 898 billion in 2022, along with an increase of 12.4% since last year.
- By the end of 2022, it was expected to earn $ 63 billion in the sector of online delivery.
- Around $ 3,000 has been spent by the average American people only on restaurants.
The above graph describes the change in the inflation rate of the United States clothing and footwear sector in 2022-23.
- 31st January, 2022 = 5.40%
- 28th February = 6.80%
- 31st March = 7.20%
- 30th April = 6.10%
- 31st May = 5.60%
- 30th June = 5.80%
- 31st July = 5.70%
- 31st August = 5.60%
- 30th September = 5.80%
- 31st October = 4.70%
- 30th November = 3.80%
- 31st December = 3.10%
- As of April 2023, the rate is 3.30%.
(Reference: tradingeconomics.com)
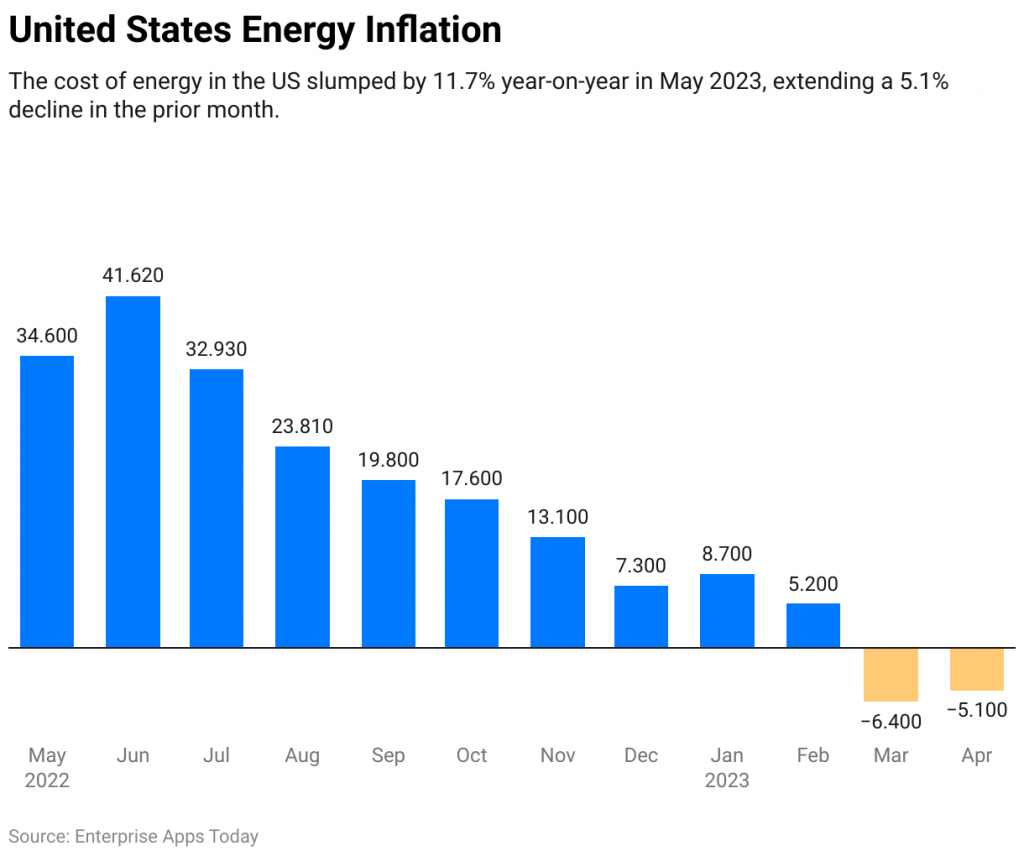
- The above graph explains the change in the energy inflation rate in the United States.
- In May 2022 the rate increased highest with 41.62%.
- By the end of December 2022, the rate decreased to 7.3%.
- In January 2023 again the rate increased to 8.7%.
- As of April 2023, the rate turned to -5.1%.
(Reference: statista.com)
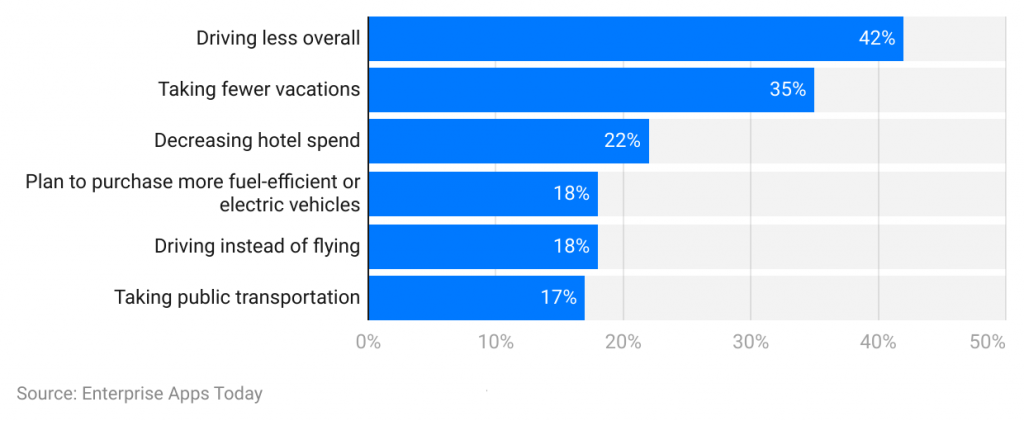
- The above graphs show the proportion of consumers who have cut back on travel expenses due to inflation in 2022.
- 42% of people have reduced driving just to balance the rising expenses.
- 35% planned for fewer vacations.
- 22% have reduced their expenses on hotels and restaurants.
- Only 18% have planned for buying vehicles.
- 18% just preferred driving instead of flying.
- 17% have started to take public transportation.
Inflation Momentum Change in the United States
- This shows how the American goods and service sector have broadened its price growth in 2022.
- From the end of last year, the rate started to increase, and by the 1st quarter of 2022, the rate reached above 4%.
- By the end of 2022, the growth of prices turned to 5% – 5.5%.
- As a result of these reasons, employees now have more power in negotiations to demand higher salaries, which has raised both wages and prices as businesses raised prices to offset rising labor expenses.
(Source: nytimes.com)
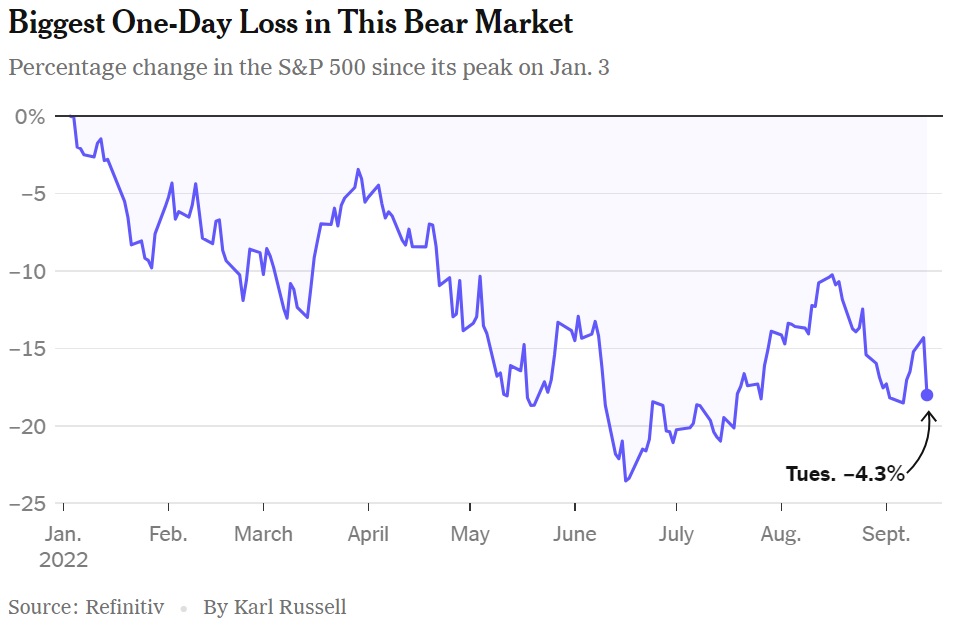
- The above graph describes the effect of the inflation rate on the U.S. stock market in 2022.
- This graph portrays the change in the percentage of the S&P 500 from January to September.
- 2022 had a terrible drop in the stock and bond markets that resulted in pathetic conditions.
- In September, there was the biggest one-day loss of -4.3%.
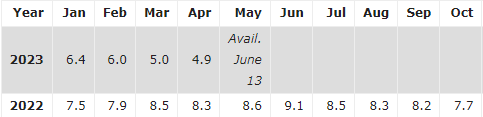
- The above chart has been published by the U.S. Bureau of Labor Statistics by analyzing the current inflation rates of the United States in 2022 and 2023.
- According to the labor department on 10th May 2023, the annual inflation rate was 4.9%.
- The next rate is going to publish on 23rd June 2023.
- In 2022, the annual rate was 6.5%.
(Source: visualcapitalist.com)
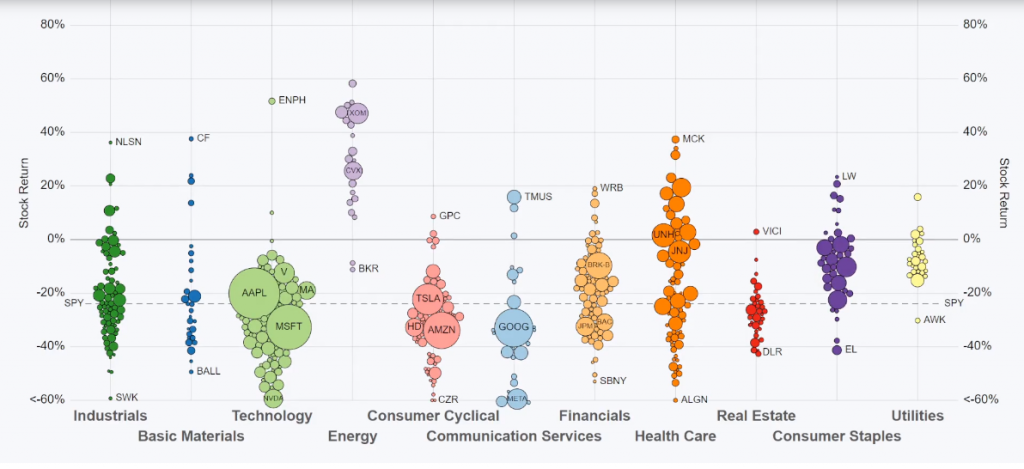
- The above graph shows depicts the S&P 500 performance with different sectors of the U.S. in 2022.
- The total SPY of 31st January = -5.3%
- 28th February = -8.1%
- 31ST March = -4.6%
- 29th April = -13%
- 31st May = -12.8%
- 30th June = -20.0%
- 29th July = -12.6%
- 31st August = -16.2%
- 30th September = -23.9%
- The overall graph has fallen by 15.3 times in 2022.
- As of 2023, though the graph has increased by 18.5 times.
- According to Wall Street's forecast, the S&P earnings growth in 2023 has decreased to 1.6%.
- The S&P 500 index is up 4.1% in 2023, following a 19.4% decline in 2022.
Conclusion
After covering all the important statistics, it can be stated that inflation is a crucial economic indicator for a nation. In the year 2022, the impact of inflation on an individual’s purchasing power and the potential decline in the standard of living will turn into a significant economic problem in the United States. It has been concluded that the main reasons for the rise in inflation in the nation were the COVID-19 pandemic and the war between Russia and Ukraine.
Thus, from the above statistics, it is clear that in June 2022, the United States inflation rate rose to 9.1%, and in April 2023, the US annual inflation rate surprisingly dropped to 4.9%. This article also includes many significant graphs, data, and charts that are attached above and will help you grasp the subject significantly.
Sources
FAQ.
The rate of price growth over an extended period is known as inflation. It can also be broadly evaluated as an increase in a country's cost of living or prices.
There are various reasons for high inflation such as problems in supply chain management, higher customer demands, money supply increment, etc.
The Consumer Price Index (CPI), which is based on an annual evaluation of the entire market, is used to measure inflation.
One is Covid-19 pandemic and other is Russia-Ukraine war.

Barry is a lover of everything technology. Figuring out how the software works and creating content to shed more light on the value it offers users is his favorite pastime. When not evaluating apps or programs, he's busy trying out new healthy recipes, doing yoga, meditating, or taking nature walks with his little one.