
Microsoft Statistics By Revenue, OS Popularity and Users
Page Contents
- Introduction
- Editor’s Choice
- Facts About Microsoft
- General Microsoft Statistics
- Microsoft Overall Revenue Statistics
- Microsoft Intelligence Cloud Sector Statistics
- Microsoft Computing Segment Statistics
- Microsoft Gaming Statistics
- Enterprise Service Statistics
- Microsoft Windows Statistics
- Search Advertising Statistics
- Microsoft 365 Price Statistics
- Microsoft's Global Revenue and User Geography
- Desktop Operating System Popularity in the U.S
- Microsoft 365 Users By Age Groups
- Who's Using Microsoft 365 and When?
- Some Important Statistics
- Conclusion
Introduction
Microsoft Statistics: In a world with lots of computer software, Microsoft is termed the largest software maker and also produces computers, gaming hardware, cloud computing services, video games, and many different online services. This is a multinational company in America that was founded by Bill Gates and Paul Allen in 1975 and is headquartered in Redmond, Washington. According to reports, the annual revenue earned by Microsoft’s company in 2022 was $198.27 billion globally and in 2023 the market capitalization is expected to reach $2.75 trillion. These Microsoft Statistics include different insights from every important section for providing better light on the topic.
Editor’s Choice
- As of June 30, 2023, Microsoft's earnings for that quarter stood at a cool $56.189 billion.
- That's a solid 8.34% jump compared to what they made the same time last year.
- Microsoft revenue for the twelve months ending June 30, 2023 was $211.915 billion, a 6.88% increase year-over-year.
- The annual revenue of Microsoft company was $198.27 billion with an increase of 17.96% in 2022 than last year in the United States and an operating income of $83 billion.
- The market revenue of the company has increased by 7.81% from March 2022 was $207.591 billion.
- In the 1st quarter of 2023 till 31st March, the revenue had increased by 7.08% from last year resulting in $52.857 billion.
- In June 2022, Microsoft 365 earned $16.6 billion.
- By the end of 2nd quarter, Microsoft Azure has earned $20.9 billion.
- Microsoft Windows' quarterly income of June 2022 was $14.4 billion.
- As of 2022, the net income earned by Microsoft was $72.7 billion.
- Microsoft Azure's cloud computing sector had created a milestone.
- The net profit earned by the company in the 2nd quarter of 2022 was $16.7 billion with a 32% increased margin.
- According to Statista, by the end of 2022, the company has enhanced mainly in business communication platform which resulted in around 18 million active users.
Facts About Microsoft
- The total revenue of Microsoft has increased in 2022 by 18% from last year's with a total amount of $198.270 billion.
- The primary sources of Microsoft are Microsoft Office 365 (products and services), Azure products and cloud services, and Microsoft Windows.
- By the end of 2022, the annual income of every source has increased from last year, Microsoft Office products and services by 23% and Microsoft Azure and other services of cloud by 22%, and Microsoft Windows by 12%.
- Importantly, Microsoft Office itself generated $44.9 billion in revenue in 2022 which has increased by 13% from last year. Most of the revenue was generated from subscriptions to Microsoft Office 365.
- Microsoft Azure itself earned annual revenue of $44 billion in 2022 with an increase of 45% from last year.
- The annual revenue of Microsoft Windows has also increased by 7% in 2022 resulting in $1.5 billion.
- As of 2022, Microsoft Company was having 122,000 full-time employees in the United States and 99,000 international employees. Out of which 48.3% of U.S. employees were white and 69% were men.
- The productivity software market is enjoying 50% of the market share in Microsoft Office.
- Microsoft stores are currently available with more than 669,000 applications.
General Microsoft Statistics
- As of 2022, the market cap of Microsoft has reached $1.91 trillion.
- Over the world for cloud computing services, Microsoft Azure has been used by 70% of organizations in 2022.
- Microsoft Azure has also been trusted by 95% of Fortune 100 companies.
- Microsoft Office 365 has been used by 4 out of 5 Fortune 500 companies in 2022.
- Whereas Microsoft Windows covered 28.79% of operating systems across the globe in 2022.
- The active devices of Microsoft Windows in 2022 were 1.6 million.
- Microsoft Edge was used by 158 million people by the 4th quarter of 2022.
- According to Statista, by the end of 2022, the company has enhanced mainly in business communication platform which resulted in around 18 million active users.
- In the 4th quarter of 2022, Microsoft noticed a financial slowdown but secured profitable overall success.
- The company has hired 221,000 employees which is around a 22% increase in 2022 than last year.
- As of 2022, the net income earned by Microsoft was $72.7 billion.
- Operating cash flow turned out $89 billion.
- Payments of investors resulted in $50.8 billion which has increased by 16% by 2021.
Microsoft Overall Revenue Statistics
- For the quarter ending June 30, 2023:
- Microsoft pulled in a hefty revenue of $56.189 billion.
- This marked a growth spurt, jumping 8.34% from the same time last year.
- Over the entire year up until June 30, 2023:
- The tech giant raked in an impressive $211.915 billion.
- Yearly comparison shows they're on a roll with a 6.88% growth.
- A sneak peek into Microsoft's quarterly earnings in 2022:
- By the end of March, they were at $49,360.
- As summer began in June, they saw a bump to $51,865.
- Come fall in September, a slight dip occurred with $50,122.
- Rounding off the year in December, they closed with $52,747.
- And how's 2023 shaping up?
- The first quarter saw a decent $52.12 billion.
- The second quarter saw a marginal rise, touching $52.75 billion.
All in all, Microsoft's financials show robust growth and consistent performance through the quarters.
Microsoft Intelligence Cloud Sector Statistics
- The Intelligent Cloud includes Azure Cloud, Windows server, Nuance, Enterprise Services, and SQL server.
- Microsoft Azure cloud computing sector had created a milestone by the end of 2022.
- Revenue generated from Azure in 2022 was $44 billion which has increased by 45% from last year.
- The revenue of Microsoft Cloud’s
- 1st quarter = $17.06 billion.
- 2nd quarter = $18.33 billion.
- 3rd quarter = $23.40 billion.
- 4th quarter = $20.91 billion.
- The total revenue earned = $65.29 billion.
- The overall revenue of this sector has increased by 28% from last year.
- In 1st quarter of 2023, total revenue = $20 billion with an increase of 22% since 2022.
- 2nd quarter, 2023 = $21.51 billion with an increase of 18% since 2022.
Microsoft Computing Segment Statistics
Microsoft's computing segment encompasses an array of products and services. From the foundational Windows operations to gaming, sleek surface devices, news platforms, and the world of search advertising, this segment is richly diverse.
Let's look at their financial journey:
- As spring blossomed in March 2022, the segment's revenue stood at a strong $14.520 billion.
- Come June 2022, there was a slight dip, pulling the revenue down a notch to $14.356 billion.
- By the time the autumn leaves started to fall in September 2022, there was a noticeable upward surge, with revenues rising to $15.790 billion.
- As we toasted to the New Year in December 2022, the segment was riding high with a revenue of $16.600 billion.
However, 2023 brought in some challenges. The first quarter of the year saw a dip, as the segment's revenue receded to $13.3 billion. Thankfully, the second quarter showed signs of recovery, with a revenue climb up to $14.2 billion.
The fluctuations are natural, but the resilience and potential of Microsoft's computing segment remain evident.
Microsoft Gaming Statistics
Microsoft's journey in the gaming realm in 2022 was a rollercoaster. The year wrapped up with an overall gaming revenue of $16.23 billion, which might sound substantial, but it's worth noting that this was a decrease from previous figures. However, even in the face of this dip, it's heartening to see a resilient 8% growth from the numbers of 2021.
A significant bump in the road was the Ukraine-Russia War. This geopolitical event had far-reaching economic ramifications, with Microsoft's Xbox services feeling the sting. In 2022, this sector suffered a substantial 13% blow.
Yet, even amidst challenges, the Xbox remained a key player in Microsoft's gaming portfolio. A whopping 80% of the company's gaming revenue was thanks to Xbox content and services.
As for a quarterly breakdown:
- In the first quarter of 2022, the revenue clocked in at $3.59 billion.
- Fast forward to the first quarter of 2023, and things looked pretty steady, albeit with a slight upward nudge, resulting in $3.61 billion.
- By the second quarter of 2023, there was a heartening leap with revenues touching $4.76 billion.
Challenges aside, Microsoft's gaming segment, led by Xbox, continues to be a formidable player in the industry, showing promise and adaptability.
Enterprise Service Statistics
- The total revenue earned from the Enterprise service of Microsoft in 2022 was $47.4 billion which has increased by 7% in last year.
- Only 4% of this sector’s revenue has contributed to the overall revenue of Microsoft.
Microsoft Windows Statistics
- In 2022, overall revenue earned from Microsoft Windows was $24.8% which has increased by 7% from last year.
- In the revenue stream, Windows was placed in the 3rd position.
- Around 59% of revenue came from Original Equipment Manufacturers (OEM) by licensing.
- Out of total Microsoft revenue, almost 12% is generated by Windows.
Search Advertising Statistics
- The revenue gained by Search advertising of Microsoft has been generated in 2022 was $11.6 billion which has gained by 36% since 2021.
- This sector has created only 6% of its share in overall Microsoft revenue.
Microsoft 365 Price Statistics
If you're considering diving into the world of Microsoft 365, here's what you need to know about the pricing:
- At the top tier, we have Microsoft 365 Business Premium. This comprehensive package comes in at $22 per user each month. Ideal for those who are looking for a full suite of advanced features, tools, and integrations.
- Next in line is the Microsoft 365 Business Standard. A balanced offering for many businesses, it's priced at a moderate $12 per user every month.
- For those who primarily need the suite of apps without the additional frills, Microsoft 365 Apps for Business might be the right fit. It's set at a rate of $8.25 per user monthly.
- Lastly, for startups or businesses that need just the essentials, there's Microsoft 365 Business Basic. This version offers foundational features for just $6 per user each month.
So, whether you're a thriving business or just getting started, Microsoft 365 has a range of pricing options to cater to varied needs and budgets.
Microsoft's Global Revenue and User Geography
In 2022, Microsoft made some big bucks, and here's how it was spread around the world:
- The United States, being their home turf, saw a significant chunk of their revenue. They pulled in a whopping $100.2 billion from the U.S. alone! And guess what? This was a pretty solid jump from the previous year, shooting up by 19%.
- Outside of the U.S., the story was equally impressive. They raked in $98.1 billion, marking a growth of 17%. So, the global appeal of Microsoft products is pretty evident.
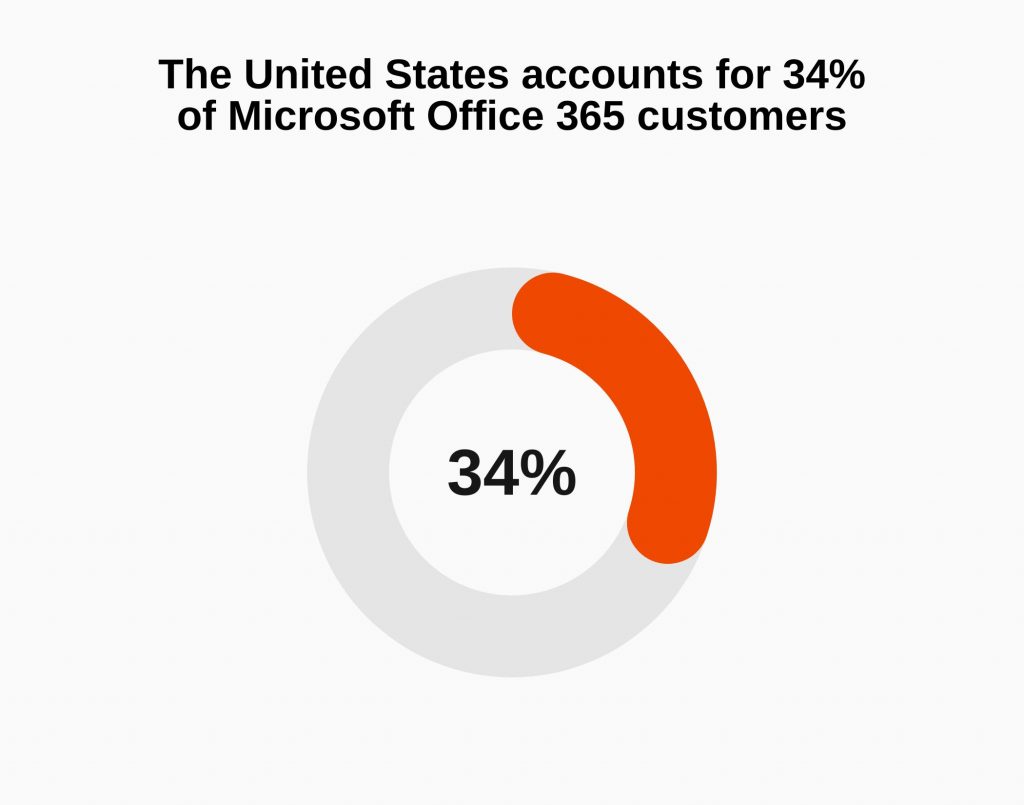
Now, let's talk about who's using Microsoft Office 365 and where:
- The United States leads the pack, accounting for 34% of users – the biggest slice of the pie.
- Over in the United Kingdom, they've got 8% of users hooked to Office 365.
- Australia comes next with 4%.
- Our neighbors in Canada, along with Germany and the Netherlands, each contribute 3% to the user base.
- France chimes in with 2%.
- Then, there's Belgium, Switzerland, and Brazil, each representing 1%.
- And as for everyone else in the world? They collectively make up the remaining 40%.
In simple words, Microsoft's products are loved everywhere, with the U.S. being their top fan, but the rest of the world isn't too far behind. Whether it's revenue or user stats, Microsoft's global footprint is massive.
Desktop Operating System Popularity in the U.S
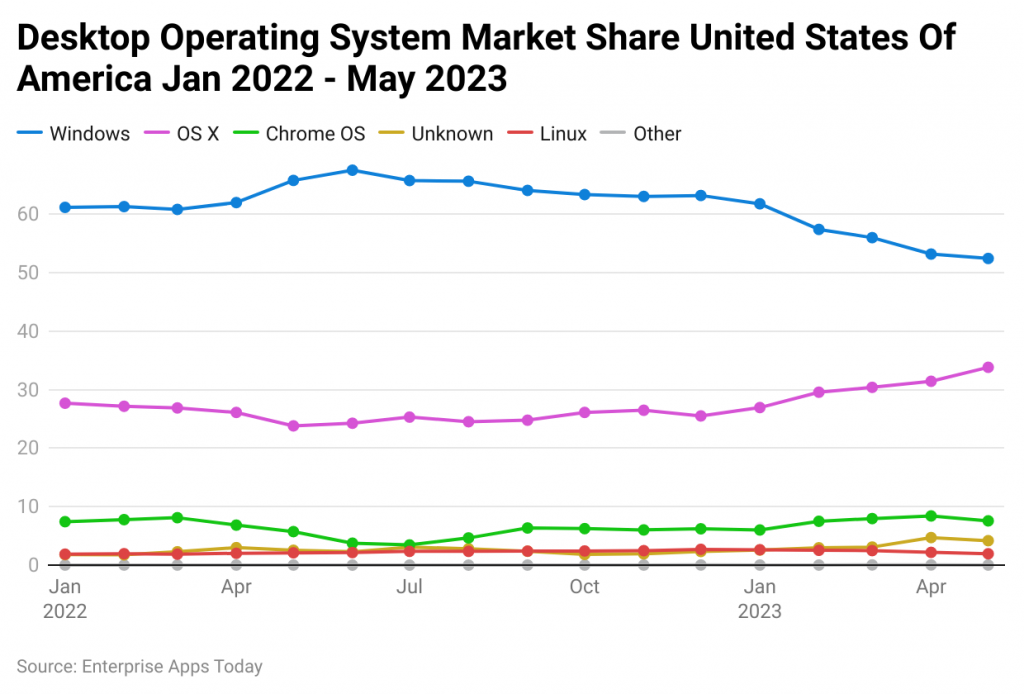
(Source: gs.statcounter.com)
Looking at the line graph for the U.S. operating system landscape from January 2022 to May 2023, here's the breakdown:
- Windows has seen its ups and downs:
- 1st Quarter 2022: It was leading the pack with 60.85% of users.
- 2nd Quarter: It surged to 67.56%.
- 3rd Quarter: A slight dip, settling at 64.1%.
- 4th Quarter: It continued to decrease slightly to 63.23%.
- 1st Quarter 2023: A jump back up to 65.02%.
- But by May 2023, Windows took a noticeable drop, standing at 52.46%.
- OS X held its ground in 2023 with 33.84% of users, showcasing its consistent appeal.
- Chrome OS, while not as dominant as Windows or OS X, carved out a niche with 7.57%.
- Linux, known for its customizability and open-source nature, catered to a smaller audience with 1.94%.
- The remaining operating systems, which could be a mix of less popular ones, collectively took up 4.18% of the market.
While Windows remained a major player throughout this period, there were some interesting shifts, especially its drop in May 2023. Meanwhile, other operating systems like OS X and Chrome OS held their own respective segments of the market.
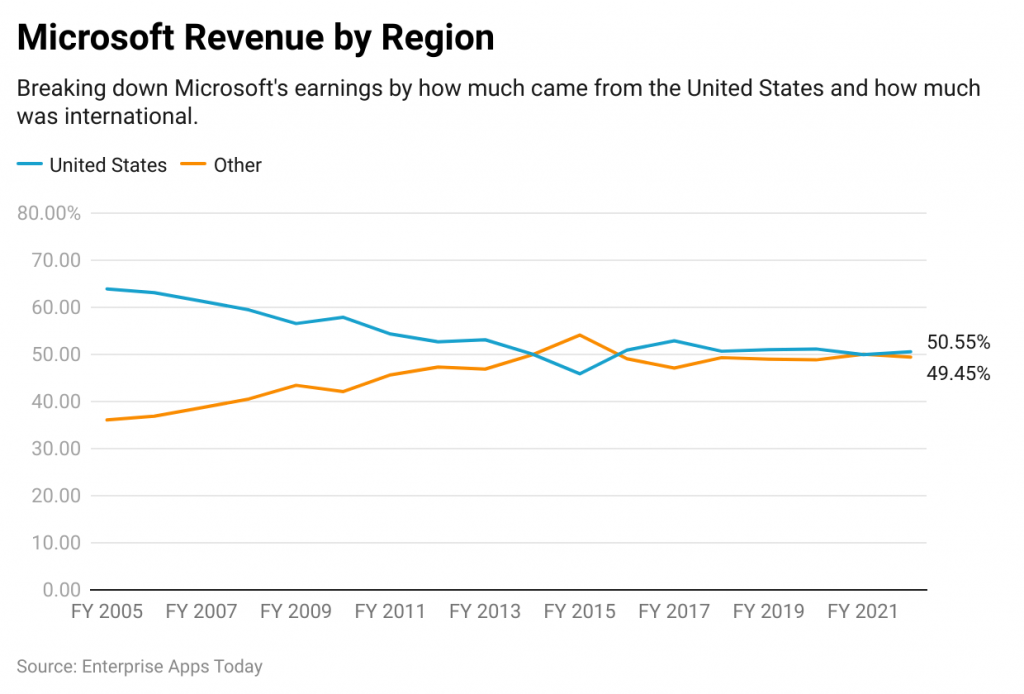 (Reference: wallstreetzen.com)
- The above representation describes that the maximum revenue earned by Microsoft company came from the United States by 50.55% and other countries by 49.45% in 2022.
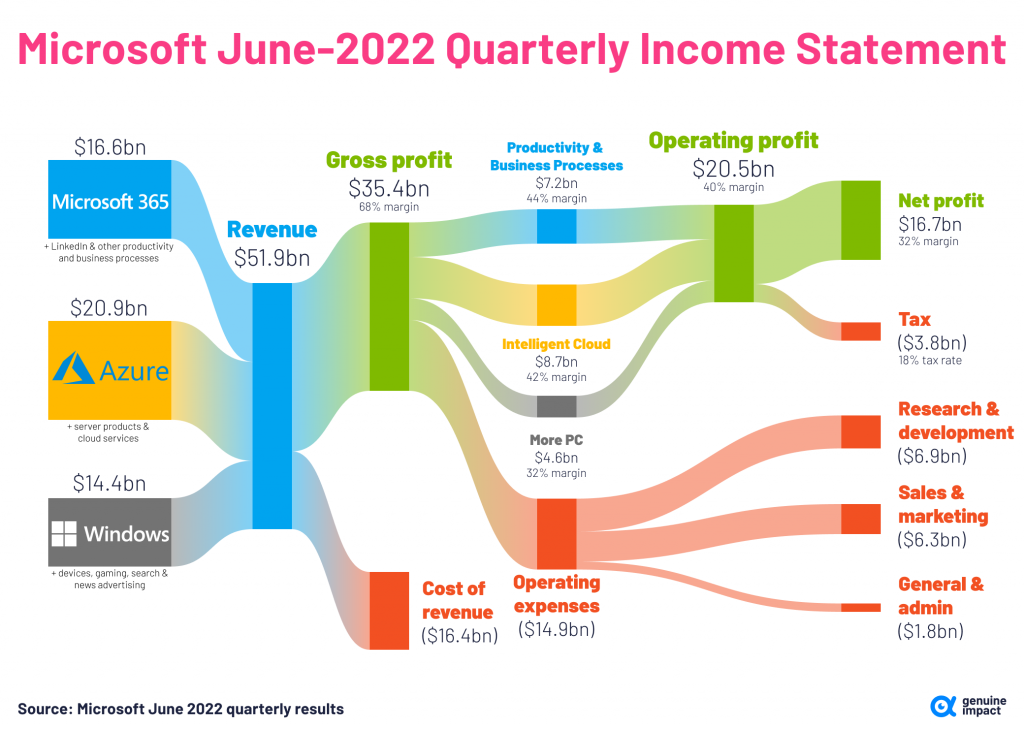
(Reference: visualcapitalist.com)
- The above figure represents the income statement statistics of Microsoft in June 2022.
- The total revenue of Microsoft 365, Azure, and Windows was $51.9 billion.
- The overall cost of revenue turned out $16.4 billion, and the gross profit was $35.4 billion.
- The productivity and business process of Microsoft 365 increased by 44% margin resulting in $7.2 billion.
- Service products and an intelligent cloud of Azure increased by 47% margin with $8.7 billion.
- The margin of more Windows PC increased by 32% margin with $4.6 billion.
- The operating costs of the 3 sectors of Microsoft were $14.9 billion and operating output increased with a 40% margin resulting in $20.5 billion.
- The net profit earned by the company also resulted in $16.7 billion with a 32% increased margin.
- Tax payment = $3.8 billion, Research and development = $6.9 billion, Sales and marketing = $6.3 billion, General and admin = $1.8 billion.
Microsoft 365 Users By Age Groups
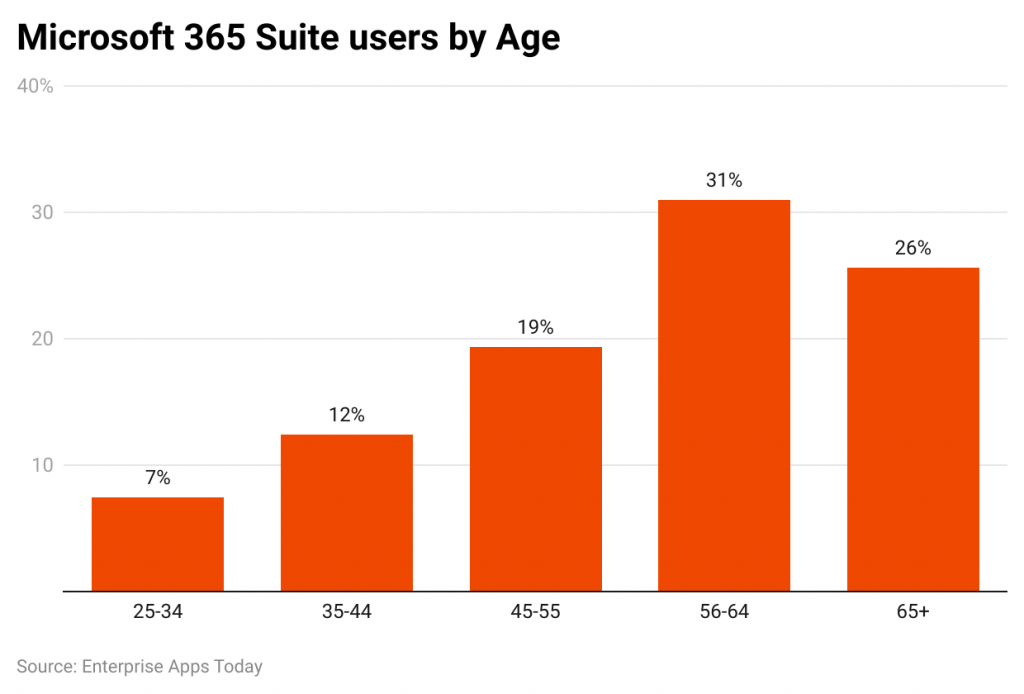
(Reference: assets.website-files.com)
Let's take a look at who's really using Microsoft 365 in 2022, based on age:
- The young adults, those aged 25-34 years, are the top users! Almost 31% of Microsoft 365 users fall in this age bracket. It seems like this age group, probably settling into their careers, heavily relies on the suite.
- Following closely are the teens and early adults between 15-24 years. They make up 25.6% of the user base. With schoolwork, college, and perhaps early jobs, Microsoft 365 seems to be their go-to.
- The mid-adults ranging 35-44 years are also big fans, with 19.33% using the suite. They might be in the prime of their professions, so it makes sense they'd use Microsoft 365 often.
- The age group 45-55 years has 12.41% of folks using the suite. A bit lower, but still a decent chunk, showing that the suite's tools are versatile for different age groups.
- Those 55-64 years old represent 7.42%. As we move to the older age groups, there's a bit of a dip, but they're still onboard with the digital world.
- Finally, our seniors, aged 65+ years, are not to be left out. 4.30% of them are actively using Microsoft 365. It's always great to see tech being embraced by every age!
In simpler words: From young adults to seniors, a whole range of ages use Microsoft 365. While the younger crowd dominates, every age group finds value in it.
Who's Using Microsoft 365 and When?
Let's unpack how often people in the U.S. are using Microsoft 365 and which industries are most involved:
Usage Frequency:
- Every month, a whopping 28.75 million Americans used Microsoft 365. That's a lot of folks creating documents, crunching numbers, and sending emails!
- On a daily basis, about 958,333 users logged in. Imagine a city's worth of people hopping on Microsoft 365 each day!
- And if you break it down further, every hour saw around 39,930 users active. That's like a large stadium filled with people all using the suite at the same time!
Industry Breakdown:
- The construction sector led the pack with 6%. Building plans, project timelines? They got it covered with Microsoft 365.
- Information technology and retail sectors were next in line with 4% each. Techies and shop owners alike found the tools handy.
- Hospitals, healthcare folks, and those in financial services each represented 3%. From patient records to financial reports, they got their tasks done using the suite.
- A mix of industries, including marketing, advertising, hospitality, computer software, real estate, and educational management, each made up 2%. It's clear that no matter the job, Microsoft 365 had something to offer.
- And a vast 70% came from the “Others” category. This means Microsoft 365 is diverse and caters to all sorts of professions beyond the ones listed!
Lots of people in the U.S. use Microsoft 365, whether it's once a month or every hour. And from construction workers to teachers, people from all job fields find the suite super useful.
Some Important Statistics
- Microsoft products and services were used by 1.4 billion people in the world in 2022.
- The global operating system of the Microsoft market was used by 43%.
- Microsoft Office is actively used by 83% of business organizations.
- Microsoft Access holds a market share of 11% including Office, Excel, and PowerPoint.
- As of 2023, 145,844 customers in the United States are using Microsoft Office 365 which accounts for 34%.
- The annual revenue of Microsoft 365 suit was $63.36 billion in 2022, which has increased by 17.51% from 2021.
- Male users of Office 365 were 49.71% and female 50.29%.
- Microsoft 2022 has invested $24.512 billion in its Research and Development which is more than $20.716 billion from the past year.
- The company has spent $21.83 billion on Sales and Marketing department.
Conclusion
After covering up the article on Microsoft Statistics it is clear that Microsoft is the leading technological company in the United States and as well as across the world that is linked with thousands of businesses and people. The company generates a huge range of revenue by developing, designing, licensing, and delivering various software products and cloud-based services worldwide. This article includes many important statistics about the various sectors of the company, which hope will enable a better understanding.
Sources
FAQ.
The basic application installation as well as learning training of Microsoft is free of cost and easily available for everyone who is interested in those products.
This is a platform of cloud-powered productivity that includes word, Excel, PowerPoint, One Drive, and Outlook. This can be easily installed and used on desktops, laptops, mobile or tablets.
As of 2023, there are near about 1.4 billion users including businesses and people are using Microsoft actively, and in the United States 28,750,000 users on a monthly basis.

Barry is a lover of everything technology. Figuring out how the software works and creating content to shed more light on the value it offers users is his favorite pastime. When not evaluating apps or programs, he's busy trying out new healthy recipes, doing yoga, meditating, or taking nature walks with his little one.